USDCAD - Range is 1,28 to 1,27Our updated USDCAD chart: price in a wedge, volatility will arise in the next 2-3 working days. The range is 1,283 for Long set-ups and 1,27 for Shorts.
Most likely a drop.
ps. both Canada and the US had bad data. Oil prices high helps the Cad against the USD
Usdcadsetup

USD/CAD Rise coming to an EndThis looks like it has run out of steam and will continue back downwards. EMA's are close to crossing and MACD looks set to go bearish.
Target is the previous low at 1.25899

Bearish Bat PatternUSDCAD BEARISH BAT PATTERN
Market Sell Order Set Up.
Sell Entry: (1.28552)
Min Take-Profit: (1.28156)
Max Take-Profit: (1.27861)
Stop-Loss: (1.29012)
Max Risk-Reward: (1.50)
Smash a Like button and leave a Comment, I appreciate every support. Goodluck.

USD/CAD BUY THE PULLBACKTechnical Overview: - USD/CAD
While the the obvious trend is bearish, we are out here doing the opposite.
Trading is all about your mental decisions, and our outlook changes our outcome.
Since price had dropped, this created a huge discount for hedge funds to enter in on cheaper prices.
We are bullish simply because price is oversold from a HTF.
Smaller time frame suggests downside, this could be used as an opportunity to enter in when price is falling.
Analysis is only 1 piece of the puzzle 🧩
Our analysis is a sentiment for the upcoming week, month.
Use this as a weather forecast, you are the person that has to put on a jacket when it’s raining.
Trade this sentiment based off your own entry strategy at the right time.
Flow with the Devil 😈
Trade with the manipulation👾

USDCAD, Pullback to test resistance, ShortUSDCAD, Pullback to test resistance and Strong Trend Line!

USDCAD - Full Analysis BreakdownWelcome traders to a free analysis breakdown.
Today I am highlighting possible trade ares on USDCAD, if you any questions on the pair let me know in the comment section below.
Once the pair gives us a valid trade entry I will be sharing the trade with the Alpha community, I hope you all found this breakdown helpful .
If you liked this free educational please like and follow the channel, there is lots more valuable content right around the corner.
Feel free to comment a pair or subject you would like me to cover next.
Trade Safe
Alpha Trading Group.

USDCAD ANALYSISUSDCAD ANALYSIS
Please consider to put a like to my idea for supporting me & subscribe for more ideas.
Idea is not the financial advice!

USDCAD: Ending Diagonal PatternIn some cases, we cannot detect the main trend clearly. But there are patterns that are helpful, they temporarily show the trend. One of these patterns is Diagonal.
As you can see in the image, the Diagonal pattern is formed and we are waiting for the price to increase to the range of 1. 3411. To get the confirmation for the uptrend, the price should cross the range of 1.2835.
In addition, convergence is evident in RSI. This analysis will be violated by crossing the price from the range of 1.2588.

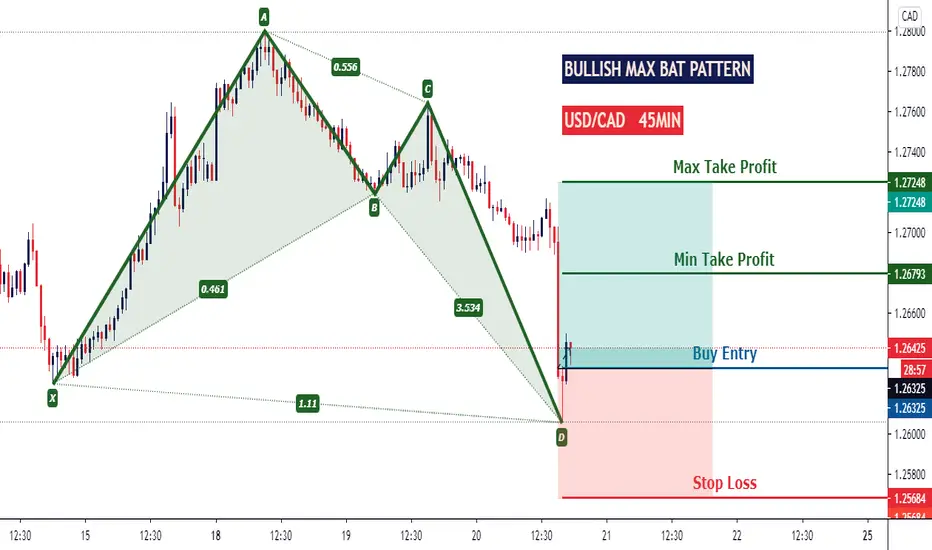
Bullish Max Bat PatternUSDCAD BULLISH MAX BAT PATTERN
Market Buy Order Set Up.
Buy Entry: (1.26325)
Min Take-Profit: (1.26793)
Max Take-Profit: (1.27248)
Stop-Loss: (1.25684)
Max Risk-Reward: (1.44)
Smash a Like button and leave a Comment, I appreciate every support. Goodluck.

USDCAD Technical Analysis 4h Timefram SHORT position OPENEDBearish trend line respected, US dollar seems bearish.


USD/CAD PAIR BREAKDOWN👋 Hey there traders, and welcome to a brand new pair breakdown!
📌 If you like the content that I produce for you all, show some love by smashing the like and follow button, also, leave a comment! That keeps me motivated to produce more content!
📌 Why should you follow me on Tradingview?
I'm transparent.
I provide educational content.
High probability setups
I explain all my steps in-depth
📥 If you would like me to analyze a pair, or discuss something educational and or trading related, let me know via private message, or drop a comment! I always respond to all the comments! :)
Keep in mind that the analysis provided is not 100% accurate and that you can never be certain about the markets. This information given is not financial advice, always do your own research.
Thank you for your time, and let's destroy the markets together!

Bullish Gartley PatternUSDCAD BULLISH GARTLEY PATTERN
Market Buy Order Set Up.
Buy Entry: (1.27120)
Take-Profit 1: (1.27545)
Take-Profit 2: (1.27854)
Stop-Loss: (1.26668)
Max Risk-Reward: (1.62)
Smash a Like button and leave a Comment, I appreciate every support. Goodluck.

Bearish Gartley PatternUSDCAD GARTLEY PATTERN
Market Sell Order Set Up.
Sell Entry: (1.27612)
Take-Profit 1: (1.27126)
Take-Profit 2: (1.26807)
Stop-Loss: (1.28021)
Max Risk-Reward: (1.97)
Smash a Like button and leave a Comment, I appreciate every support. Goodluck.

USDCAD, The price action tells, shortUSCAD shows a very good sign of short position.
+ Breakout Descending Triangle pattern
+ Strong Support Becomes Strong Resistance
+ The Price Action tells Short

USDCAD, Approaching Significant Support, ShortMonthly Structure tells a nice price action story.
+ Exaggerated Divergence
+ Significant Support
+ The momentum tell further below
+ Double Top

USD/CAD Buy Opportunity Technical Overview: - USDCAD has been on a bearish run past the few months leading up to January.
We know this is a monthly trend that many people have sold based off and many people have swing trades positions to the downside.
The markets is not yet done, we may have more downside to around 1.2600 Zone which would be a much better R:R at a discounted price.
Fundamental Overview: - DXY is gaining bullish momentum because of recent high impact NFP news and unemployment change rate.
Analysis is only 1 piece of the puzzle 🧩
Our analysis is a sentiment for the upcoming week, month.
Use this as a weather forecast, you are the person that has to put on a jacket when it’s raining.
Trade this sentiment based off your own entry strategy at the right time.
Flow with the Devil 😈
Trade with the manipulation👾

USDCAD Near supportThis pair is strugling near its support line now it may get little rejection and then break the support.

usdcad longIn case of breaking the trend line and reaching the specified area and the presence of return signs, the purchase transaction can be entered by observing the loss limit.
Of course, note that now is not the right time to enter the trade, and this is just an analysis, and just pay attention to the fact that now the chart has a good and significant situation.


