Short opportunity on 15 min USDCAD chart...Major turn level shows on USDCAD chart.
Short opportunity seems on this chart.
Risk-Reward is so logical.
Trade safe.
Good luck.
Usdcadshort

USSCAD: A SHIFT IN DOLLAR?Reuters reports dollar retreats from 2 months high.
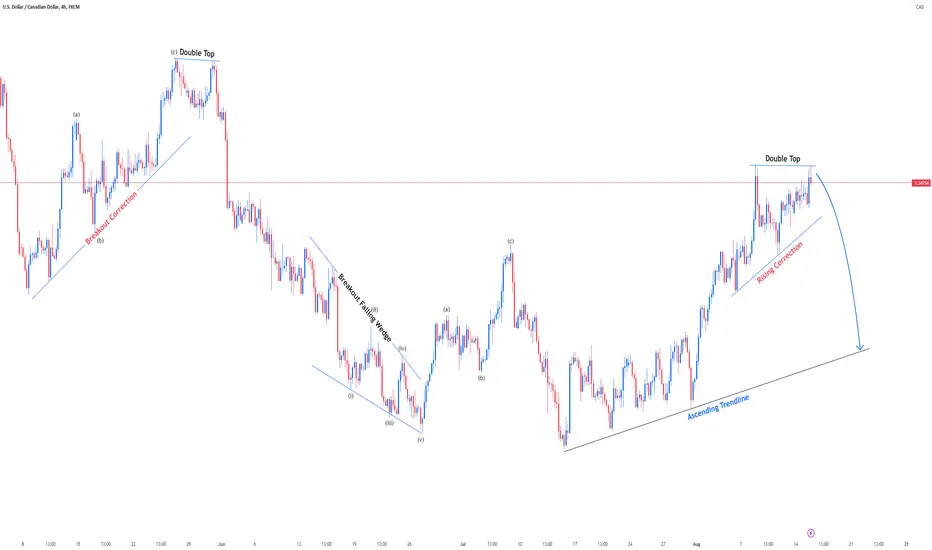
An interesting observation and looking at the charts, we can see a text book chart pattern.
Downward trend and a retest to a significant level.
We understand a fake out from the descending price could happen.
Watch out. Comment what you think

USDCADBased on the ascending channel that has lasted for more than 10 days and the formation of a descending head and shoulder pattern after reaching the supply zone within a 4-hour timeframe, the possibility of a price correction according to the chart is plausible.

USDCAD Possible reversalDear All,
There is 2 harmonic active formations on USD CAD.
this is not a financial advice, it is just my notes.

USD CAD SCALPRisk 0.5%
TP1 = 1:2 RR
Disclaimer:
The contents in this Idea are intended for information purpose only and do not constitute investment recommendation or advice. Nor are they used to promote any specific products or services. They serve as an integral part of a case study to demonstrate fundamental concepts in risk management under given market scenarios. A full version of the disclaimer is available in our profile description.

USDCAD - Short from bearish order block ✅Hello traders!
‼️ This is my perspective on USDCAD.
Technical analysis: Here we are in a bearish market structure from daily perspective, so I am looking for short. I want price to continue the retracement to fill the imbalance higher and then to reject from 4H bearish order block + institutional big figure 1.36000.
Like, comment and subscribe to be in touch with my content!

USDCAD I Wait for pullback Welcome back! Let me know your thoughts in the comments!
** USDCAD Analysis - Listen to video!
We recommend that you keep this pair on your watchlist and enter when the entry criteria of your strategy is met.
Please support this idea with a LIKE and COMMENT if you find it useful and Click "Follow" on our profile if you'd like these trade ideas delivered straight to your email in the future.
Thanks for your continued support!

USD/CAD PREDICTION ON 17.08.2023At the moment, the Canadian Dollar (CAD) is exhibiting a bearish trend. Several factors could be influencing this downturn, be it economic data from Canada, global oil prices, or international trade dynamics. It's vital for investors and traders to keep abreast of relevant news and economic indicators from Canada. Always combine insights with personal research and consider seeking advice from financial professionals before making investment decisions.

USDCAD shortLower low here and then a following lower high, offers up great R.
Higher time frame failure to go higher as well. Could be a bit too early to be shorting. But seems like a good opportunity especially with DXY looking heavy.

USDCAD - SHORTThe price has reached a point of a possible continuation of the downward channel. The price tried to break the channel but immediately got rejected by a bearish candle and the RSI shows a downward momentum. We look for a confirmation for reversal, BUT we have to keep in mind the strong resistance level at 1.36400. We will have a SL just above the structure in order to be ready for the possibility to reach the 1.36400 level and create divergence.

USDCAD SHORTCaught this entry about 5 pips late due to waiting for confirmation on 30 min candle,
I’m expecting it to drop until news on 14th comes out this is not a long term hold AUG 13th max before closing positions i seen that right as 30m candle and 2 hours candle tapped liquidity block it immediately reject expecting a harsh drop after retracement keep stop tight on this one everything lines up
5min bearish candle
30min bearish candle
2hr bearish candle
Take at own risk

USDCAD SELL STOPUSDCAD SELL STOP
Entry point :- 1.33842
Stop lose :- 1.35041
Target 1 :- 1.3264
Target 2 :- 1.3144

USDCAD for the sellHere we have USDCAD.. anticpated the sell off
earlier this week but the bulls took over
but now I think it is time
The yellow trendline represents the DAILY TF
break in structure. I anticipate a small retracement and
then the drop as we have a nice area that can become supply

Daily Watchlist 9th August 2023Two pairs on watch this morning, USDCAD & CADJPY. Similar plays but crucial differences in WHERE price has come from. Stay sharp.

USDCAD H4USDCAD H4 Short
Usdcad have major resistance zone at 1.33925 and price rejected third time at this erea. usdcad have bearish divergence also put pending ordder at breakout of i.33196 with proper stop loss.

USDCAD - Potential Sell USDCAD has reached an area of interest after taking out previous highs and mitigating the fair value gap. This is an opportunity of a risk entry, or one can wait for a CHoCh in a smaller timeframe.
We will see how this plays out.

USDCAD short ideaI see candles rejecting 1.3350 on the daily and we have one leg painted already on the 4 hour. I want to see another leg drop into the imbalance on the 15-minute at 1.3320.

USDCAD Sell SetupUSDCAD Momentum is Strong Bullish, But Still Expected a Deep Pullback Before a Further Buying. Large Liquidity Pool resting Above Market. Lets Wait for Liquidity Grab and Structure Shift to Enter.

USD CAD SHORTRisk 0.5%
TP1 = 1:2 RR
Disclaimer:
The contents in this Idea are intended for information purpose only and do not constitute investment recommendation or advice. Nor are they used to promote any specific products or services. They serve as an integral part of a case study to demonstrate fundamental concepts in risk management under given market scenarios. A full version of the disclaimer is available in our profile description.


USDCAD Sell ExpectedH2 TF FVG is Internal Structure Liquidity to be taken Out by Market. Asian and London Session are Strongly Bullish. Expecting a Fall on Today 7:00PM (PST) News Time.
Entry After M5 CHoCH.

My thoughts on USDCAD, EU, GU and AUWhat do you think about these setups. Let me know,
but in summary,
UC= sell
EU= Buy
AU= Buy
GU= Buy
I am quite bearish on the Dollar, not unless the fundamentals change. But as I keep saying, we'll have to wait and see.
