USDCAD upcoming sellsAfter rejecting a key area and a strong move down with volume, I’m expecting USDCAD to retrace slowly before the big dump to the downside.
Usdcadshort

USDCAD M30: Bearish outlook seen, further downside below 1.3600On the M30 timeframe, prices are ranging between a key resistance zone at 1.3600 and a key support zone at 1.3550. A pullback to the resistance zone at 1.3600, in line with the 23.6% Fibonacci retracement, could present an opportunity to ride the drop to the support zone at 1.3550, which coincides with the 50% Fibonacci extension and graphical low. Stochastic RSI is in the overbought region above 80, while price is holding below the 50 EMA and Ichimoku cloud, supporting our bearish bias.

USDCAD - Bullish Channel at Support- Descending channel at daily support
- 0.5 fib retracement at entry point
- Equal measured move at entry point

USDCAD SHORTExpecting a push to the downside.. 1.34311 target ... there's a lot of factors behind this trade.. watching closely!!

USDCAD SHORTUSDCAD broke a triangle and retested it
I expect it to reach the target specified on the chart, with expectations of strength for the Canadian dollar and weakness for the US dollar

USDCAD H1Here is my view for USDCAD on H1. The price could go berasih, you can put a pending order on the Order block or find an entry on LTF within OB Zone. Trade Safe!

USD/CAD Making Lower High And Lower Low , Short Setup Valid ?This Is An Educational + Analytic Content That Will Teach Why And How To Enter A Trade
Make Sure You Watch The Price Action Closely In Each Analysis As This Is A Very Important Part Of Our Method
Disclaimer : This Analysis Can Change At Anytime Without Notice And It Is Only For The Purpose Of Assisting Traders To Make Independent Investments Decisions.

USDCAD top-down analysisHello traders, this is a complete multiple timeframe analysis of this pair. We see could find significant trading opportunities as per analysis upon price action confirmation we may take this trade. Smash the like button if you find value in this analysis and drop a comment if you have any questions or let me know which pair to cover in my next analysis.

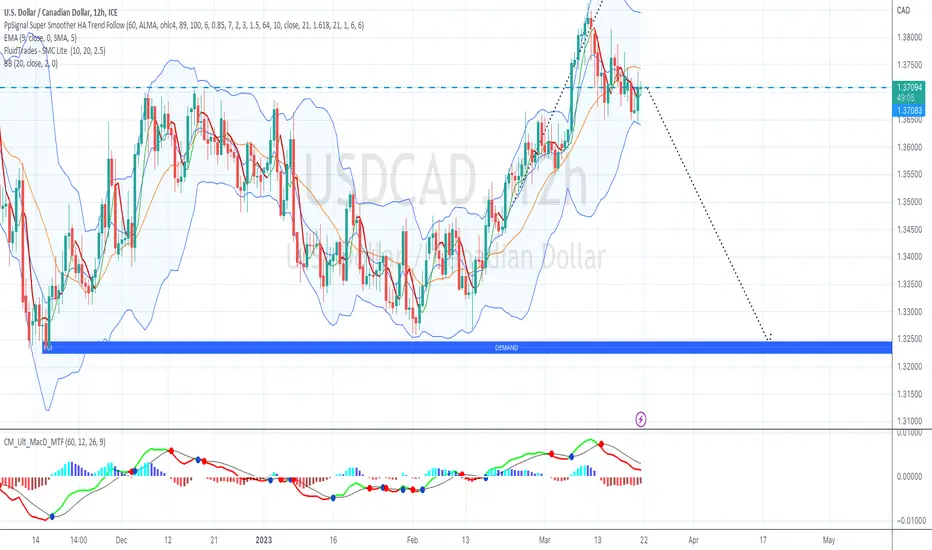
20 Reason For sell USDCAD 🔆MULTI-TIME FRAME TOP-DOWN ANALYSIS OVERVIEW☀️
1:✨Eagle eye:
2:📆Monthly:
3:📅Weekly:
4:🕛Daily:
😇7 Dimension analysis
🟢 analysis time frame D1:
5: 1 Price Structure: bearish
6: 2 Pattern Candle Chart: long wick. descending triangle
7: 3 Volume: Bearish is more than bullish
8: 4 Momentum UNCONVENTIONAL Rsi: Range shift from bullish bearish and bearish divergence also here within three candles
9: 5 Volatility measure Bollinger bands: M pattern and start squeeze
10: 6 Strength ADX: bullish yet
11: 7 Sentiment ROC: USD is weaker CAD
✔️ Entry Time Frame: H4
12: Entry TF Structure: bearish
13: entry move: impulsive
14: Support resistance base REsistence upper high:
15: FIB: trigger event is occurred
☑️ final comments: there is a head-fake at BB; overall view is strongly bearish
16: 💡decision: sell
17: 🚀Entry: 1.3763
18: ✋Stop losel: 1.3819
19: 🎯Take profit: 1.3086
20: 😊Risk to reward Ratio: 1:3
🕛 Excepted Duration: 2 days

Intraday SELL usdcad (24 MAR 2023)USDCAD intraday trading alert
3 simple steps to find a quality setup!
Risk Reward Ratio 1:2
Anyone same idea with me?
SELL USDCAD
Good luck traders...

USDCAD in trading range.USDCAD -
Previous support located at 1.3650.
Previous resistance located at 1.3750.
The trend of higher intraday lows has also been broken.
Further downside is expected.
Risk/Reward would be poor to call a sell from current levels.
A move through 1.3650 will confirm the bearish momentum.
24h expiry- We look to Sell at 1.3740 (stop at 1.3780)
Our profit targets will be 1.3640 and 1.3620
Resistance: 1.3750 / 1.3800 / 1.3850
Support: 1.3650 / 1.3600 / 1.3500
Risk Disclaimer
The trade ideas beyond this page are for informational purposes only and do not constitute investment advice or a solicitation to trade. This information is provided by Signal Centre, a third-party unaffiliated with OANDA, and is intended for general circulation only. OANDA does not guarantee the accuracy of this information and assumes no responsibilities for the information provided by the third party. The information does not take into account the specific investment objectives, financial situation, or particular needs of any particular person. You should take into account your specific investment objectives, financial situation, and particular needs before making a commitment to trade, including seeking advice from an independent financial adviser regarding the suitability of the investment, under a separate engagement, as you deem fit.
You accept that you assume all risks in independently viewing the contents and selecting a chosen strategy.
Where the research is distributed in Singapore to a person who is not an Accredited Investor, Expert Investor or an Institutional Investor, Oanda Asia Pacific Pte Ltd (“OAP“) accepts legal responsibility for the contents of the report to such persons only to the extent required by law. Singapore customers should contact OAP at 6579 8289 for matters arising from, or in connection with, the information/research distributed.

USDCAD - Long active ✅Hello traders!
‼️ This is my perspective on USDCAD.
Technical analysis: As we can see here we are in a bullish market structure from daily perspective, so I am looking for longs. I expect bullish price action from here as price fiiled perfectly the imbalance and rejected from bullish order block.
Like, comment and subscribe to be in touch with my content!

Bearish Daily Projection on USDCADMy bias is bearish on USDCAD Daily TF, due to the fact that price was rejected at the resistance and price is presently on a downward move that may probably see us retest the support.
However, I am bullish on weekly TF as analyzed here .
Market conditions can change at anytime
What's your thought on this?
like and comment below

USDCAD - Potential Downward MovementUSDCAD went below previous support now turned resistance with previous candle getting rejected. Exit at 1st demand zone.
USDCAD- SELL 500+ PIPS THAT WE ARE AIMING!Dear traders, USDCAD from our first setup we have achieved 800+ pips, that was a buying setup and now we are looking at selling opportunity. We had mixed NFP and CPI data outcome though we still have fed meeting announcement where we expect price to be bullish for short term until it reaches our target zone. Overall we are bearish on the trade.

USDCAD Will Fall !!USD-CAD broke the rising
Support line and is now
Retesting the broken level
So I am locally bearish
And I think that the price
Will go down

UsdCad ShortI am looking to short UsdCad once it breaks the support below and closes below it. My setup will be invalid if it fails to break it and breaks the above resistance. I will then start looking for buying opportunities

USDCAD H1: Bearish outlook seen, further downside below 1.3750Prices are testing a key support zone at 1.3750 on the H1 timeframe, which coincides with the 38.2% Fibonacci retracement. A break below the zone could provide the bearish acceleration to the next support zone at 1.3680, in line with the 78.6% Fibonacci retracement and 161.8% Fibonacci extension. Failure to break below the support zone could see price bounce to the resistance zone at 1.3780. Prices are holding below the 20 EMA, while MACD is showing bearish momentum, supporting our bearish bias.

USDCAD Buy The USD/CAD pair has corrected to near the critical support of 1.3750 in the Tokyo session. The Loonie asset is facing the heat as the upside momentum in the US Dollar Index has started fading now. The street is anticipating maintenance of status-quo by the Federal Reserve (Fed) next week as United States inflation has resumed its softening spell meaningfully.
Scrutiny of February’s US Consumer Price Index, Employment report, Retail Sales, and Producer Price Index (PPI) figures indicate that January’s economic data was a one-time blip. The US inflation has resumed its downside journey and the joining of fears associated with the global banking crisis is stemming an unchanged policy stance on interest rates.
USDCAD h1 price is in an uptrend. However, it is possible that the pair will form another short correction today before continuing to move up. Recommended to wait to buy to 1.3720, SL: 1.3680, TP: 1.3820

USDCADNow we are in a downward dynamic channel where the price has shown weakness near the middle line of the channel.
I predict that probably this weakness has the ability to reduce the price until near the bottom of the channel.
Oscillators also confirm this weakness, and this means reducing the market's tendency to increase the price.

USDCAD: 2 Sell ZonesAs per my previous analysis, I have started scaling sells into this pair.
If my initial position fails, I will look to sell slightly higher as illustrated.
I will keep you all updated as things progress.

USDCAD Buy WASHINGTON: U.S. Treasury Secretary Janet Yellen on Sunday said she was working closely with banking regulators to respond to the collapse of Silicon Valley Bank and protect depositors, but a major bailout was not being considered.
Yellen told the CBS News “Face the Nation” show that she had been working with regulators to “design appropriate policies to address the situation,” but declined to give further details.
USDCAD h1 price is sideways in the 1.3760-1.3860 zone. Currently, the price is approaching the support area of 1.3760 and shows signs of turning up again. Recommended buy to current price 1.3765, SL: 1.3730, TP: 1.3830

USDCAD Short SetupHello Everyone
I m looking for Short setup in USDCAD pair
If it successfully broken this support area We will enter in short trade.
This will be a good short trade.
Keep an eye on these levels.
Cheers
