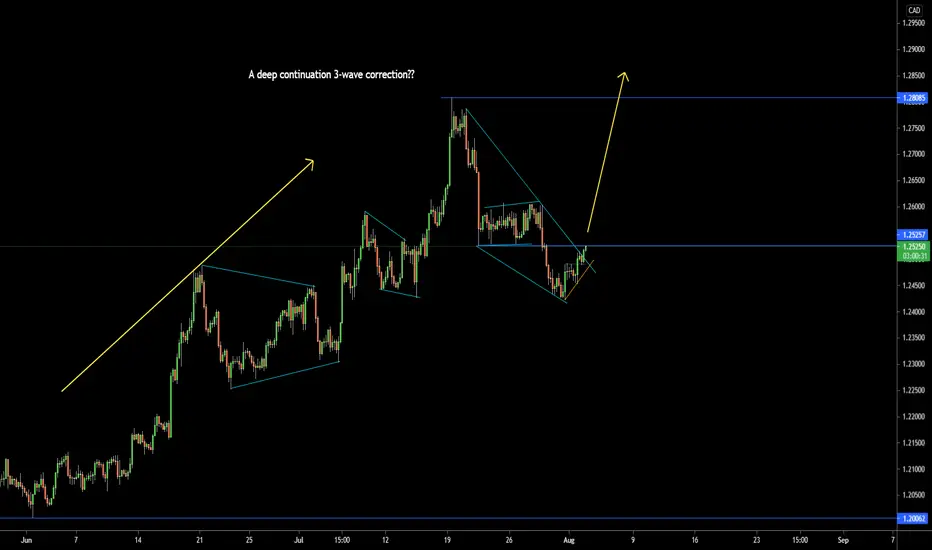
USDCAD: SIGNAL & Movement ScenariosI have buy entry on support line.
Expect price grow up more than 200 pips and now seems consolidation price tilll next week.
If you have any idea leave comment below here.
Glad to hear that.
Usdcadsignal


USDCAD top-down analysisHello traders, this is the full breakdown of this pair. We will take this trade if all the conditions are satisfied as discussed in the analysis. Smash the like button if you find value in this analysis and drop a comment if you have any questions or let me know which pair to cover in my next analysis.

USDCAD | The best area to start the uptrend🏹Hello traders, Symbol USDCAD ,This analysis has been prepared in a weekly time frame but has been published for a better view in a 2 week time frame.
Our goal in this analysis is to give you an overview of the future of symbolism.
As you can see in the chart, this symbol has been analyzed and examined from 1979 until today and is predicted until 2027.
Based on the wave count we did in the weekly timeframe, we first identified a 5-wave cycle and then a relatively short correction in terms of price and time.
After completing this correction, a new 5-wave trend in the form of a triangle has started again.
In this leading wave, waves 1, 2 and 3 are complete and now we are waiting for the completion of wave 4, we expect wave 4 to form at the bottom of the channel (Fibo 0.50) but we can also expect a deeper correction (Fibo 0.618).
After the end of wave 4, we are waiting for the beginning of wave 5, and the best confirmation for the beginning of wave 5 is the price crossing the midline of the channel or the pink trend line of the channel floor.
If the price crosses Fibonacci 0.618, this analysis will not lose its validity and we should expect a further rise.
🙏If you have an idea that helps me provide a better analysis, I will be happy to write in the comments🙏
❤️Please, support this idea with a like and comment!❤️

Monday: USDCAD - Week 32Hello Traders! Check Related Idea for market context!!
I will update my idea as the trade progresses if any changes occur and my analysis is wrong, or need to be adapted to the new development of price-action.
Thanks for the support!
-----------------------------------------------------------------------------------------------------------------------
-----------------------------------------------------------------------------------------------------------------------
SMASH that follow button! 👍
💡 Leave a comment and/or message me on how I can improve and provide better content, I'm open to suggestions to create a better experience for you!
RISK DISCLAIMER: Please be advised that I am not telling anyone how to spend or invest their money. Take all of my videos as my own opinion, as entertainment, and at your own risk. I assume no responsibility or liability for any errors or omissions in the content of this channel. This content is for educational purposes only and is not tax, legal, financial, or professional advice. Any action you take on the information in this video is strictly at your own risk. We, therefore, recommend that you contact a personal financial advisor before carrying out specific transactions and investments. There is a very high degree of risk involved in trading. Past results are not indicative of future returns. Inotfancy.com and all individuals affiliated with this channel assume no responsibility for your trading and investment results.

USDCAD 15MIN TIMEFRAME ANALYSIS (BUY) We consider to buy this pair because of a strong support below. We know what we are doing and we do what the market is doing. This is more than an institutional analysis. Invest wisely. Thank you for following me on tradingview.

Tuesday: USDCAD - Week 31Hello Traders! Check Related Idea for market context!!
I will update my idea as the trade progresses if any changes occur and my analysis is wrong, or need to be adapted to the new development of price-action.
Thanks for the support!
-----------------------------------------------------------------------------------------------------------------------
-----------------------------------------------------------------------------------------------------------------------
SMASH that follow button! 👍
💡 Leave a comment and/or message me on how I can improve and provide better content, I'm open to suggestions to create a better experience for you!
RISK DISCLAIMER: Please be advised that I am not telling anyone how to spend or invest their money. Take all of my videos as my own opinion, as entertainment, and at your own risk. I assume no responsibility or liability for any errors or omissions in the content of this channel. This content is for educational purposes only and is not tax, legal, financial, or professional advice. Any action you take on the information in this video is strictly at your own risk. We, therefore, recommend that you contact a personal financial advisor before carrying out specific transactions and investments. There is a very high degree of risk involved in trading. Past results are not indicative of future returns. Inotfancy.com and all individuals affiliated with this channel assume no responsibility for your trading and investment results.
USDCAD - DOWNFALLPreviously at 128.101 price reversed into a sell. Now at 128.101, price is doing the same thing. I also see lower lows forming within that area which helped me identify which way price is going. The previous support level has also broken to confirm the direction of the trend.

USDAD (29/07/2021)USDCAD 4H
OPEN POSITION =1.23600
TAKE PROFIT 1=1.28750
TAKE PROFIT 2=1.2939
TAKE PROFIT 3=1.30935
S/L =1.22485
BEST REGARDS

USDCAD Has Formed a Flag
Welcome back Traders, Investors, and Community!
Hi Traders, USDCAD on H1 has formed a Flag pattern. After the Flag is expected to go lower
⬇️Sell now or Sell at 1.2614
⭕️SL @ 1.2661
✅TP1 @ 1.2495
✅TP2 @ 1.2378
✅TP3 @ 1.2258
We will have more FREE forecasts in TradingView soon
❤️ Your Support is really appreciated!❤️
Have a Profitable Day

USDCAD top-down analysisHello traders, this is the full breakdown of this pair. We will take this trade if all the conditions are satisfied as discussed in the analysis. Smash the like button if you find value in this analysis and drop a comment if you have any questions or let me know which pair to cover in my next analysis.

USDCAD | Perspective for the new weekWe scooped over 500pips from our last publication as price moved aggressively in our direction ( see link below for reference purposes).
Earlier in the week, we witnessed high volatility as price hit a high at CA$1.28000 ish only to fall drastically during the week to close below a major Support/Resistance level @ CA$1.26300 with signs expressing doubt of buying the Greenback over the Canadian Dollar. With all eyes focused on FOMC in the coming week; a Channel Breakdown expectation, a V-shaped recovery in oil prices (check USOil chart) coupled with a better than expected Canadian retail sales report is a positive sign for me to sell the Greenback for the Loonie in the coming week(s).
Tendency: Downtrend (Bearish)
Structure: Supply & Demand | Channel | Reversal set-up
Observation: i. It is evident from our Daily chart that the USD has been on a rally since June 2021 and it appears to have found a peak at CA$1.28000.
ii. The beginning of July 2021 expressed a steady growth in the Dollar as price action is contained between upward sloping parallel lines.
iii. The appearance of an Ascending Channel is confirmed after drawing a lower trend line that connecting the swing lows, and an upper channel line that joining the swing highs.
iv. The Breakout of the channel on the 19th of July 2021 appears to be a false one after considering the pattern of the Bearish move that followed the Breakout which also closed below the major Support/Resistance level @ CA$1.26300 on the daily chart - a sign that Buyers could not hold the momentum above this level for long.
v. I look forward to a breakdown of my new Key level @ CA$1.25500 and channel to the downside in the coming as the likelihood for a rise in USOil becomes evident.
vi. In this regard, I have identified a niche around CA$1.26300/1.25400 for selling opportunity with a high probability of a Channel Breakdown.
vii. See the chart for levels that might welcome opportunities to add to our existing position.
viii. For fellow cautious traders, below Key level remains a safe haven to sell... Trade consciously!😊
Trading plan: SELL confirmation with a minimum potential profit of 200 pips.
Risk/Reward : 1:5
Potential Duration: 5 to 10days
NB: This speculation might be considered to make individual decisions on the lower timeframe.
Watch this space for updates as price action is been monitored.
Risk Disclaimer:
Margin trading in the foreign exchange market (including commodity trading, CFDs, stocks etc.) has a high risk and is not suitable for all investors. The content of this speculation (including all data) is organized and published by me for the sole purpose of education and assistance in making independent investment decisions. All information herein is for your reference only and I take no responsibility.
You are hereby advised to carefully consider your investment experience, financial situation, investment objective, risk tolerance level, and consult your independent financial adviser as to the suitability of your situation prior to making any investment.
I do not guarantee its accuracy and is not liable for any loss or damage which may result directly or indirectly from such content or the receipt of any instruction or notification therewith.
Past performance is not necessarily indicative of future results.


USDCAD, BULLISH!!We can see on four hour timeframe that the market is contineously pushing to the upside making higher highs. The most recent support/demand area is 1.26 area where the market will most likely make a new Higher Low unless it breaks the uptrend structure. My bias is bullish at this pair until it breaks it's previous higher low which is located at 1.245 area. My take profit will be below the recent higher high and break above that market will push higher. Before entering watch out for price action that will indicate you to buy this pair.

USD/CAD BULLISH NOW.......
💹USD/CAD ⏬BUY STOP @ 1.23232
✅TP-1# 1.23463
✅TP-2# 1.23801
⛔️SL 1.22844
N.B- USD/CAD CREATE BEARISH BUTTERFLY PATTERN.
SO,IF BREAK 1.22700 SUPPORT ZONE.THEN THIS ENTRY INVELID.
📊 Trade Accuracy 75% 📊
📊 Follow Proper M.M & Use S.L 📊
AronnoFX will not accept any liability for loss or damage as a result of
reliance on the information contained within this channel including
data, quotes, charts and buy/sell signals.
Dear Traders, if you like this idea or have your own opinion about it,
write in the comments. I will be glad to you.

USD/CAD Day Swingtrade sell signalNEW WEEK !!!
USD/CAD Signal
Market Sell: 1,26970
Stop-Loss: 1,27600
Target 1: 1,26300
Target 2: 1,24930
Stop-Loss: 63 pips
Risk: 0,5%
Risk-Reward: 3,24

USDCAD Continues in the Bullish Channel
Welcome back Traders, Investors, and Community!
Hi Traders, USDCAD on H4 in the Bullish channel, has been making HHs and HLs, it might go back all the way down to 1.2497 and then goes higher.
⬆️Buy now or Buy at 1.2497
⭕️SL @ 1.2404
✅TP1 @ 1.266
✅TP2 @ 1.279
✅TP3 @ 1.2905
We will have more FREE forecasts in TradingView soon
❤️ Your Support is really appreciated!❤️
Have a Profitable Day

USDCAD: SIGNAL TRADING (Sell If breakout)sell if clean breakout the neckline.
RR: 1:3
good luck traders

Wednesday: USDCAD 2 - Week 28Hello Traders! Check Related Idea for market context!!
I will update my idea as the trade progresses if any changes occur and my analysis is wrong, or need to be adapted to the new development of price-action.
Thanks for the support!
-----------------------------------------------------------------------------------------------------------------------
-----------------------------------------------------------------------------------------------------------------------
SMASH that follow button! 👍
💡 Leave a comment and/or message me on how I can improve and provide better content, I'm open to suggestions to create a better experience for you!
RISK DISCLAIMER: Please be advised that I am not telling anyone how to spend or invest their money. Take all of my videos as my own opinion, as entertainment, and at your own risk. I assume no responsibility or liability for any errors or omissions in the content of this channel. This content is for educational purposes only and is not tax, legal, financial, or professional advice. Any action you take on the information in this video is strictly at your own risk. We, therefore, recommend that you contact a personal financial advisor before carrying out specific transactions and investments. There is a very high degree of risk involved in trading. Past results are not indicative of future returns. Inotfancy.com and all individuals affiliated with this channel assume no responsibility for your trading and investment results.


USDCAD H1 TIMEFRAME ANALYSIS (SELL)We sell this pair because there is a strong resistance above and the New Jerusalem Indicator has already turned red meaning that there is a bearish pressure. The entry and exit levels have been shown on the chart. We know what we are doing and we do what the market is doing. Experience Zero Poverty. Wish you success.

USDCAD: Signal Trading Looking for Buy OpportunityWe are looking for buy opportunity on price of interest.
your wait will be paid soon.

