USDCAD Near supportThis pair is strugling near its support line now it may get little rejection and then break the support.
Usdcadsignal

Short USDCADConfluences:
+ Pivot Point
+ Fibonacci Retracement 0.6
+ MACD Divergence
+ Flip Zone
- Take Profit:
+ next Support / Resistance
+ Or Price Action ( My Favorite way )

USDCAD | Perspective for the new weekWith over 380pips in our direction since my last publication on this pair (see link below for reference purposes); It appears we still have a few more pips to mop as the appearance of a Bearish Rectangle pattern dictates the prevailing direction of price... The risk of further decline gains momentum! The USD/CAD pair gained some positive traction during the mid-European session on Friday and climbed to around the CAD1.27910 which was followed by sharp rejection of this level. As I anticipate making CAD1.27910 my new Sell window in the coming week, the major Supply zone @ CAD1.28400 is still a zone with selling significance.
Tendency: Downtrend ( Bearish )
Structure: Bearish Rectangle | Breakdown | Supply & Demand
Observation: i. The risk of further decline in the week(s) ahead is still strong as price-action is caught within a Bearish rectangle pattern.
ii. Presently, price action is hovering around 61.8% retracement of AB leg with indications that it might evolve into a Harmonic (AB = CD) pattern in the coming week(s).
iii. ABCD pattern parameters explained below;
a. Leg A-to-B is expected to be in harmony with the potential C-to-D leg.
b. The B- to-C leg is currently hovering at 61.8% (with a possible 78.6% in the future) Fibonacci retracement of the A-to-B leg.
c. The C-to-D leg is expected to fall within 127.2 - 1.414% Fib. ext. of the A-to-B move.
iv. Breakdown and retest of Demand zone @ CAD1.27000 shall inspire a second position.
Trading plan: SELL confirmation with a minimum potential profit of 150 pips.
Risk/Reward : 1:3
Potential Duration: 1 to 5 days
NB: This speculation can be considered to make decisions on lower timeframes.
Watch this space for updates as price action is been monitored.
Risk Disclaimer:
Margin trading in the foreign exchange market (including foreign exchange trading, CFDs, etc.) has a high risk and is not suitable for all investors. The content of this speculation (including all data) is organized and published by me for the sole purpose of education and assistance in making independent investment decisions. All information herein is for your reference only and I take no responsibility.
You are hereby advised to carefully consider your investment experience, financial situation, investment objective, risk tolerance level, and consult your independent financial adviser as to the suitability of your situation prior to making any investment.
I do not guarantee its accuracy and is not liable for any loss or damage which may result directly or indirectly from such content or the receipt of any instruction or notification therewith.
Past performance is not necessarily indicative of future results.


USDCAD Strong Bullish DivergenceUSDCAD Will Bullish Because
1. Strong Bullish Divergence in D1 frame
2. Price Over sold with Fivo support 1.618 & there there is Bullish Butterfly pattern

USDCAD BUYING FROM SUPPORT ON DIPAS we can see this pair has reached at strong support so buying on dips
with a small risk and looking for higher rewards
friends push likes if u like my idea
i love and appropriate ur likes
follow us for more updates

USDCAD - Probability of the formation of Expanding DiagonalUSDCAD - Probability of the formation of Expanding Diagonal Pattern
Wave 3 has ended in the range of 1.4689 and the movement structure up to the range of 1.4667 has been in the form of 3 waves, which indicates the corrective movement. Given that the X wave has ended in the range of 1.4667, it is possible that we will encounter the FLAT pattern in the 4th wave.
In the downtrend, which started from the range of 1.4667 and should be in the form of 5 waves, according to the FLAT pattern, the movement structure is in the form of 3 waves, which can represent the Expanded Diagonal pattern. Which can prolong up to the range of 1.2039.


USDCAD-UpdateUSDCAD
We still believe in the Expanded Flat pattern. This analysis is violated if the price exceeds the range of 1.2928.

USDCAD: BUYBefore I start with the analysis, I want to thank everyone who liked my previous posts! :) I appreciate you guys.
I am calling a BUY signal for USDCAD as it is sitting on a strong support that was tested multiple times, I suggest taking a small position until a reversal is evident.
A break from the 100MA and a breakout from the previous high will more or less confirm that a reversal is coming,
What I want to see is a little bit of consolidation on the support area, then see if the US NFP is optimistic, then we'll definitely have a good day! :D
News to watch out for:
US Vaccine (Better Effectivity and early release date: BUY)
NFP (If better than estimate: BUY)
US Election (Transition)
CHEERS!
Happy Trading Guys :)

USD/CAD - Short Sell Set UpWe look at the fundamentals behind a strong Canadian Dollar driven by higher Oil prices.
I show you the relationship between Oil and the Canadian dollar as Oil is Canada's key export, making up 20% of all it's exports.
We look at some Technical Analysis entry strategies, using one-month ATR Volatility for stop-loss area's!!


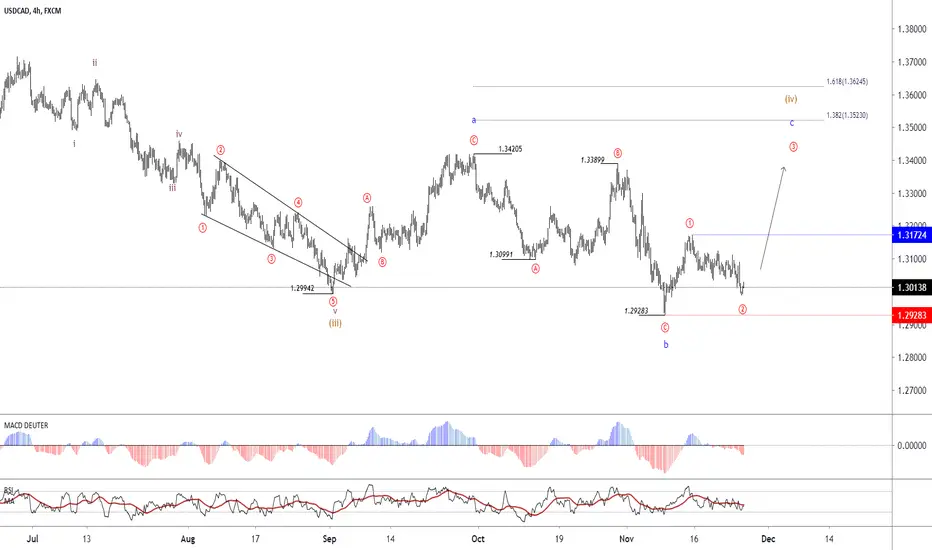
USDCAD - Probable Expanded Flat Pattern formation in Wave IVThe structure of the downtrend which has been started from the range of 1.3420, has finished in the range of 1.2928 which is in the form of 3 waves. Given this trend, we will probably have a 5-wave uptrend in C-wave, which could be extended up to the target of 1.3523.
If the price crosses the range of 1.2928, this analysis will be violated. In case the price crosses the range of 1.3172, we can expect an uptrend forming hopefully.

USD/CAD Day Swingtrade sell signalHi traders community!
Welcome to my new free signal!
USD/CAD Day Swingtrade
Market-Sell: 1,3060
Stop-Loss: 1,31000
Target 1: 1,30300
Target 2: 1,29800
Stop-Loss: 40 pips
Risk: 0,5-1%
Risk-Reward: 2,0
Pivot (invalidation): 1.3100
Our preference
Short positions below 1,3100 with targets at 1,3030 & 1,2980 in extension.
Alternative scenario
Above 1.3100 look for further upside with 1.3125 & 1.3145 as targets.
Comment
As Long as the resistance at 1.3100 is not surpassed, the risk of the break below 1.3050 remains high.

USDCAD, BUY SIGNAL I was able to count a simple ABC corrective structure that just concluded.
This signifies a high probability of buy on USDCAD.
Invalidation and the confirmation level is as shown on the chart

USDCAD correction with further growthUSDCAD correction with further growth
✅ If you like my analytics bet 👍
Subscribe to keep abreast of my predictions.
I would also be glad to see your comments under the idea, what do you think about this?

USD CAD NOV 15-20 KEY LEVELSA Look at USD CAD Key Levels for the week ahead Nov 15-20
Follow us for more trade ideas and predictions. Visit us online at www.fxwealthacademy.com for our advanced trading course.

USDCAD | PERSPECTIVE FOR THE NEW WEEKAfter taking a 200pips gain in our last publication on this pair (see link below for reference purposes), it appears we are at a juncture for a second wave of shorting the USDCAD as price breaks down my key level @ CAD1.30700. Despite making the previous four trading days in the positive territory, the USD/CAD pair rose to its highest level during the last week at CAD1.31740 on Friday only to experience a sharp rejection of this level with a Shooting star candle. Even though I have this intuition that the price of oil will surge soon, It is worthy to note that the performance of oil in the coming week shall be a significant point of reference to make a decision on this pair.
Tendency: Downtrend ( Bearish )
Structure: Breakdown | Supply & Demand | Trendline
Observation: i. As price continues to respect the major Trendline since May 2020; a Breakdown of Key level @ 1.30700 on the 5th of Nov. 2020 is a clue that the Trend might continue considering the Selling pressure at this juncture in the market.
ii. 1.31300 area which has been a Demand zone in the past appears to have been taken over by Sellers as this level no longer hold a haven for buyers.
iii. Our New Supply zone @ 1.32000 & 1.31500 which is also forming a Double Top pattern confirms the strength and presence of Sellers.
iv. We experienced significant growth in the Greenback last week but I am considering this minor uptrend to be a correction phase that might hit around 61.8% retracement in anticipation of a decline.
Trading plan: SELL confirmation with a minimum potential profit of 450 pips.
Risk/Reward: 1:3.5
Potential Duration: 5 to 10 days
NB: This speculation can be considered to make decisions on lower timeframes.
Watch this space for updates as price action is been monitored.
Risk Disclaimer:
Margin trading in the foreign exchange market (including foreign exchange trading, CFDs, etc.) has a high risk and is not suitable for all investors. The content of this speculation (including all data) is organized and published by me for the sole purpose of education and assistance in making independent investment decisions. All information herein is for your reference only and I take no responsibility.
You are hereby advised to carefully consider your investment experience, financial situation, investment objective, risk tolerance level, and consult your independent financial adviser as to the suitability of your situation prior to making any investment.
I do not guarantee its accuracy and is not liable for any loss or damage which may result directly or indirectly from such content or the receipt of any instruction or notification therewith.
Past performance is not necessarily indicative of future results.

USDCAD SELL SETUPin 15 min we got strong up trend with a S&H and 3 engulfing candle wich and indicator to trend change
wait for retest
