Usdcadsignal


USDCAD OBEYS SELL OPPORTUNITYDon't miss tomorrow's opportunity. Whatsapp me for great signals, +254748235744

START OF THE WEEK (26 Aug - 30 Aug 2019) GUIDE | USDCADSee chart for illustration
This is a follow up from earlier publication on subject pair (see link below)

USDCAD LONG TERM SPECULATION | SHORT!It appears price is gaining momentum in anticipation of a rally to the downside from 1.33500 zone since it has found it difficult to break this area in the last 2 weeks.
Considering the present volatility in the USD currency, patience is pertinent as the price could break the 1.33500 zone up into the 1.5500 zone before the rally down.
However, price action monitoring is decisive here.
Lower time frame speculation coming up soon

#USDCAD, Channel rises in H1In the H1 graph, a rising channel is created.
Because of our proximity to the channel's support line, we recommend buying.
Risk Level: 3/5
In case the usdcad breaks down and drops below 1.3240 the signal will no longer be the same.
Target: 1.3340

USDCAD(DAILY) | DOWNTREND POSSIBILITIES FEASIBLE!This is a follow up on earlier publications (see link below)
Update on this pair coming up as we watch the present characteristics of price action around the 1.32200 zone

#USDCAD, Analysis+SignalBear trend.
You can see in the graph above that the average line moves 200 very reliable which means that the usdcad above the line is worth buying and when the usdcad below is worth selling.
This is already the second time that usdcad is trying to rise above the trend line with no success.
Target: 1.3175

USDCAD SHORT SETUP 300m PIPS
3 on mt4
Rejecting off Trend Line
Rejecting off ressitance line
Forming Head and Shoulder
Evening Star
Divergence 1hr, 4hr
Quarters Theory Minor Zone *
Long term uptrend
Forming HH, HL about to form next low *
Waiting to break Pivot

USDCAD: Bullish Trend ContinuationAs described in the chart, USDCAD has bounced from the 4H EMA and expected to continue the bullish trend.

USDCAD 4H Potential Bearish MovementHi everyone this is what I saw at the moment. Stop Loss around 30-40 pips from Entry in the yellow zone. TAYOR!

#USDCAD, Is on its way to return to its uptrend channelStochastic crosses and at the ideal level to open a buying position.
This week began with a candle above last week's candle, a sign of purchase.
The usdcad has crossed the 200 moving average.
target: 1.33
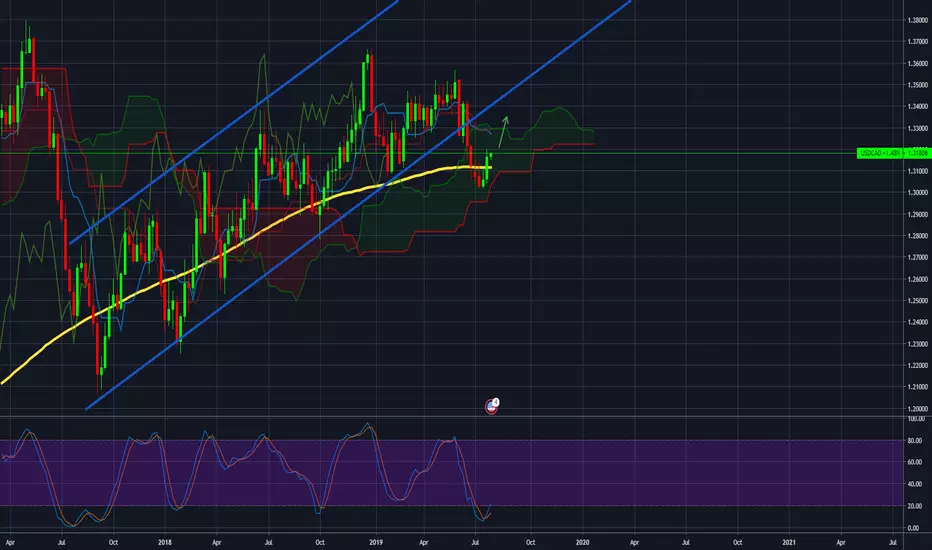
The bulls coming back? #USDCADSo it's true that the usdcad has gone out of the rising channel but you can not ignore the current situation.
In the weekly chart, the USDCAD is still on the rise.
You can see that currently the usdcad is supported by the support of the Ichimoku cloud, so long as we stay above the cloud it is a positive sign.
And in the end, we left the most important point- crossing of the Stochastic in the zone which indicates an oversold with the potential reversal of the trend.
Target: 1.32-1.3280

USD/CAD Long Term-Trade IDEA (Daily)Very nice little set up here.
I try to keep my charts very clean and simple, We broke a major up-trend.
Since we found support (for now) I would like to see if we reject this area, if so I can see a retest of the broken trend-line as resistance.
Let me know what you think below.

The last increase is a change in trend or just correction#USDCADOnly in the weekly graph are we still on the upward trend, in all other chart times (H4, D1, MN), the model has changed to a bearish model.
The USDCAD was stopped at 1.3090 because of the support we have there.
The Stochastic is currently at Oversold.
Short term: The USDCAD can rise to 1.3170 / 80
Long term: 1.2950
USDCAD - FX Majors | Patterns & Waves | June-July 2019
USDCAD labeled within a Bearish Impulse of a larger degree, with the expectations for a big impulse on the down-side to commence, but after a retracement.

USDCAD Sell Opportunity with +1800pip Short Target (Longterm)See the screenshot from monthly timeframe below. We are trading against a prominent inverted Head & Shoulders pattern which has clearly broken the neckline and completed a successful retest. Therefore, I have taken a small position of 0.25% capital risk and if price action permits, I will look to add this position at a later stage.
Monthly Outlook:
Caution - Inverted Head & Shoulders:

Will USDCAD continue the Down Trend??De afgelopen week is de koers verder gedaald en nieuw dieptepunt laten zien. Er zit waarschijnlijk nog wat meer kruit in het vat om de prijs verder naar beneden te drijven. Zie afbeelding voor de toelichting op mijn analyse.


USDCAD break Sideway Keep watch retest...USDCAD break Sideway Keep watch retest...
Target 1.3566 & 1.3620

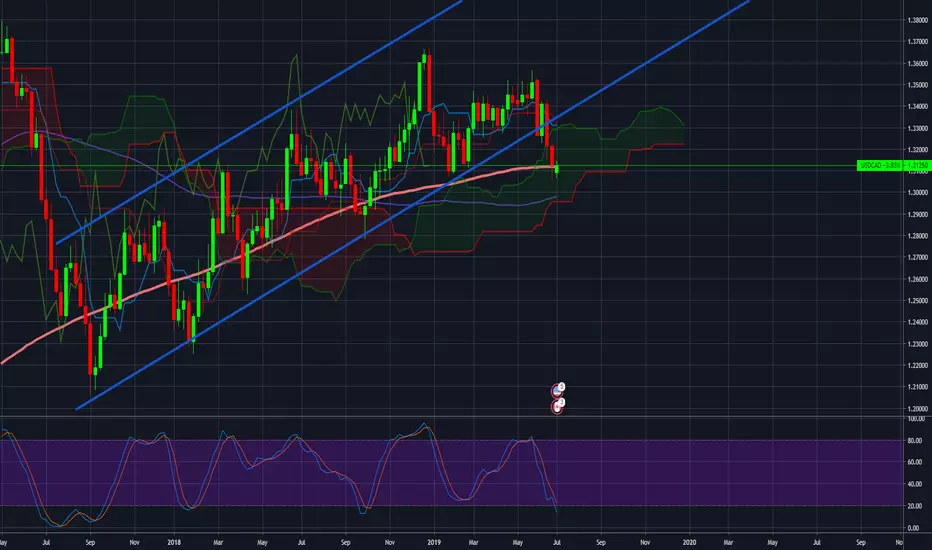
The strongest trend there is #USDCADWe are in a rising channel that has been going on for several years. The most correct area to enter with a buying position is close to support and this is the situation at the moment, according to the Stochastic, we are reaching the end of the declines
Take profit: 1.3850
Stop loss:1.32


USDCAD: Buy at DIPS near SUPPORTWill be looking at the PRICE ACTION near support. There are two SUPPORTS, one at 1.3380 and the other at 1.3338.
I will be looking for BUYs if price reaches these SUPPORT LEVELS and target 1.3520 as TP.
