USDCAD - ISM MANUFACTURING TODAY - The most important indicator data for the US dollar is due to be released today. ISM MANUFACTURING DATA is one of the most important DATA. So we need to look at the US dollar today. Also, the Canadian dollar is not showing any significant news today.
- DXY is currently at 103.72 LEVEL. USD has become STRONG in the last few days. Also, the CAD FEATURE is slightly down to 0.7767 LEVEL. However, compared to DXY, CAD is now WEAK due to OIL being DOWN.
- OVERALL MARKET is currently NEUTRAL. Last Friday also a NEUTRAL TONE was played in the NEWYORK SESSION on the MARKET. US STOCKS are currently showing a GREEN SIDE BIAS. And VOLATILITY is becoming UP. Also COMMODITIES still shows a DOWN SIDE BIAS. There is a NEUTRAL BIAS currently on the market. It's a bit more than the DOWN SIDE BIAS. Because it is VIX UP and EQUITIES NEUTRAL. We can not say for sure whether the MARKET SENTIMENT is UP or DOWN. But according to the data available so far we can say that MARKETS RISK is OFF.
- OIL PRICE is currently down a bit. It will inevitably affect CAD.
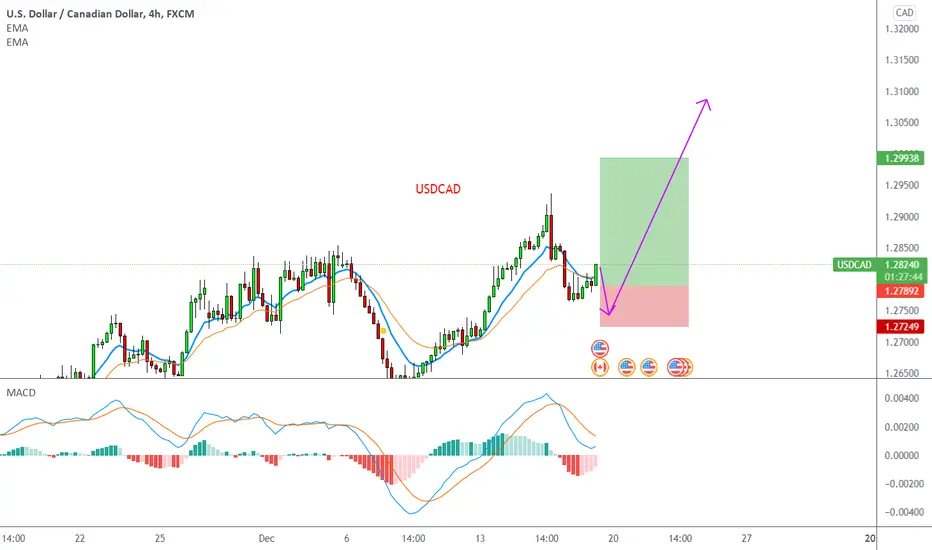
- USDCAD PRICE can be DOWN to 1.2772 LEVEL before UP. Then the USDCAD PRICE can be UP again up to 1.2963 LEVEL. The USD is slightly stronger at this time due to the MARKET SENTIMENT. The OIL PRICE applies to USDCAD, and the decisions made at OPEC MEETING will have the greatest impact on USDCAD. DXY is BUY because of the STRONG SENTIMENT that the US dollar has received so far, but it could be DXY CORRECTION in the future because it has been BUY for the last few days.
Usdcadsignals

USDCAD - FUNDAMENTAS WITH TECHNICAL LEVELS- There is a very important EVENT for CAD today. BOC GOV. MACKLEM is going to do a SPEAK. It will make USDCAD VOLATILE. GDP, CORE PCE DATA for USD is due out this week. GDP DATA will also be released for CAD.
- DXY is currently at 101.553 LEVEL. USD has become STRONG in the last few days. Also, the CAD FEATURE is slightly down to 0.7852 LEVEL. However, compared to DXY, CAD is now WEAK due to OIL being DOWN.
- Currently the SENTIMENT of the OVERALL MARKET is NEGATIVE. Last week a RISK OFF TONE was PLAY. STOCKS Slightly shows a DOWN SIDE BIAS right now. And VOLATILITY is becoming UP. Also COMMODITIES still shows a DOWN SIDE BIAS. Currently there is only one DOWN SIDE BIAS in the market. So be careful when trading. We can not say for sure that the MARKET SENTIMENT will continue to be a DOWN SIDE CONTINUE. But according to the data available so far we can say that MARKETS RISK is OFF.
- OIL PRICE is currently down a bit. It will inevitably affect CAD. But TECHNICALLY USDCAD can go to SELL a bit faster in the next few days because a SUPPORT has a PRICE and RISK ON.
- USDCAD PRICE can be DOWN to 1.2685 LEVEL before UP. Then the USDCAD PRICE can be UP again up to 1.2909 LEVEL. The USD may be slightly STRONG in the coming days due to the MARKET SENTIMENT. The OIL PRICE applies to USDCAD, and the decisions made at OPEC MEETING will have the greatest impact on USDCAD.

USDCAD Breakout Long !!
USD-CAD broke a key horizontal level
And the breakout is confirmed
Which makes me bullish biased on the pair
And I think that after the pullback and retest horizontal support areas AT 1.26300
We will see bullish continuation
to retest the horizontal resistance at 1.28585

USDCAD |New perspectiveCOnsidering the significant bearish impulse leg identified on the daily time frame, it is evident that the bullish momentum that has been happening since the beginning of the month might turn out to be a retracement of the impulse leg hereby sending out a signal that price action might be heading to the downside in the nearest future.
Risk Disclaimer:
Margin trading in the foreign exchange market (including commodity trading, CFDs, stocks etc.) has a high risk and is not suitable for all investors. The content of this speculation (including all data) is organized and published by me for the sole purpose of education and assistance in making independent investment decisions. All information herein is for your reference only and I take no responsibility.
You are hereby advised to carefully consider your investment experience, financial situation, investment objective, risk tolerance level, and consult your independent financial adviser as to the suitability of your situation prior to making any investment.
I do not guarantee its accuracy and is not liable for any loss or damage which may result directly or indirectly from such content or the receipt of any instruction or notification therewith.
Past performance is not necessarily indicative of future results.

USDCAD - FUNDAMENTAS WITH TECHNICAL LEVELS- The EXISTING HOME SALES DATA for USD is due out today. CPI DATA for CAD will also be released. It's a very HIGH IMPACT NEWS. So USDCAD VOLATILE can be for this reason.
- DXY currently stands at 100.738 LEVEL. USD has become STRONG in the last few days. Yesterday BUILDING PERMITS DATA caused USD STRONG. Also, the CAD FEATURE is slightly up to 0.7943 LEVEL. However, CAD is becoming STRONG relative to DXY due to OIL UP. But today's CAD CPI DATA will definitely move the USDCAD PRICE to DYNAMIC S / R LEVELS.
- Currently the SENTIMENT of the OVERALL MARKET is being POSITIVE. Yesterday a RISK ON TONE was PLAY. STOCKS Somewhat showing a NEUTRAL BIAS at the moment. And VOLATILITY is DOWN. Also COMMODITIES still shows a DOWN SIDE BIAS. There is a NEUTRAL BIAS currently on the market. It's a bit more than the UP SIDE BIAS. We can not say for sure whether the MARKET SENTIMENT is UP or DOWN. But according to the data we have received so far we can say that MARKETS RISK is turning ON.
- OIL PRICE is currently down a bit. It will inevitably affect CAD. But TECHNICALLY USDCAD can go to the SELL a bit faster in the next few days because a SUPPORT has a PRICE and RISK ON.
- USDCAD PRICE can be DOWN to 1.2526 LEVEL before UP. Then the USDCAD PRICE can be UP again up to 1.2685 LEVEL. The USD may be slightly WEAK in the coming days due to the MARKET SENTIMENT. The OIL PRICE applies to USDCAD, and the decisions made at OPEC MEETING will have the greatest impact on USDCAD.

usdcadUSDCAD has been fighting its 50- and 200-day simple moving averages (SMAs) within the 1.2625 – 1.2650 zone the entire week without success, increasing speculation that buyers are losing their impetus.

USDCAD Clear Channel Down until its invalidatedTime to update my USDCAD outlook made a month ago:
As you see the Channel Down eventually prevailed and the divergence was created as the condition I set (breaking the dashed Lower Highs trend-line) was not fulfilled. The price is now testing the 1D MA50 (blue trend-line). A break above still has to overcome the top (Lower Highs) trend-line of the Channel Down. The RSI is also under Lower Highs pressure.
A rejection there or on the 1D MA50, will extend the Channel Down pattern and the natural target will be the 1.22875 October 21 Low, currently the Support.
A break above the Channel Down will be enough to restore the bullish trend on the long-term horizon, targeting the 1.33880 Resistance (October 29 2020 High).
--------------------------------------------------------------------------------------------------------
Please like, subscribe and share your ideas and charts with the community!
--------------------------------------------------------------------------------------------------------

USDCAD possible sell area!!USDCAD has created a double top on 4H on weekly resistance and highly likely that this instrument will drop early next week with high probability.
Please press the like button if you find value in it.

USDCAD - FUNDAMENTAS WITH TECHNICAL LEVELS⛔️ USD does not have such important indicator data to release today. But the most important LABOR DATA for CAD is due out today. It will be released during the NEWYORK SESSION. Most likely it will be POSITIVE. We are waiting.
⛔️ DXY is currently at 98.83 LEVEL. USD has been WEAK for the last few days. But after the FOMC, the USD got a slight POSITIVE SENTIMENT. Also, the CAD FEATURE is down to 0.7946 LEVEL. However, CAD is becoming WEAK relative to DXY due to being OIL DOWN. The USDCAD PRICE looks like it's moving towards DYNAMIC S / R LEVELS.
⛔️ Currently the SENTIMENT of the OVERALL MARKET is being POSITIVE. Also, even though the EQUITIES are turning a bit red, we are not affected by the VOLATILITY DOWN. Also COMMODITIES still shows a UP SIDE BIAS. There is a NEUTRAL BIAS currently on the market. We can not say for sure whether the MARKET SENTIMENT is UP or DOWN. But according to the data we have received so far we can say that MARKETS RISK is turning ON.
⛔️ OIL PRICE is currently down a bit. It will inevitably affect CAD. But the TECHNICALLY USDCAD can go to the SELL a bit faster in the next few days because a RESISTANCE has a PRICE and is RISK ON.
⛔️ USDCAD PRICE can be UP to LEVEL 1.2656 before DOWN. Then the USDCAD PRICE can be down again up to 1.2415 LEVEL. The USD could be a bit WEAK in the coming days due to the MARKET SENTIMENT. The OIL PRICE applies to USDCAD, and the decisions made at OPEC MEETING will have the greatest impact on USDCAD.

USDCAD - OIL , U.S ECONOMIC DATA WITH TECHNICAL LEVELS- Some of the most important data for USD will be released this week. Among them,
JOLTS job openings, CB consumer confidence, ADP - non farm employment change, FINAL GDP q / q, crude oil inventories, Core pce price index, ism manufacturing index, NFP are the most important DATA.
- The OPEC MEETING is scheduled for this week. Also important indicator data for CAD, GDP, MANUFACTURING PMI, is due to be released this Friday.
- DXY is currently at 97.85 LEVEL. USD has been WEAK for the last few days. Also, the CAD FEATURE has been down to 0.7986 LEVEL. However, CAD is becoming WEAK compared to DXY due to OIL WEAKNESS. USDCAD PRICE is TUCHING IN DYNAMIC S / R LEVELS.
- Currently we see the OVERALL MARKET RISK OFF. Also STOKES are getting RED. VIX UP is becoming. Also COMMODITIES are starting to DOWN right now.
- OIL PRICE is currently down a bit. It will inevitably affect CAD. If so, USDCAD could be moving to the BUY in the next few days.
- USDCAD PRICE can go to 1.2466 LEVEL before UP. Then the USDCAD PRICE can be UP again up to 1.2656 LEVEL. The USD may be slightly STRONG in the coming days due to the MARKET SENTIMENT. The OIL PRICE applies to USDCAD, and the decisions made at OPEC MEETING will have the greatest impact on USDCAD.

USDCAD top-down analysisHello traders, this is the full breakdown of this pair. We will take this trade if all the conditions are satisfied as discussed in the analysis. Smash the like button if you find value in this analysis and drop a comment if you have any questions or let me know which pair to cover in my next analysis.

USDCAD | Live position reviewQuick one!
I have come to notice the indecision phase that is currently emanating from a demand zone around 1.26 area which has a strong memory for buying power. And this phase appears to be evolving into what looks like a reversal structure as the price continues to reject 1.25750 (3 times).
Risk Disclaimer:
Margin trading in the foreign exchange market (including commodity trading, CFDs, stocks etc.) has a high risk and is not suitable for all investors. The content of this speculation (including all data) is organized and published by me for the sole purpose of education and assistance in making independent investment decisions. All information herein is for your reference only and I take no responsibility.
You are hereby advised to carefully consider your investment experience, financial situation, investment objective, risk tolerance level, and consult your independent financial adviser as to the suitability of your situation prior to making any investment.
I do not guarantee its accuracy and is not liable for any loss or damage which may result directly or indirectly from such content or the receipt of any instruction or notification therewith.
Past performance is not necessarily indicative of future results.

USDCAD Channel Up but divergence may be created.The USDCAD pair has been trading within a Channel Up since the June 01 2021 Low (which was also the market bottom). However, since the December 20 2021 High, it hasn't delivered a Higher High. In fact the December 20 High made a Double Top with the August 20 High, creating the current Resistance.
This has created a new bearish sequence within the Channel Up and even though the price is supported on the 1D MA200 (orange trend-line), the longer it fails to break above the 1.29000 Lower High, the more likely it is to test the 1.22875 October 21 Low (which was a Higher Low on the Channel Up and current Support).
On the other hand, a break above the 1.2900 Lower High, restores the long-term bullish sentiment and will target the 1.33880 (October 29 2020) High.
--------------------------------------------------------------------------------------------------------
Please like, subscribe and share your ideas and charts with the community!
--------------------------------------------------------------------------------------------------------


USD/CAD SHORT SELL NOW.......
Hello Traders, here is the full analysis for this pair,
let me know in the comment section below if you have any questions,
the entry will be taken only if all rules of the strategies will be
satisfied. I suggest you keep this pair on your watch list and see if
the rules of your strategy are satisfied.
Dear Traders,
If you like this idea, do not forget to support with a like and follow.
PLZ! LIKE COMMAND AND SUBSCRIBE.

USDCAD UP Trend.!#USDCAD Looking for Buy trade setup as I mentioned in the Chart.!
Keep Supporting LIKE, COMMENT And FOLLOW.!
Thank You.!

USD/CAD BUY NOW.......
Hello Traders, here is the full analysis for this pair,
let me know in the comment section below if you have any questions,
the entry will be taken only if all rules of the strategies will be
satisfied. I suggest you keep this pair on your watch list and see if
the rules of your strategy are satisfied.
Dear Traders,
If you like this idea, do not forget to support with a like and follow.
PLZ! LIKE COMMAND AND SUBSCRIBE

USDCAD Down Trend.!#USDCAD Looking for Sell trade setup as I mentioned in the Chart.!
Keep Supporting LIKE, COMMENT And FOLLOW.!
ThankYou.!

There's a possibility of USDCAD going lower this weekUSDCAD has bounced up from the diagonal support of the rising channel on Friday. Within the channel I see a head and shoulders pattern on lower timeframe.
There's a possibility that USDCAD will fall the coming week. I am interested in seeing price testing the broken neckline of the head and shoulders and see if there will be some sort of rejections around the area for a possible short position.
If it does fall, I will target 1.23211.
Please support my ideas with likes if you find this helpful. Thanks

USCAD Entries + Exits With My Trading Strategy!The NEW 1ON1 video is currently out, if you would like it in order to understand how to play my analysis FULLY, please let me know privately.
All likes/comments and feedback are very much appreciated!
How to play my chart:
Buy at support, sell at resistance. When you open this chart you'll see a green entry and a red entry. When the candlestick hits the green entry, you place a buy. If however that support buy doesn't go into profit and goes negative -35 or -60 pips (depending if it was a fast break/or if the break landed on a minute 15 zone), if it breaks you would then exit your buy and immediately enter the sell. You would then ride that sell down to green TP1, or you could then repeat and play the buy/break there.
The same exact thing goes for resistance sell/break plays!

USDCADMOnthly bullish retrace to fib level 0.5 weekly bullish . daily bullish wait till it touch 0.618 and take the trade on smaller time fram when things bullish after small retest. :)
USDCAD continuation area soon Not really much happening on USDCAD, we are now just seeing price make a retracement like I expected, then ill be watching for hopefully the next short wave down.

USD/CAD Outlook (29 November 2021)Overall, USD/CAD is trending upwards.
Bank of Canada (BoC) Governor Macklem will be speaking tomorrow at 0300 (GMT+8).
Also, BoC committee member Schembri will be speaking tomorrow at 0605 (GMT+8).
During these times, there may be volatility in CAD.
USD/CAD’s next support zone is at 1.26100 and the next resistance zone is at 1.29000.
Look for short-term buying opportunities of USD/CAD.
