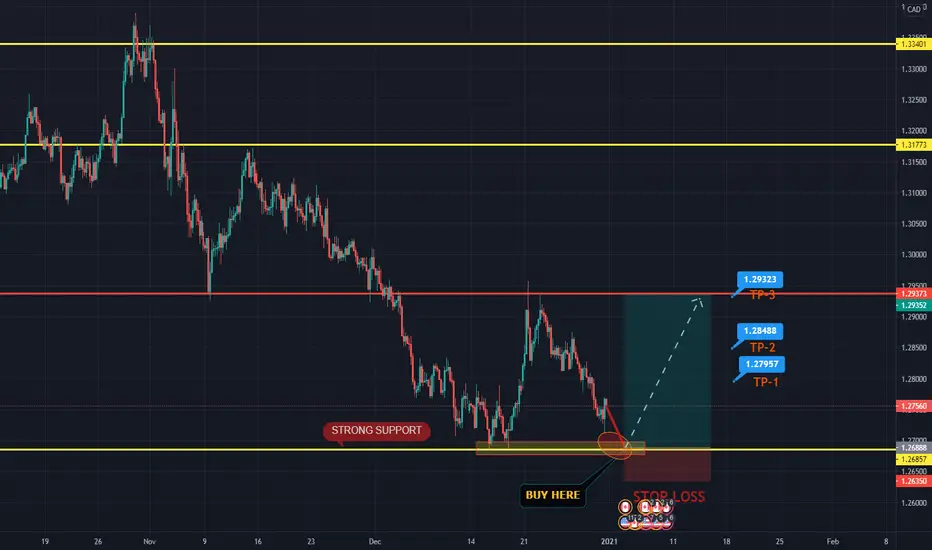
USDCAD Buy/Sell + Exit TradesThe ENTRY/TP zones are your entries as well as your exits.
Everything above the current candlestick is resistance, you would treat every zone above as a sell/potential buy break.
Everything below the current candlestick is support, which you would then treat every zone below as a buy/potential sell break if it hits the pip rule.
More info on the strategy and how to play it:
How To Play The Chart Entries/Exits:
Buy at green support entry, if it breaks by -35 pips (count it out) then enter a sell and ride to TP1, 2 and 3. Trail stop at each TP which means place your stop loss in profit but with enough room to be able to continue the sell if it continues. Same thing at resistance, sell but if broken by 35 pips then enter the buy and ride to TP1. Each TP is a support or resistance zone , so you could then even take a sell after TP1 for the buys have been hit and if it breaks out then just repeat.
All likes/comments and feedback are very much appreciated! Thank you to all of those who support me on a weekly basis, it really does mean a ton to me!
Usdcadsignals

USDCAD 2022 will be a very bullish year for the pairAs the title suggests, I expect USDCAD to be bullish for 2022. The reason is the fractal (on this 1W time-frame) from 2017 - 2018 that the pair appears to be replicating.
As you see this market follows strict Support and Resistance levels, easily recognizable on the long-term scale. The Multi-year Market Top of 1.4700 held during the COVID stock-market melt-down of March 2020 and as the 1.2000 level supported on a symmetrical scale, it appears that USDCAD is forming a symmetrical Channel Up to that of 2018. The natural technical target for 2022 is 1.36000.
--------------------------------------------------------------------------------------------------------
** Please support this idea with your likes and comments, it is the best way to keep it relevant and support me. **
--------------------------------------------------------------------------------------------------------

USDCAD Entries + Exits! REVERSE IS SECURED IF PLAYED CORRECTLYThe ENTRY/TP zones are your entries as well as your exits.
Everything above the current candlestick is resistance, you would treat every zone above as a sell/potential buy break.
Everything below the current candlestick is support, which you would then treat every zone below as a buy/potential sell break if it hits the pip rule.
More info on the strategy and how to play it:
How To Play The Chart Entries/Exits:
Buy at green support entry, if it breaks by -35 pips (count it out) then enter a sell and ride to TP1, 2 and 3. Trail stop at each TP which means place your stop loss in profit but with enough room to be able to continue the sell if it continues. Same thing at resistance, sell but if broken by 35 pips then enter the buy and ride to TP1. Each TP is a support or resistance zone , so you could then even take a sell after TP1 for the buys have been hit and if it breaks out then just repeat.
All likes/comments and feedback are very much appreciated! Thank you to all of those who support me on a weekly basis, it really does mean a ton to me!

USDCAD | Perspective for the new week | Follow-up detailsAs price moved in our direction since my last publication on this pair, we scooped over 350pips (see link below for reference purposes) before the reversal setup began. As at the moment, it appears that we are on the verge of a risk of further decline in the coming week(s) as the Dollar lost all it gained during the month of September 2021 and with the appearance of Head & Shoulder look alike, the possibility of a reversal increases.
The Greenback may continue to decline in the coming week as the U.S. yields dropped despite stronger than expected inflation and consumer spending.
Tendency: Downtrend (Bearish)
Structure: Supply & Demand | Trendline | Reversal pattern (Head and Shoulder)
Observation: i. The Loonie has been on a downward spiral since mid last year and the appearance of a reversal pattern at exactly 38.2% retracement of the Bearish Impulse leg cited on the weekly chart might be a signal confirming a risk of further decline in the coming week(s).
ii. The visual representation of a line drawn under pivot lows reveals the bullish momentum of price action since the month of June 2021 but a drop in momentum can be seen in the recent pivot point as the price did not launch as high as the previous before the second breakdown of Trendline.
iii. A baseline noted on the chart with three peaks, where the outside two are close in height and the middle is highest describes a specific formation that predicts a bullish-to-bearish trend reversal.
iv. Completion of the reversal pattern can be confirmed at Breakdown/Retest of Neckline in the coming week as below C$1.26300 remains a comfortable level to sell the Dollar.
v. It is worthy to note that C$1.263000 has a memory for selling opportunities in recent times (April 2021).
vi. A Breakdown of the Neckline and Key level is a confluence for selling opportunities in the coming week with an option to add to our existing position at Breakdown/Retest of C$1.25000 level.
NB: It is very possible that the projected decline in price might be a short term trend... Trade consciously!😊
Trading plan: SELL confirmation with a minimum potential profit of 300 pips.
Risk/Reward : 1:4
Potential Duration: 3 to 10days
NB: This speculation might be considered to make individual decisions on the lower timeframe.
Watch this space for updates as price action is been monitored.
Risk Disclaimer:
Margin trading in the foreign exchange market (including commodity trading, CFDs, stocks etc.) has a high risk and is not suitable for all investors. The content of this speculation (including all data) is organized and published by me for the sole purpose of education and assistance in making independent investment decisions. All information herein is for your reference only and I take no responsibility.
You are hereby advised to carefully consider your investment experience, financial situation, investment objective, risk tolerance level, and consult your independent financial adviser as to the suitability of your situation prior to making any investment.
I do not guarantee its accuracy and is not liable for any loss or damage which may result directly or indirectly from such content or the receipt of any instruction or notification therewith.
Past performance is not necessarily indicative of future results.

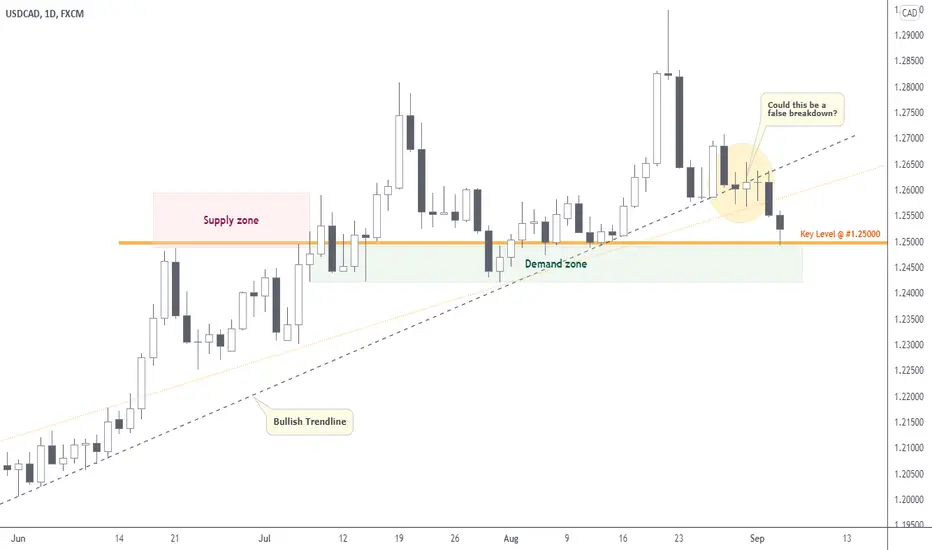
USDCAD | Perspective for the new weekMy last speculation saw the price move over 150pips in our direction before the bulls took over ( see link below for reference purposes). Since breaking above the $1.25000 level in July 2021, I am labelling this level to be a very strong demand zone for the Greenback considering that the obvious that it has held price "supported' in the last couple of months. Since the value of the Loonie is directly connected to the oil situation. It is important to take into consideration that oil inventories are currently down from what they used to be prior to the Covid-19 pandemic. Coupled with the Hurricane Ida situation, there is more supply than demand which could have a negative impact on the Loonie in the coming week(s).
Tendency: Uptrend (Bullish)
Structure: Supply & Demand | Trendline
Observation: i. Since hitting a peak @ $1.29500 on the 20th of August 2021, the price of USD have tumbled drastically and it is finally at our Demand zone.
ii. The visual representation of a line drawn under pivot lows reveals the prevailing direction of price since June 2021. However, a sudden Breakdown of this Trendline (whatever way you draw your line) during last week trading session cast some doubt on the Bullish tendency on this pair.
iii. At this juncture it is indeed appropriate that we remain patient and observe how price reacts to the Major Demand zone @ $1.25000/1.24200 area for confirmations.
iv. To support my Bullish expectation on this pair, I shall be looking for rejections or engulfing candles off of the Key level @ $1.25000 (above key level - safe haven) in the coming week(s).
v. Should price drop below Key level, then this will make the Breakdown of Bullish Trendline valid. Hence, a retest shall give me no choice but to switch bias in support of the Bears... Trade consciously!😊
Trading plan: BUY confirmation with a minimum potential profit of 250 pips.
Risk/Reward : 1:4
Potential Duration: 3 to 7days
NB: This speculation might be considered to make individual decisions on the lower timeframe.
Watch this space for updates as price action is been monitored.
Risk Disclaimer:
Margin trading in the foreign exchange market (including commodity trading, CFDs, stocks etc.) has a high risk and is not suitable for all investors. The content of this speculation (including all data) is organized and published by me for the sole purpose of education and assistance in making independent investment decisions. All information herein is for your reference only and I take no responsibility.
You are hereby advised to carefully consider your investment experience, financial situation, investment objective, risk tolerance level, and consult your independent financial adviser as to the suitability of your situation prior to making any investment.
I do not guarantee its accuracy and is not liable for any loss or damage which may result directly or indirectly from such content or the receipt of any instruction or notification therewith.
Past performance is not necessarily indicative of future results.
USDCAD | Perspective for the new weekWe scooped over 500pips from our last publication as price moved aggressively in our direction ( see link below for reference purposes).
Earlier in the week, we witnessed high volatility as price hit a high at CA$1.28000 ish only to fall drastically during the week to close below a major Support/Resistance level @ CA$1.26300 with signs expressing doubt of buying the Greenback over the Canadian Dollar. With all eyes focused on FOMC in the coming week; a Channel Breakdown expectation, a V-shaped recovery in oil prices (check USOil chart) coupled with a better than expected Canadian retail sales report is a positive sign for me to sell the Greenback for the Loonie in the coming week(s).
Tendency: Downtrend (Bearish)
Structure: Supply & Demand | Channel | Reversal set-up
Observation: i. It is evident from our Daily chart that the USD has been on a rally since June 2021 and it appears to have found a peak at CA$1.28000.
ii. The beginning of July 2021 expressed a steady growth in the Dollar as price action is contained between upward sloping parallel lines.
iii. The appearance of an Ascending Channel is confirmed after drawing a lower trend line that connecting the swing lows, and an upper channel line that joining the swing highs.
iv. The Breakout of the channel on the 19th of July 2021 appears to be a false one after considering the pattern of the Bearish move that followed the Breakout which also closed below the major Support/Resistance level @ CA$1.26300 on the daily chart - a sign that Buyers could not hold the momentum above this level for long.
v. I look forward to a breakdown of my new Key level @ CA$1.25500 and channel to the downside in the coming as the likelihood for a rise in USOil becomes evident.
vi. In this regard, I have identified a niche around CA$1.26300/1.25400 for selling opportunity with a high probability of a Channel Breakdown.
vii. See the chart for levels that might welcome opportunities to add to our existing position.
viii. For fellow cautious traders, below Key level remains a safe haven to sell... Trade consciously!😊
Trading plan: SELL confirmation with a minimum potential profit of 200 pips.
Risk/Reward : 1:5
Potential Duration: 5 to 10days
NB: This speculation might be considered to make individual decisions on the lower timeframe.
Watch this space for updates as price action is been monitored.
Risk Disclaimer:
Margin trading in the foreign exchange market (including commodity trading, CFDs, stocks etc.) has a high risk and is not suitable for all investors. The content of this speculation (including all data) is organized and published by me for the sole purpose of education and assistance in making independent investment decisions. All information herein is for your reference only and I take no responsibility.
You are hereby advised to carefully consider your investment experience, financial situation, investment objective, risk tolerance level, and consult your independent financial adviser as to the suitability of your situation prior to making any investment.
I do not guarantee its accuracy and is not liable for any loss or damage which may result directly or indirectly from such content or the receipt of any instruction or notification therewith.
Past performance is not necessarily indicative of future results.

USD/CAD short it usd cad is currently in bull run and market is reached at a strong supply zone
1.26200 as we can rejection on lower time frames
market will go down to touch the area of very strong demand zone 1.24500
market will consolidate for next before breaking either way
so you can enter short with your own money management
always remember that discipline with patience is the key factor to be a successful trader
market went upside exactly as we predicted
check out last analysis of usd cad

USDCAD closest to the 1D MA200 since July 2020!Pattern: Channel Down (fibonacci) on 1D.
Signal: Sell as the price is the closest to the 1D MA200 (orange trend-line) since July 21, 2020.
Target: 1.17500 (just above the 1.5 Fibonacci extension).
** Please support this idea with your likes and comments, it is the best way to keep it relevant and support me. **
--------------------------------------------------------------------------------------------------------
!! Donations via TradingView coins also help me a great deal at posting more free trading content and signals here !!
🎉 👍 Shout-out to TradingShot's 💰 top TradingView Coin donor 💰 this week ==> ridethepig
--------------------------------------------------------------------------------------------------------

USDCAD Sell SignalPattern: Channel Down on 1D.
Signal: Sell as the price is approaching the 1S MA100 (green trend-line) which hasn't seen a 1D candle closing above it since May 29, 2020.
Target: 1.1900 (above the 1.5 Fibonacci extension).
Most recent USDCAD signal:
** Please support this idea with your likes and comments, it is the best way to keep it relevant and support me. **
--------------------------------------------------------------------------------------------------------
!! Donations via TradingView coins also help me a great deal at posting more free trading content and signals here !!
🎉 👍 Shout-out to TradingShot's 💰 top TradingView Coin donor 💰 this week ==> mused_Aurorah
--------------------------------------------------------------------------------------------------------

USDCAD BUY ON DIPS !!Hello Friends as i can see this pair has reached @ strong weekly support zone
So we are buying this pair on dips with a very low risk an looking for higher rewards
Friends Push like an comments it help alot to reach iea to many other traders
Follow us for more updates

USDCAD BUYING FROM SUPPORT ZONEHI FRIENDS
as i can see this pair is still holing a Strong support Technically we can see alote of time it had retested this support zone and fail to Drop more
we also can see this pair right now in over Sold Conditions So we are buying this pair with a very small risk and looking for higher rewards
Friends Push likes and comment WE love ur support
Follow us for more updates

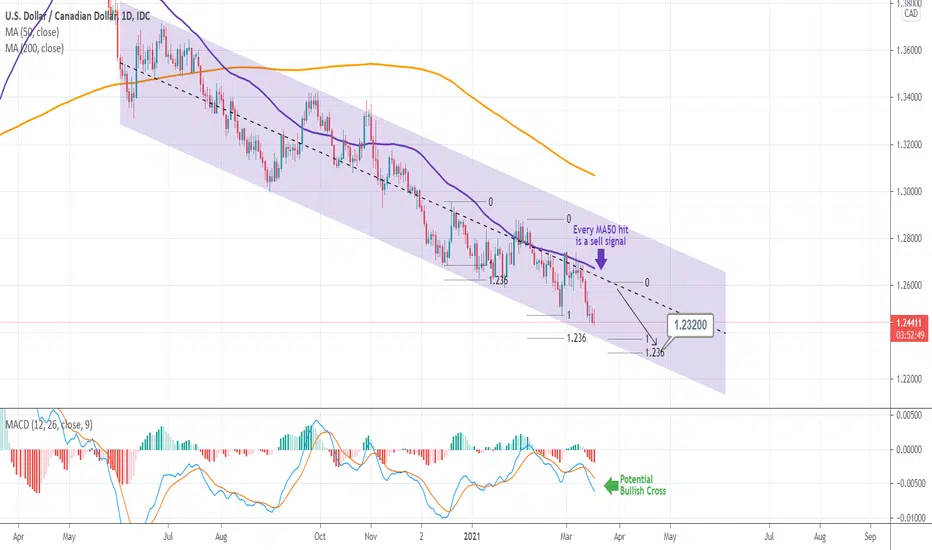
USDCAD Sell SignalPattern: Channel Down on 1D.
Signal: Sell as the price is declining after making contact with the 1D MA50 (blue trend-line) and the MACD formed a Bearish Cross.
Target: 1.2320 (the 1.236 Fib extension).
** Please support this idea with your likes and comments, it is the best way to keep it relevant and support me. **
--------------------------------------------------------------------------------------------------------
!! Donations via TradingView coins also help me a great deal at posting more free trading content and signals here !!
🎉 👍 Shout-out to TradingShot's 💰 top TradingView Coin donor 💰 this week ==> kylevd23
--------------------------------------------------------------------------------------------------------

USDCAD | Perspective for the new week | Follow-upCAD appears to have gained some ground after a strong employment report last week which brings me to re-visit my existing stance on this pair.
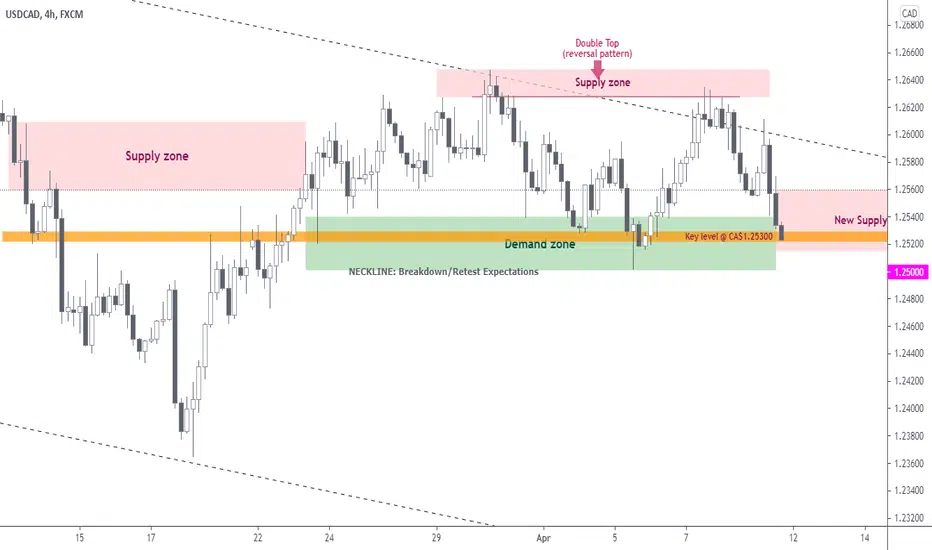
The price moved over 160pips in our direction since my last publication before meeting selling pressure @ CA$1.265000 followed by rejection at this same area during last week trading session to make a complete Reversal pattern (Double Top) at exactly the peak of the Channel Trendline (see link below for reference purposes). This feat completely emphasizes that price action is about respecting the Descending Channel (See chart below) one more time as I look forward to a breakdown/Retest of Neckline which is also my Key level @ CA$1.25300 for confirmation in the coming week(s)!
Tendency: Downtrend ( Bearish )
Structure: Breakdown | Supply & Demand | Reversal Pattern (Double Top)
Observation: i. Since the last quarter of last year, the price has been fluctuating between consistent highs and lows within a Channel in a downward trend.
ii. Double Top: The appearance of an extremely bearish technical reversal pattern that formed after price touched a high @ around CA$1.26500/1.26350 area two consecutive times with a moderate decline between the two highs calls for a Bearish bias in the coming week(s).
iii. As at the time of this analysis, price is hovering in a Demand area (CA$1.25300 - neckline) that might thrust price up hereby making us revert to my previous bias ( see link below).
iv. Opening a sell position on this pair can only be confirmed below Key level. Waiting for a significant Breakdown/retest of Neckline @ CA$1.25300 (Demand zone) is the only means of confirming that the Bears have come to stay at this juncture... trade consciously :)!
Trading plan: SELL confirmation with a minimum potential profit of 250 pips.
Risk/Reward : 1:5
Potential Duration: 5 to 10days
NB: This speculation might be considered to make individual decisions on the lower timeframe.
Watch this space for updates as price action is been monitored.
Risk Disclaimer:
Margin trading in the foreign exchange market (including foreign exchange trading, CFDs, etc.) has a high risk and is not suitable for all investors. The content of this speculation (including all data) is organized and published by me for the sole purpose of education and assistance in making independent investment decisions. All information herein is for your reference only and I take no responsibility.
You are hereby advised to carefully consider your investment experience, financial situation, investment objective, risk tolerance level, and consult your independent financial adviser as to the suitability of your situation prior to making any investment.
I do not guarantee its accuracy and is not liable for any loss or damage which may result directly or indirectly from such content or the receipt of any instruction or notification therewith.
Past performance is not necessarily indicative of future results.
USDCAD BUY ON DIPSHello Friends as i can this pair is reached @ a strong daily support and created a double bottom
Friends we are buying this pair on dips with a very small risk of 0 to 50 pips and looking for higher rewards
Chart is pretty easy to understand the reason behind buying this pair
We appreciate ur love and support Push like to help deliver this idea to many other peoples
Follow us for more updates

USDCAD | Perspective for the new week | Follow-upThe price moved against us since my last publication ( see link below for reference purposes) as CA$1.26000 level was unable to hold on the back of crude oil volatility. The Bearish run that has lasted exactly a year appears to be building a reversal pattern with my Key level @ CA$1.24900 representing a Neckline.
With the present simple structure, it appears that the Greenback will likely move higher over the next couple of weeks as the price is expected to remain supported in the long term around my Key level considering the fact that crude oil market volatility is calming down.
Tendency: Uptrend ( Bullish )
Structure: Breakout | Supply & Demand | Reversal pattern
Observation: i. Since the Breakdown of Key level @ CA$1.29400 on the 12th of March 2021, the price finally shows signs of Breaking and closing above this level during last week trading session.
ii. Even as the possibility of a correction move that might extend deep into CA$1.24500 might happen in the coming week, buying above Key level is most sensible in this setup. Why?
iii. We have been on a Downtrend for an extended period of time and it will only make sense that we are patient to confirm that the Buyers have finally taken over hence anywhere above Key level seems very reasonable.
iv. In case you find yourself buying above Key level before the deep, it is advisable to opt-out once the price deep below $1.24800 with the intention of planning a re-entry... Trade consciously!
Trading plan: BUY confirmation with a minimum potential profit of 250pips.
Risk/Reward : 1:4
Potential Duration: 4 to 10 days
NB: This speculation might be considered to make individual decisions on the lower timeframe.
Watch this space for updates as price action is been monitored.
Risk Disclaimer:
Margin trading in the foreign exchange market (including foreign exchange trading, CFDs, etc.) has a high risk and is not suitable for all investors. The content of this speculation (including all data) is organized and published by me for the sole purpose of education and assistance in making independent investment decisions. All information herein is for your reference only and I take no responsibility.
You are hereby advised to carefully consider your investment experience, financial situation, investment objective, risk tolerance level, and consult your independent financial adviser as to the suitability of your situation prior to making any investment.
I do not guarantee its accuracy and is not liable for any loss or damage which may result directly or indirectly from such content or the receipt of any instruction or notification therewith.
Past performance is not necessarily indicative of future results.

USDCAD Wait for the perfect sellPattern: Channel Down on 1D.
Signal: Sell on the next contact with the 1D MA50 (blue trend-line).
Target: 1.2320 (estimated 1.236 Fib extension).
** Please support this idea with your likes and comments, it is the best way to keep it relevant and support me. **
--------------------------------------------------------------------------------------------------------
!! Donations via TradingView coins also help me a great deal at posting more free trading content and signals here !!
🎉 👍 Shout-out to TradingShot's 💰 top TradingView Coin donor 💰 this week ==> xBTala
--------------------------------------------------------------------------------------------------------
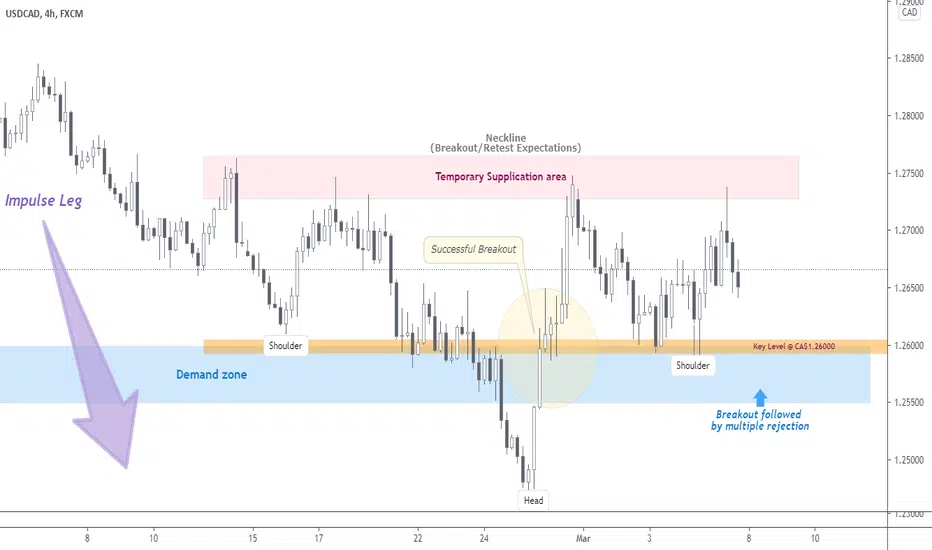
USDCAD | Perspective for the new week | Follow-upThe Bearish trend that began in October 2020 appears to have found a bottom @ around CA$1.24500 as the pattern transpose into what looks like an Inverse Head and Shoulder - a very strong reversal pattern.
My last publication on this pair still holds as I continue to look for Bullish expectations (see link below for reference purposes) following signs of positive expectations from the Greenback as the Non-Farm Payrolls report indicated that the U.S. economy added 379,000 jobs in February, a report that significantly exceeded analyst expectations.
Tendency: Uptrend ( Bullish )
Structure: Breakout | Supply & Demand | Reversal pattern (Inverse H & S)
Observation: i. Breakout of my Key level @ CA$1.26000 late February 2021 followed by multiple rejections of this level during last week trading session supports the expectation of a rally in the nearest future as the price remains supported at this level.
ii. After a significant Bearish Impulse leg, the appearance of an Inverse Head & Shoulder keeps my expectation LONG in the coming week(s).
iii. Bearish Leg that began Oct. 2020 falls to make a Shoulder and then rises to the Neckline(CA$1.27500); price then falls again and below the former Shoulder to make a Head and then rises again; finally, the price falls again but not as far as the second Shoulder with a good possibility of a Breakout/Retest expectation of Neckline @ CA$1.27500.
iv. Even as the CA$1.26000/1.25500 area remains a strong Demand area for me, a Breakout/Retest confirmation of Neckline might be a very good area you might want to join the rally.
Trading plan: BUY confirmation with a minimum potential profit of 350 pips.
Risk/Reward : 1:3.5
Potential Duration: 8 to 15days
NB: This speculation might be considered to make individual decisions on the lower timeframe.
Watch this space for updates as price action is been monitored.
Risk Disclaimer:
Margin trading in the foreign exchange market (including foreign exchange trading, CFDs, etc.) has a high risk and is not suitable for all investors. The content of this speculation (including all data) is organized and published by me for the sole purpose of education and assistance in making independent investment decisions. All information herein is for your reference only and I take no responsibility.
You are hereby advised to carefully consider your investment experience, financial situation, investment objective, risk tolerance level, and consult your independent financial adviser as to the suitability of your situation prior to making any investment.
I do not guarantee its accuracy and is not liable for any loss or damage which may result directly or indirectly from such content or the receipt of any instruction or notification therewith.
Past performance is not necessarily indicative of future results.

USDCAD BUY ON DIPShello friends as i can this pair is making a double bottom on a strong weekly horizontal support zone an rejected on Friday closing
its also in over sold condition now and its a great entry for longs with a low risk and looking for higher rewards incoming days
Friends Push like and comments we appreciate and love ur support
Follow us for more updates

USDCAD BUY This pair had successful achieve out TP2 in previous analysis now trading near @ minor support
so we are expecting this pair will retest the support zone and then we will buy on dips
Friends push like and comments Follow us for more updates

USDCAD | Perspective for the new weekWith 102pips in our direction before the reversal on my last publication (see link below for reference purposes); we are at a juncture in the market with a viable opportunity to take advantage of. The Impulse move that begun mid-November 2020 appears to have found a bottom as the rejection of demand level @ CA$1.26500 area continue to gain momentum. Even though the USD/CAD pair came under renewed bearish pressure in the early session on Friday, I continue to see an opportunity to go Long as this Bearish move from my perspective is a corrective move following the successful Breakout of Bearish Trendline.
Tendency: Uptrend ( Bullish )
Structure: Reversal pattern | Breakout | Supply & Demand | Double Top
Observation: i. A visible Reversal structure is observed as price no longer deems it fit to respect the Bearish Trendline.
ii. Breakout of Bearish Trendline during last week trading session is a signal that we might be changing direction in the nearest future.
iii. Double Top at CA$1.28820 represent the beginning of the corrective phase of the Impulsive Breakout on the 27th of Jan 2020.
iv. I shall be anticipating the exhaustion of the Bearish steam around the Bearish trendline and Demand zone followed by signs of a rally in the following week(s).
Trading plan: BUY confirmation with a minimum potential profit of 300 pips.
Risk/Reward : 1:3.5
Potential Duration: 5 to 10 days
NB: This speculation can be considered to make decisions on lower timeframes.
Watch this space for updates as price action is been monitored.
Risk Disclaimer:
Margin trading in the foreign exchange market (including foreign exchange trading, CFDs, etc.) has a high risk and is not suitable for all investors. The content of this speculation (including all data) is organized and published by me for the sole purpose of education and assistance in making independent investment decisions. All information herein is for your reference only and I take no responsibility.
You are hereby advised to carefully consider your investment experience, financial situation, investment objective, risk tolerance level, and consult your independent financial adviser as to the suitability of your situation prior to making any investment.
I do not guarantee its accuracy and is not liable for any loss or damage which may result directly or indirectly from such content or the receipt of any instruction or notification therewith.
Past performance is not necessarily indicative of future results.

USDCAD BUY FROM KEY ZONEThis pair had successful achieve out TP2 in previous analysis now trading near @ minor support
so we are expecting this pair will retest the support zone and then we will buy on dips
Friends push like and comments Follow us for more updates

USDCAD BUYING FROM SUPPORT ON DIPSAS I can see this pair is going to test again daily support
& now will not going to skip this entry level and going to buy USDCAD ON DIPS if price show us it hold above the buying area
Friends support us and help all of other via shearing ur ideas
Follow us for more updates and stay tuned