USDCAD 23/01 Pair : USDCAD ( U.S Dollar / Canadian Dollar )
Description :
Completed " 12345 " Impulsive Waves and " A - 1234 " Impulsive Waves. Falling Wedge as an Corrective Pattern in Short Time Frame with the Breakout of the Upper Trend Line and Retracement. Break of Structure and Retracement.
Usdcadtrade

USDCAD → Bottom of Trading Range! Looking for Long Entry.USDCAD is at the bottom of a trading range and near the Weekly 200EMA which acted as good support in the last bull trend opportunity from July to October. Now that we're here, should we long?
How do we trade this? 🤔
We almost have enough price action to justify a long entry. Longing now would be maximally risky because we don't have a good buy signal bar yet. You could enter now with the understanding that every time we've hit these levels since September 23, a long as been profitable. I prefer more confirmation and thus, more probability before entering a trade. I think we need at least a good strong buy signal closing in the 131.300 - 131.600 range. With this signal, we can enter a trade a 1:2 Risk/Reward Ratio to the top of the trend.
Wait for a couple more Daily candles to show such support before longing. Until then, lets be patient on the sidelines!
💡 Trade Ideas 💡
Long Entry: 132.665
🟥 Stop Loss: 130.000
✅ Take Profit: 138.000
⚖️ Risk/Reward Ratio: 1:2
🔑 Key Takeaways 🔑
1. Trading Range after Bullish Price Action, Bias to Long.
2. Near Trading Range Support and Weekly 200EMA, Look for Entry.
3. Look for Test of Support before Entering a Trade.
4. Target 1:2 Risk/Reward, Stop Loss below 200EMA, Take Profit at Top of Range.
5. RSI at 39.00 and below Moving Average. Needs to Fall More before Long.
💰 Trading Tip 💰
Trends typically have three legs in either direction. Signals of a reversal include strong buy or sell bars with large wicks, higher highs and lower lows get weaker, and responses to the reverse direction get stronger. Confirmation lies with double and triple bottoms with a strong candle closing on or near its low/high.
⚠️ Risk Warning! ⚠️
Past performance is not necessarily indicative of future results. You are solely responsible for your trades. Trade at your own risk!
Like 👍 and comment if you found this analysis useful!

USDCAD H4 / PERFECT HIT OF THE OB / SHORT TRADE ACTIVE ✅Hello Traders!
This is my idea related to USDCAD H4. I see a small accumulation at the moment, I expect a bearish move taking into consideration this accumulation in the area of the OB.
The target is before the FVG.
Follow, like, and comment to see my content:
www.tradingview.com

USDCAD Trade IdeaThe USDCAD has reached a pivotal juncture,reaching into a critical resistance level. While the larger trend remains firmly bullish, I anticipate a temporary pullback before seeking an optimal entry point.
1D Balance Area: As you can see on the attached chart, price has formed a significant balance area on the daily timeframe at the accumulation phase. A Fibonacci retracement drawn from the low to the high reveals a confluence zone around the 61.8% level potentially offering a high-probability entry point for opportunistic longs. Note: This analysis is for educational purposes only, and I'm not dispensing financial advice. Always conduct your own due diligence before making any trading decisions.

#USDCAD= Beginning of the big trade! FX:USDCAD possible downtrend to continue towards 1.3200, as price have shown significant bearish pressure in last few days of the week. while dxy remain bearish cad has gained vast majority of bullish interest and it is likely that this is just beginning of downfall for USDCAD.
Good Luck

USDCAD Analysis H1Here is my analysis for USDCAD on H1 using Order Block. The price could go bearish, you can put a pending order on the Order block or find an entry on LTF within OB Zone. Trade Safe!

USDCAD Technical Analysis And Trade Idea Recently, the USDCAD has demonstrated a strong downward trend, touching a significant support level on both daily and weekly charts. In the accompanying video, a detailed examination of this trend is presented, carefully analysing price movements and identifying possible trading opportunities through a thorough analysis across multiple timeframes, ranging from weekly to as short as 15 minutes. Anticipate a comprehensive review covering price variations, market trends, trend evaluations, and crucial technical analysis components. It's crucial to emphasize that the information shared here is purely for educational purposes and should not be considered as financial advice.

USDCAD 08/12Pair : USDCAD ( U.S Dollar / Canadian Dollar )
Description :
Bearish Channel as an Corrective Pattern in Long Time Frame and Bullish Channel as an Corrective Pattern in Short Time Frame. Completed " 1234 " Impulsive at Daily Demand Zone and Rejection from Fibonacci Level - 61.80%
Entry Precautions :
Wait until it Reject or Complete its Retest
USDCAD Idea H1Here is my analysis for USDCAD on H1 using Order Block. The price could go bearish, you can put a pending order on the Order block or find an entry on LTF within OB Zone. Trade Safe!

USDCAD → Fall to 1.35200 or 1.40000!? Here's What We Know.USDCAD closed a bear candle below its bull channel support last week, leaving the bulls to wonder if this is the beginning of the end! Will the US Dollar recover and bring us back into the bull channel?
How do we trade this?
We closed a candle below the bull channel, it's reasonable to be biased to short in the short term. The price may want to make contact with the 200EMA at 1.35200 where it could show support and bounce to the upside. I think a short for 100 pips to 1.35200 is reasonable with a protective stop just above the bull channel support. It would be reasonable to take some or all profit just above the 200EMA, but you could hold some and see if the price falls further.
Key Takeaways
1. Closed Candle out of Bull Channel, Bias to Short.
2. Look at 4HR chart for a test of Bull Channel Support.
3. After Sell Signal, Target TP at 200EMA 1.35200
4. Watch for Support at 200EMA
5. RSI at 41.00, below Moving Average, Supports Short.
You are solely responsible for your trades, trade at your own risk!
If you found this analysis helpful, click the Boost button and let us know what you think in the comment section below!

USDCAD: UPDATE 25/11/2023! Dear Traders,
Our last idea on USDCAD, was a successful one it rejected at our area and dropped 160 pip; with this setup we anticipating price to do a retracement before it drop further. With accurate stop loss and risk management we can successfully achieve our target on this idea.
what do you think of USDCAD?

USD/CAD Drop to 1.35000? This is An Optimal Short Setup!USD/CAD is forming a Head and Shoulders reversal pattern, potentially signaling the end of this bull channel. The price action has begun to stall and oscillate around the 1.37000 level and is now falling below the 200EMA. We are now faced with a reversal signal in a bull channel.
How do we trade this?
The probability of profit is greater longing in a bull channel because there are more bull bars than bear bars. We are faced with a potential reversal pattern, the head and shoulders, which negates our bias to long. Should we short?
If you're looking to swing trade, yes! Swing trading involves lower win rates because you're trading the reversal of a pattern. In other words, you bet against the trend, which means your probability of profit is low, but your reward is *much* higher as a result.
A decent short here would have been to enter around 1.38000. Since that price is behind us, I would short here and set a protective stop loss above the right shoulder at 1.38000, take profit with half your position just below the bull channel at 1.36000, and the rest just above the 200EMA at 1.35300. Once the first take profit is hit, move your stop up to the entry price or just above it to lock in profits.
Key Points
1. Bull Channel with a reversal pattern.
2. Potential Head and Shoulders Forming.
3. Gap down to 200EMA, reasonable profit target.
4. RSI has Room to Fall
You are solely responsible for your trades, trade at your own risk!
Let us know what you think in the comment section below!

USDCADPair : USDCAD ( U.S Dollar / Canadian Dollar )
Description :
Rising Wedge as an Corrective Pattern in Short Time Frame with the Breakout of the Lower Trend Line and Completed the Retracement at Fibonacci Level - 78.60%. Completed Impulsive Waves " 12345 " and " AB " Corrective Wave
Entry Precautions :
Don't Enter Until it complete Correction

USDCAD → Moves below 1.3700 followed by 50-day EMAThe FX:USDCAD pair experiences downward pressure following the release of weaker US inflation data on Tuesday. Moreover, the uptick in crude oil prices is likely supporting the Canadian Dollar (CAD), adding to the pressure on the USD/CAD pair.
The technical indicators paint a bearish picture for the USD/CAD pair. The 14-day Relative Strength Index (RSI) below the 50 level indicates downward pressure, signaling a bearish momentum and reflecting a weaker market sentiment.
Additionally, the Moving Average Convergence Divergence (MACD) line, while above the centerline, has shown a divergence below the signal line. This suggests a potential shift in momentum towards a bearish sentiment in the USD/CAD pair.
The USD/CAD pair trades around 1.3690 during the early European session, after falling by almost 100 pips since the previous session. The 50-day Exponential Moving Average (EMA) at 1.3670 could act as the immediate support.
A firm break below the latter could influence the USD/CAD pair to navigate the region around the psychological level at 1.3600, followed by the 38.2% Fibonacci retracement at 1.3591 level.
On the upside, the major level at 1.3700 appears to be a key barrier. If there is a breakthrough above the latter, the bulls could revisit the weekly highs around the 1.3843 level.

USDCAD SHORT Short TermThis is for short term
Marked Possible Sell zone
Once Reached Entry zone Look for Liquidity sweep and BOS then Enter
And this is risky too.
Please DYOR before entering the trade.

USDCAD SELL | Day Trading AnalysisHello Traders, here is the full analysis.
Watch strong action at the current levels for SELL. GOOD LUCK! Great SELL opportunity USDCAD
I still did my best and this is the most likely count for me at the moment.
Support the idea with like and follow my profile TO SEE MORE.
Traders, if you liked this idea or if you have your own opinion about it, write in the comments. I will be glad 🤝
Patience is the If You Have Any Question, Feel Free To Ask 🤗
Just follow chart with idea and analysis and when you are ready come in THE GROVE | VIP GROUP, earn more and safe, wait for the signal at the right moment and make money with us💰

USDCAD is still continuing its upward momentumSpeaking on Tuesday, a number of hardline Fed members hinted that the economy may be weaker as a result of the tightening of financial conditions since July, which has seen a rise in 10-year Treasury yields of more than 100 basis points. However, it will take more time to determine if this effect is sustained.
"Inflation has decreased somewhat, but it is still too high," Dallas Fed President Lorie Logan stated at a Kansas City conference. The fundamental query, in my opinion, is whether the current fiscal constraints are stringent enough to quickly and sustainably raise inflation to 2%.
In a speech in St. Louis, Fed board of governors member Christopher Waller referred to the rate move as a “shock” to the bond market, while Michelle Bowman, another

USD/CAD Weekly Analysis - Bull Breakout to 1.40!USD/CAD has finally broken out of the bear channel/bull flag and closed near its high on the Weekly chart. Current price is at 1.38750 with a nice gap to fill at the bear channel high of 1.40000. This is an ideal Daily or Weekly scalp, placing your stop below the channel top of 1.37000 or the Weekly 9EMA. That creates a Risk/Reward Ratio of 2:1, which means your position size needs to be sized for your maximum loss for your account size. (Examples Below)
Key Points:
1. Weekly candle closing near its high
2. Weekly candle closed well above the Bear Channel
3. Gap between current price and channel high
4. RSI has room to move up
5. Scalp the gap between the current price and 1.40000
A weekly candle closing near its high after a breakout is a strong bull signal. The price has a gap to fill, and the RSI has room to move up. The RSI is a weak indicator on its own, but coupled with the other data points, it aids the conclusion. It's reasonable to scalp the gap on the Daily or Weekly charts. See the rationale below.
Trading Rationale
Let's say you have a $10,000 account and you apply the 2% rule of trading, where your maximum loss on any trade is 2% of your total account equity. In this case, $10,000 x 2% = $200. Therefore, a scalp on this chart should render a loss no greater than $200 and a reward of $100.
A scalp is justified in this case because our probability of success is likely higher than the general 40-60 rule, which states that the probability the market will move the same distance in either direction is between 40%-60%. In the 40%-60% scenarios, a 1:2 Risk Reward ratio means your probability of making money is positive.
When we have a strong breakout like USD/CAD, the probability of a continuation gets closer to 80%-90%. We can afford to extend our risk because the probability is so high. The simple math is if you ran this trade 10 times and hit your Take Profit on 8 of them (80%), you would win $800 and lose $400, a total profit of $400. Therefore, this is a reasonable trade.
As always, trade at your own risk, you are responsible for your trades. I hope this analysis was insightful and useful.
Trade wisely and let us know what you think in the comment section below!

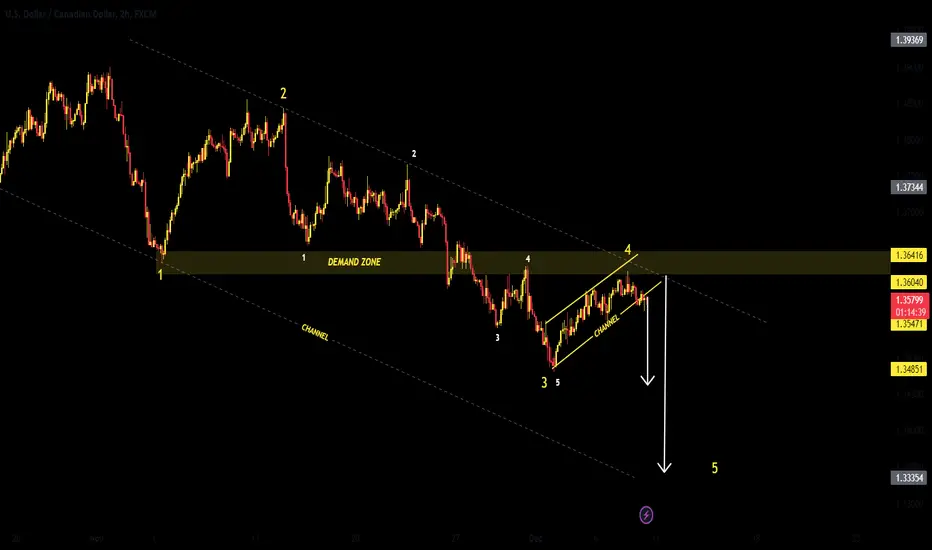
USDCAD 27/10 Pair : USDCAD ( U.S Dollar / Canadian Dollar )
Description :
Completed " 12345 " Impulsive Waves at Daily Resistance Level. Bullish Channel as an Corrective Pattern in Long Time Frame and Rejection from the Upper Trend Line. We have CHoCH and Divergence in RSI
Entry Precaution :
Wait for the Proper Rejection or Breakout

USDCAD BUY | Day Trading Analysis With Volume ProfileHello Traders, here is the full analysis.
Watch strong action at the current levels for BUY . GOOD LUCK! Great BUY opportunity USDCAD
I still did my best and this is the most likely count for me at the moment.
Support the idea with like and follow my profile TO SEE MORE.
Traders, if you liked this idea or if you have your own opinion about it, write in the comments. I will be glad 🤝
Patience is the If You Have Any Question, Feel Free To Ask 🤗
Just follow chart with idea and analysis and when you are ready come in THE GROVE | VIP GROUP, earn more and safe, wait for the signal at the right moment and make money with us💰

USDCAD Analysis H1Here is my analysis for USDCAD on H1 using Order Block. The price could go bullish, you can put a pending order on the Order block or find an entry on LTF within OB Zone. Trade Safe!

Daily Wave Rider - USDCAD - BUY USDCAD
Channel: GREEN
WK Pivot: GREEN
AOB: WP
CON: EngB
BUY Stop: 1.37578
Stop Loss: 1.36602
TP01: 1.38554
DWR present as a buy setup on 25 OCT, with Channel and Pivot are green bouncing off EngB
However, trade is not taken/considered
SPX500: SELL
DXY: UNSURE
OIL: BUY
GOLD: BUY

USDCAD Analysis H4Here is my analysis for USDCAD on H4 using Order Block. The price could go bullish, you can put a pending order on the Order block or find an entry on LTF within OB Zone. Trade Safe!
