Usdchf!
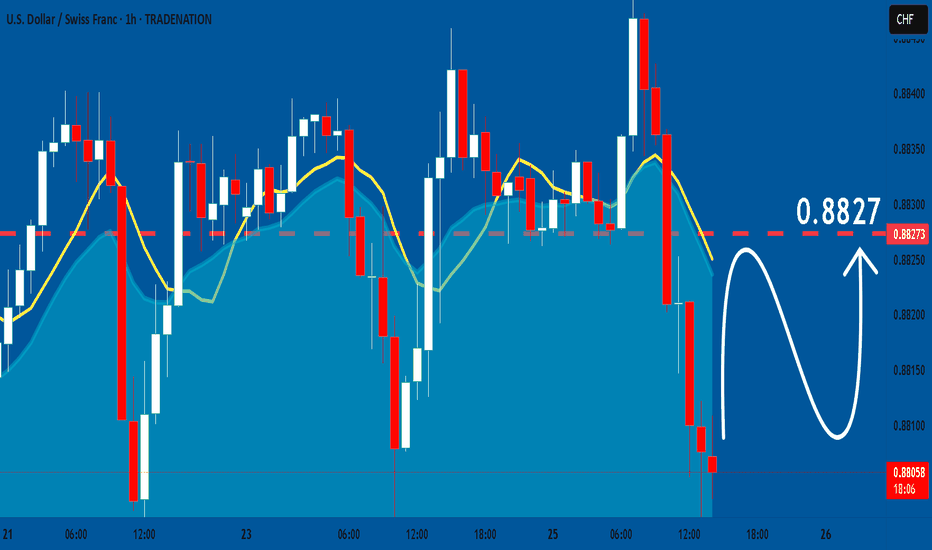
USDCHF The Target Is UP! BUY!
My dear friends,
Please, find my technical outlook for USDCHF below:
The price is coiling around a solid key level - 0.8806
Bias - Bullish
Technical Indicators: Pivot Points Low anticipates a potential price reversal.
Super trend shows a clear buy, giving a perfect indicators' convergence.
Goal - 0.8825
About Used Indicators:
The pivot point itself is simply the average of the high, low and closing prices from the previous trading day.
Disclosure: I am part of Trade Nation's Influencer program and receive a monthly fee for using their TradingView charts in my analysis.
———————————
WISH YOU ALL LUCK
USD_CHF SHORT SIGNAL|
✅USD_CHF is going up now
But a strong resistance level is ahead at 0.8860
Thus I am expecting a pullback
Which means we can enter a
Short trade with the TP of 0.8835
And the SL of 0.8866 but its is a
Risky setup so we recommend to use
A small lot size
SHORT🔥
✅Like and subscribe to never miss a new idea!✅
Disclosure: I am part of Trade Nation's Influencer program and receive a monthly fee for using their TradingView charts in my analysis.
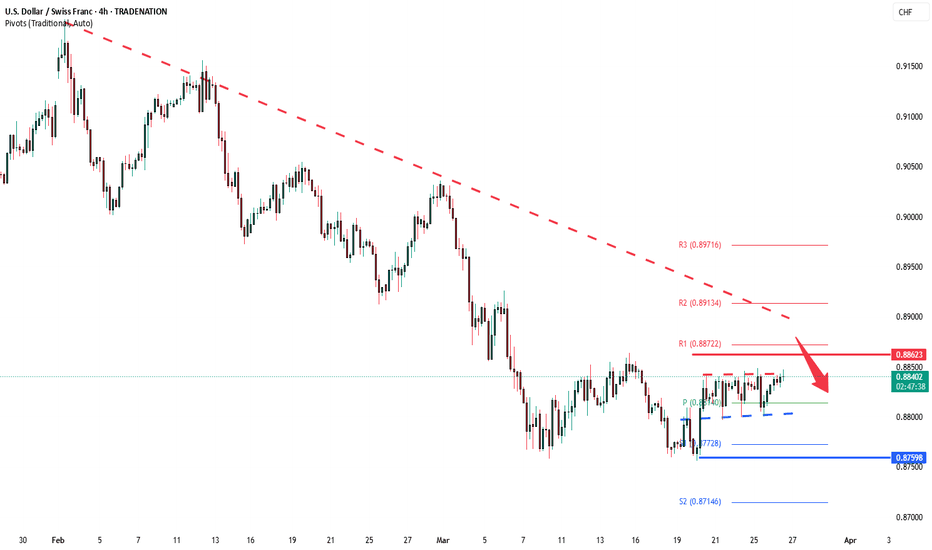
USDCHF INTRADAY sideways consolidation continuesThe USD/CHF price action exhibits bearish sentiment, supported by the prevailing downtrend. The current intraday swing high at 0.8860 serves as a critical trading level, as the pair shows potential for an oversold rally before facing bearish rejection.
Key Levels to Watch:
Key Resistance: 0.8860 (current intraday swing high)
Immediate Support: 0.8760
Lower Support Levels: 0.8720, 0.8680
Upside Resistance Levels: 0.8913, 0.8970
Bearish Scenario:
An oversold rally toward the 0.8860 level, followed by a bearish rejection, could validate the downtrend and target the immediate support at 0.8760. Continued bearish momentum could extend the decline to 0.8720 and ultimately 0.8680 over the longer timeframe.
Bullish Scenario:
A confirmed breakout above the 0.8860 resistance level, accompanied by a daily close above this mark, would negate the bearish outlook. This scenario could trigger further rallies toward the next resistance levels at 0.8913 and 0.8970.
Conclusion:
The prevailing sentiment remains bearish amid the ongoing downtrend. Traders should closely monitor the 0.8860 level for potential bearish rejections or a bullish breakout. A sustained close above this resistance could signal a shift toward bullish momentum, while failure to break above would reinforce the bearish outlook.
This communication is for informational purposes only and should not be viewed as any form of recommendation as to a particular course of action or as investment advice. It is not intended as an offer or solicitation for the purchase or sale of any financial instrument or as an official confirmation of any transaction. Opinions, estimates and assumptions expressed herein are made as of the date of this communication and are subject to change without notice. This communication has been prepared based upon information, including market prices, data and other information, believed to be reliable; however, Trade Nation does not warrant its completeness or accuracy. All market prices and market data contained in or attached to this communication are indicative and subject to change without notice.
USDCHF .. will the weakness continue ??I really don't see any reason for a change unless of course Mr .. causes another upheaval. For now, check out your charts and note that:
Monthly - bearish
Weekly - bearish
Daily - bearish
Intraday - all bearish.
We will hit and break a few S/R levels, but IMO, we should eventually get down to 0.8400.
This is not a trade recommendation, merely my own analysis. Trading carries a high level of risk, so only trade with money you can afford to lose and carefully manage your capital and risk. If you like my idea, please give a “boost” and follow me to get even more. Please comment and share your thoughts too!!
Bullish bounce?The Swissie (USD/CHF) has bounced off the pivot which is a pullback support and could rise to the 1st resistance which lines up with the 138.2% Fibonacci extension.
Pivot: 0.8797
1st Support: 0.8759
1st Resistance: 0.8911
Risk Warning:
Trading Forex and CFDs carries a high level of risk to your capital and you should only trade with money you can afford to lose. Trading Forex and CFDs may not be suitable for all investors, so please ensure that you fully understand the risks involved and seek independent advice if necessary.
Disclaimer:
The above opinions given constitute general market commentary, and do not constitute the opinion or advice of IC Markets or any form of personal or investment advice.
Any opinions, news, research, analyses, prices, other information, or links to third-party sites contained on this website are provided on an "as-is" basis, are intended only to be informative, is not an advice nor a recommendation, nor research, or a record of our trading prices, or an offer of, or solicitation for a transaction in any financial instrument and thus should not be treated as such. The information provided does not involve any specific investment objectives, financial situation and needs of any specific person who may receive it. Please be aware, that past performance is not a reliable indicator of future performance and/or results. Past Performance or Forward-looking scenarios based upon the reasonable beliefs of the third-party provider are not a guarantee of future performance. Actual results may differ materially from those anticipated in forward-looking or past performance statements. IC Markets makes no representation or warranty and assumes no liability as to the accuracy or completeness of the information provided, nor any loss arising from any investment based on a recommendation, forecast or any information supplied by any third-party.
USDCHF Is Very Bearish! Sell!
Please, check our technical outlook for USDCHF.
Time Frame: 12h
Current Trend: Bearish
Sentiment: Overbought (based on 7-period RSI)
Forecast: Bearish
The market is approaching a key horizontal level 0.883.
Considering the today's price action, probabilities will be high to see a movement to 0.865.
P.S
Please, note that an oversold/overbought condition can last for a long time, and therefore being oversold/overbought doesn't mean a price rally will come soon, or at all.
Disclosure: I am part of Trade Nation's Influencer program and receive a monthly fee for using their TradingView charts in my analysis.
Like and subscribe and comment my ideas if you enjoy them!
USD-CHF Local Short Form Resistance! Sell!
Hello,Traders!
USD-CHF is trading in a
Kind of range consolidating
For a next big move but
Right now we can use the
Moment to trade the local
Range and to short the pair
From the horizontal resistance
Of 0.8855
Sell!
Comment and subscribe to help us grow!
Check out other forecasts below too!
Disclosure: I am part of Trade Nation's Influencer program and receive a monthly fee for using their TradingView charts in my analysis.
USDCHF INTRADAY sideways ranging capped by 0.8862The USD/CHF price action exhibits bearish sentiment, supported by the prevailing downtrend. The current intraday swing high at 0.8860 serves as a critical trading level, as the pair shows potential for an oversold rally before facing bearish rejection.
Key Levels to Watch:
Key Resistance: 0.8860 (current intraday swing high)
Immediate Support: 0.8760
Lower Support Levels: 0.8720, 0.8680
Upside Resistance Levels: 0.8913, 0.8970
Bearish Scenario:
An oversold rally toward the 0.8860 level, followed by a bearish rejection, could validate the downtrend and target the immediate support at 0.8760. Continued bearish momentum could extend the decline to 0.8720 and ultimately 0.8680 over the longer timeframe.
Bullish Scenario:
A confirmed breakout above the 0.8860 resistance level, accompanied by a daily close above this mark, would negate the bearish outlook. This scenario could trigger further rallies toward the next resistance levels at 0.8913 and 0.8970.
Conclusion:
The prevailing sentiment remains bearish amid the ongoing downtrend. Traders should closely monitor the 0.8860 level for potential bearish rejections or a bullish breakout. A sustained close above this resistance could signal a shift toward bullish momentum, while failure to break above would reinforce the bearish outlook.
This communication is for informational purposes only and should not be viewed as any form of recommendation as to a particular course of action or as investment advice. It is not intended as an offer or solicitation for the purchase or sale of any financial instrument or as an official confirmation of any transaction. Opinions, estimates and assumptions expressed herein are made as of the date of this communication and are subject to change without notice. This communication has been prepared based upon information, including market prices, data and other information, believed to be reliable; however, Trade Nation does not warrant its completeness or accuracy. All market prices and market data contained in or attached to this communication are indicative and subject to change without notice.
FXAN & Heikin Ashi Trade IdeaOANDA:USDCHF
In this video, I’ll be sharing my analysis of USDCHF, using FXAN's proprietary algo indicators with my unique Heikin Ashi strategy. I’ll walk you through the reasoning behind my trade setup and highlight key areas where I’m anticipating potential opportunities.
I’m always happy to receive any feedback.
Like, share and comment! ❤️
Thank you for watching my videos! 🙏
Could the Swissie bounce from here?The price has bounced off the pivot which acts as a pullback support and could rise to the 1st resistance.
Pivot: 0.8797
1st Support: 0.8760
1st Resistance: 0.8918
Risk Warning:
Trading Forex and CFDs carries a high level of risk to your capital and you should only trade with money you can afford to lose. Trading Forex and CFDs may not be suitable for all investors, so please ensure that you fully understand the risks involved and seek independent advice if necessary.
Disclaimer:
The above opinions given constitute general market commentary, and do not constitute the opinion or advice of IC Markets or any form of personal or investment advice.
Any opinions, news, research, analyses, prices, other information, or links to third-party sites contained on this website are provided on an "as-is" basis, are intended only to be informative, is not an advice nor a recommendation, nor research, or a record of our trading prices, or an offer of, or solicitation for a transaction in any financial instrument and thus should not be treated as such. The information provided does not involve any specific investment objectives, financial situation and needs of any specific person who may receive it. Please be aware, that past performance is not a reliable indicator of future performance and/or results. Past Performance or Forward-looking scenarios based upon the reasonable beliefs of the third-party provider are not a guarantee of future performance. Actual results may differ materially from those anticipated in forward-looking or past performance statements. IC Markets makes no representation or warranty and assumes no liability as to the accuracy or completeness of the information provided, nor any loss arising from any investment based on a recommendation, forecast or any information supplied by any third-party.
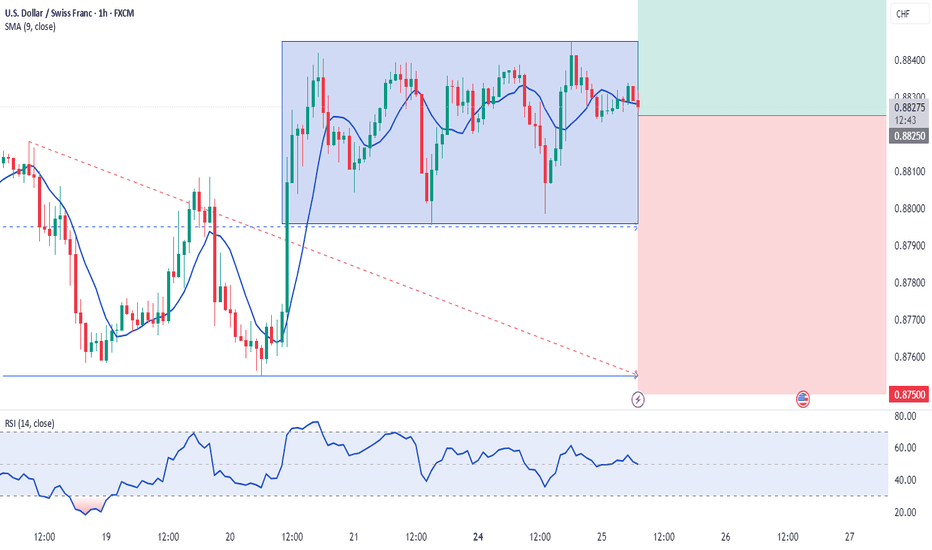
USDCHF | 25.03.2025BUY 0.88250 | STOP 0.87500 | TAKE 0.89250 | Technically, the price is likely to go up beyond the boundaries of the formed lateral local movement and consolidate above 0.88450, followed by a move to the level of 0.89250. The momentum is expected today on the publication of statistics from the United States. the indicators do not contradict this scenario.
USDCHF: Bullish Continuation is Expected! Here is Why:
The analysis of the USDCHF chart clearly shows us that the pair is finally about to go up due to the rising pressure from the buyers.
Disclosure: I am part of Trade Nation's Influencer program and receive a monthly fee for using their TradingView charts in my analysis.
❤️ Please, support our work with like & comment! ❤️
BUY opportunity on USDCHF M15
Please do not trade as my analysis might be incorrect.
I encourage constructive feedback.
If you did trade, make sure the drawing is respected, don't use exact values as they might differ from a broker to another.
Explanations:
MIN - last minimum point
MAX - last maximum point
BOS - break of structure
SMS - shift in market structure
SL - stop loss
TP - take profit
RR - risk reward
OB - order block
OB (15) - order block (based on M15) timeframe
USDCHF oversold bounce back capped at 0.8862The USD/CHF price action exhibits bearish sentiment, supported by the prevailing downtrend. The current intraday swing high at 0.8860 serves as a critical trading level, as the pair shows potential for an oversold rally before facing bearish rejection.
Key Levels to Watch:
Key Resistance: 0.8860 (current intraday swing high)
Immediate Support: 0.8760
Lower Support Levels: 0.8720, 0.8680
Upside Resistance Levels: 0.8913, 0.8970
Bearish Scenario:
An oversold rally toward the 0.8860 level, followed by a bearish rejection, could validate the downtrend and target the immediate support at 0.8760. Continued bearish momentum could extend the decline to 0.8720 and ultimately 0.8680 over the longer timeframe.
Bullish Scenario:
A confirmed breakout above the 0.8860 resistance level, accompanied by a daily close above this mark, would negate the bearish outlook. This scenario could trigger further rallies toward the next resistance levels at 0.8913 and 0.8970.
Conclusion:
The prevailing sentiment remains bearish amid the ongoing downtrend. Traders should closely monitor the 0.8860 level for potential bearish rejections or a bullish breakout. A sustained close above this resistance could signal a shift toward bullish momentum, while failure to break above would reinforce the bearish outlook.
This communication is for informational purposes only and should not be viewed as any form of recommendation as to a particular course of action or as investment advice. It is not intended as an offer or solicitation for the purchase or sale of any financial instrument or as an official confirmation of any transaction. Opinions, estimates and assumptions expressed herein are made as of the date of this communication and are subject to change without notice. This communication has been prepared based upon information, including market prices, data and other information, believed to be reliable; however, Trade Nation does not warrant its completeness or accuracy. All market prices and market data contained in or attached to this communication are indicative and subject to change without notice.
USDCHF Will Go Down From Resistance! Sell!
Please, check our technical outlook for USDCHF.
Time Frame: 1D
Current Trend: Bearish
Sentiment: Overbought (based on 7-period RSI)
Forecast: Bearish
The market is approaching a key horizontal level 0.882.
Considering the today's price action, probabilities will be high to see a movement to 0.866.
P.S
Please, note that an oversold/overbought condition can last for a long time, and therefore being oversold/overbought doesn't mean a price rally will come soon, or at all.
Disclosure: I am part of Trade Nation's Influencer program and receive a monthly fee for using their TradingView charts in my analysis.
Like and subscribe and comment my ideas if you enjoy them!
USD/CHF Ready for 92-Pip Bounce After Double Bottom?USD/CHF has been in a steady downtrend, but recent price action suggests a potential shift. A clear double bottom has formed near the 0.8800 level, hinting at strong buyer interest. The pair is now reacting from the 0.786 Fibonacci zone, and with bullish momentum building, it may target the 1.618 extension around 0.8919—about 92 pips higher. If this breakout sustains, further upside toward 0.8950 and above is possible, but failure to break that level could signal continuation of the broader downtrend. This zone is critical—watch closely.
USD/CHF H4 | Potential bullish bounceUSD/CHF is falling towards an overlap support and could potentially bounce off this level to climb higher.
Buy entry is at 0.8799 which is an overlap support.
Stop loss is at 0.8745 which is a level that lies underneath a multi-swing-low support.
Take profit is at 0.8911 which is an overlap resistance that aligns with the 38.2% Fibonacci retracement.
High Risk Investment Warning
Trading Forex/CFDs on margin carries a high level of risk and may not be suitable for all investors. Leverage can work against you.
Stratos Markets Limited (www.fxcm.com):
CFDs are complex instruments and come with a high risk of losing money rapidly due to leverage. 63% of retail investor accounts lose money when trading CFDs with this provider. You should consider whether you understand how CFDs work and whether you can afford to take the high risk of losing your money.
Stratos Europe Ltd (www.fxcm.com):
CFDs are complex instruments and come with a high risk of losing money rapidly due to leverage. 63% of retail investor accounts lose money when trading CFDs with this provider. You should consider whether you understand how CFDs work and whether you can afford to take the high risk of losing your money.
Stratos Trading Pty. Limited (www.fxcm.com):
Trading FX/CFDs carries significant risks. FXCM AU (AFSL 309763), please read the Financial Services Guide, Product Disclosure Statement, Target Market Determination and Terms of Business at www.fxcm.com
Stratos Global LLC (www.fxcm.com):
Losses can exceed deposits.
Please be advised that the information presented on TradingView is provided to FXCM (‘Company’, ‘we’) by a third-party provider (‘TFA Global Pte Ltd’). Please be reminded that you are solely responsible for the trading decisions on your account. There is a very high degree of risk involved in trading. Any information and/or content is intended entirely for research, educational and informational purposes only and does not constitute investment or consultation advice or investment strategy. The information is not tailored to the investment needs of any specific person and therefore does not involve a consideration of any of the investment objectives, financial situation or needs of any viewer that may receive it. Kindly also note that past performance is not a reliable indicator of future results. Actual results may differ materially from those anticipated in forward-looking or past performance statements. We assume no liability as to the accuracy or completeness of any of the information and/or content provided herein and the Company cannot be held responsible for any omission, mistake nor for any loss or damage including without limitation to any loss of profit which may arise from reliance on any information supplied by TFA Global Pte Ltd.
The speaker(s) is neither an employee, agent nor representative of FXCM and is therefore acting independently. The opinions given are their own, constitute general market commentary, and do not constitute the opinion or advice of FXCM or any form of personal or investment advice. FXCM neither endorses nor guarantees offerings of third-party speakers, nor is FXCM responsible for the content, veracity or opinions of third-party speakers, presenters or participants.
USD_CHF SHORT FROM RESISTANCE|
✅USD_CHF is going up now
But a strong resistance level is ahead at 0.8866
Thus I am expecting a pullback
And a move down towards the target of 0.8810
SHORT🔥
✅Like and subscribe to never miss a new idea!✅
Disclosure: I am part of Trade Nation's Influencer program and receive a monthly fee for using their TradingView charts in my analysis.
Weekly FOREX Forecast Mar 24-28: Buy CAD, CHF, JPY vs USD!This is an outlook for the week of March 24 - 28th.
In this video, we will analyze the following FX markets:
USD Index
EUR
GBP
AUD
NZD
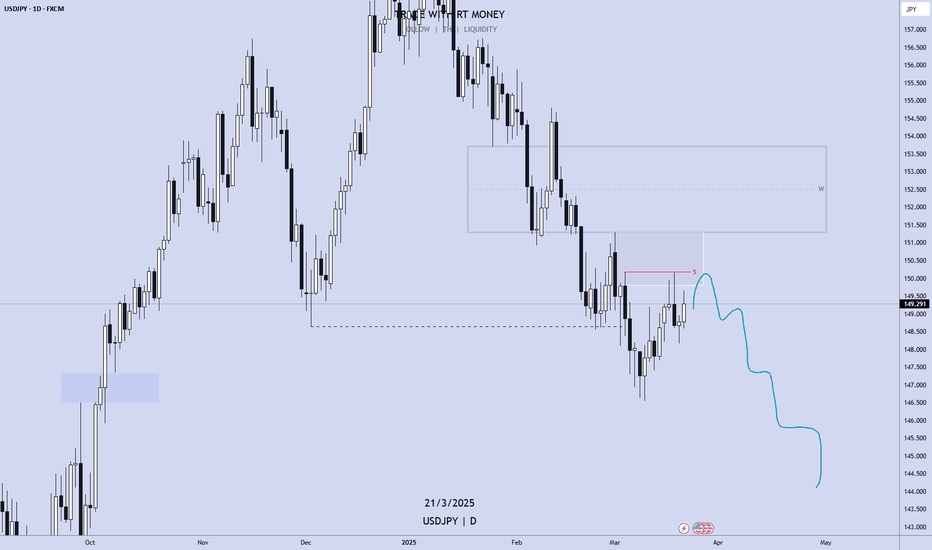
The USD Index is entering a Daily +FVG, which is nested in a Weekly +FVG. This is a bearish indication for the USD, which is a potential bullish situation for EURUSD, GBPUSD, AUDUSD and NZDUSD. This will be potentially bearish for the USDCAD, USDCHF, and USDJPY. Wait for the market structure shift going in the direction of your TP, and enter on the pullback.
Enjoy!
May profits be upon you.
Leave any questions or comments in the comment section.
I appreciate any feedback from my viewers!
Like and/or subscribe if you want more accurate analysis.
Thank you so much!
Disclaimer:
I do not provide personal investment advice and I am not a qualified licensed investment advisor.
All information found here, including any ideas, opinions, views, predictions, forecasts, commentaries, suggestions, expressed or implied herein, are for informational, entertainment or educational purposes only and should not be construed as personal investment advice. While the information provided is believed to be accurate, it may include errors or inaccuracies.
I will not and cannot be held liable for any actions you take as a result of anything you read here.
Conduct your own due diligence, or consult a licensed financial advisor or broker before making any and all investment decisions. Any investments, trades, speculations, or decisions made on the basis of any information found on this channel, expressed or implied herein, are committed at your own risk, financial or otherwise.


