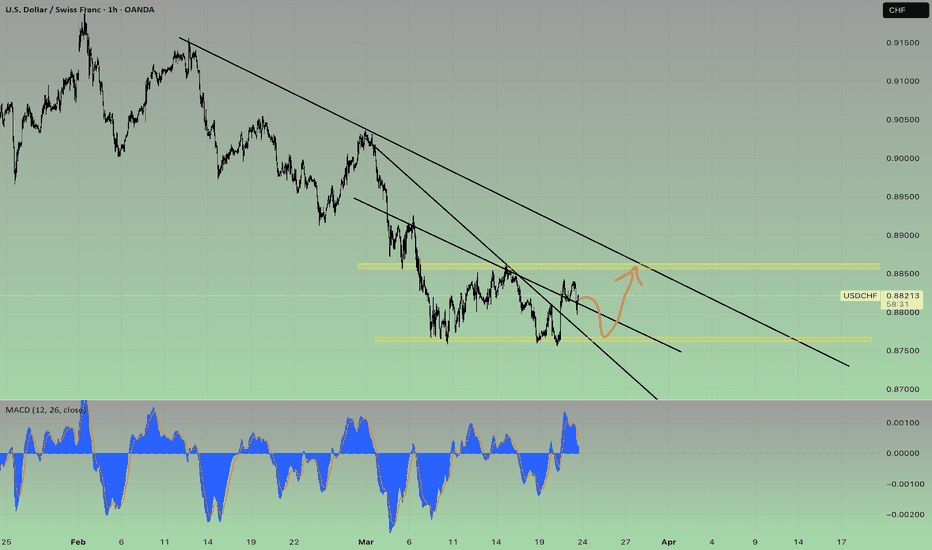
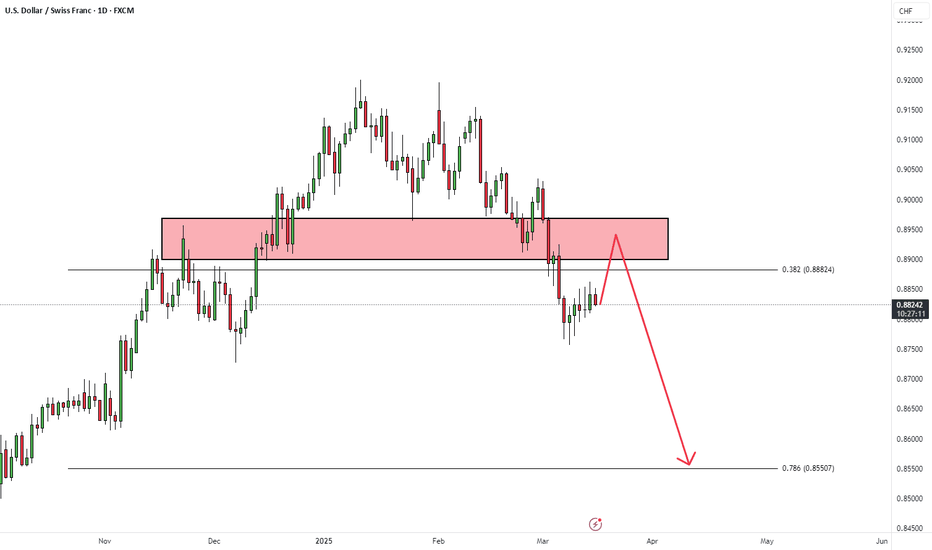
Be careful with USDCHF !!!It can pump after the correction...
Give me some energy !!
✨We spend hours finding potential opportunities and writing useful ideas, we would be happy if you support us.
Best regards CobraVanguard.💚
_ _ _ _ __ _ _ _ _ _ _ _ _ _ _ _ _ _ _ _ _ _ _ _ _ _ _ _ _ _ _ _
✅Thank you, and for more ideas, hit ❤️Like❤️ and 🌟Follow🌟!
⚠️Things can change...
The markets are always changing and even with all these signals, the market changes tend to be strong and fast!!
USDCHF
USDCHF BUYGiven the current scenario and the price action analysis of #USDCHF, we anticipate buying opportunities in the marked areas. Using the arrows, we can clearly examine the potential future price movement.
#Forex #Trading #ForexSignals #PriceAction #ForexMarket #FXTrading #ForexStrategy #TechnicalAnalysis #DayTrading #SwingTrading #ForexTrader
USDCHF H4 | Bearish Reversal Based on the H4 chart, the price is approaching our sell entry level at 0.8856, an overlap resistance.
Our take profit is set at 0.8810, an overlap support.
The stop loss is set at 0.8906, a swing high resistance.
High Risk Investment Warning
Trading Forex/CFDs on margin carries a high level of risk and may not be suitable for all investors. Leverage can work against you.
Stratos Markets Limited (fxcm.com/uk):
CFDs are complex instruments and come with a high risk of losing money rapidly due to leverage. 63% of retail investor accounts lose money when trading CFDs with this provider. You should consider whether you understand how CFDs work and whether you can afford to take the high risk of losing your money.
Stratos Europe Ltd (fxcm.com/eu):
CFDs are complex instruments and come with a high risk of losing money rapidly due to leverage. 63% of retail investor accounts lose money when trading CFDs with this provider. You should consider whether you understand how CFDs work and whether you can afford to take the high risk of losing your money.
Stratos Trading Pty. Limited (fxcm.com/au):
Trading FX/CFDs carries significant risks. FXCM AU (AFSL 309763), please read the Financial Services Guide, Product Disclosure Statement, Target Market Determination and Terms of Business at fxcm.com/au
Stratos Global LLC (fxcm.com/markets):
Losses can exceed deposits.
Please be advised that the information presented on TradingView is provided to FXCM (‘Company’, ‘we’) by a third-party provider (‘TFA Global Pte Ltd’). Please be reminded that you are solely responsible for the trading decisions on your account. There is a very high degree of risk involved in trading. Any information and/or content is intended entirely for research, educational and informational purposes only and does not constitute investment or consultation advice or investment strategy. The information is not tailored to the investment needs of any specific person and therefore does not involve a consideration of any of the investment objectives, financial situation or needs of any viewer that may receive it. Kindly also note that past performance is not a reliable indicator of future results. Actual results may differ materially from those anticipated in forward-looking or past performance statements. We assume no liability as to the accuracy or completeness of any of the information and/or content provided herein and the Company cannot be held responsible for any omission, mistake nor for any loss or damage including without limitation to any loss of profit which may arise from reliance on any information supplied by TFA Global Pte Ltd.
The speaker(s) is neither an employee, agent nor representative of FXCM and is therefore acting independently. The opinions given are their own, constitute general market commentary, and do not constitute the opinion or advice of FXCM or any form of personal or investment advice. FXCM neither endorses nor guarantees offerings of third-party speakers, nor is FXCM responsible for the content, veracity or opinions of third-party speakers, presenters or participants.
Bullish bounce?USD/CHF is falling towards the support level which is an overlap support that is slightly above the 50% Fibonacci retracement and could bounce from this level to our take profit.
Entry: 0.8802
Why we like it:
There is an overlap support level that is slightly above the 50% Fibonacci retracement.
Stop loss: 0.8775
Why we like it:
There is a pullback support level that lines up with the 78.6% Fibonacci retracement.
Take profit: 0.8835
Why we like it:
There is an overlap resistance level.
Enjoying your TradingView experience? Review us!
Please be advised that the information presented on TradingView is provided to Vantage (‘Vantage Global Limited’, ‘we’) by a third-party provider (‘Everest Fortune Group’). Please be reminded that you are solely responsible for the trading decisions on your account. There is a very high degree of risk involved in trading. Any information and/or content is intended entirely for research, educational and informational purposes only and does not constitute investment or consultation advice or investment strategy. The information is not tailored to the investment needs of any specific person and therefore does not involve a consideration of any of the investment objectives, financial situation or needs of any viewer that may receive it. Kindly also note that past performance is not a reliable indicator of future results. Actual results may differ materially from those anticipated in forward-looking or past performance statements. We assume no liability as to the accuracy or completeness of any of the information and/or content provided herein and the Company cannot be held responsible for any omission, mistake nor for any loss or damage including without limitation to any loss of profit which may arise from reliance on any information supplied by Everest Fortune Group.
USDCHF Correction Due To Produce A Reversal Pattern?OANDA:USDCHF has been in a Correction Wave since the beginning of January and we now see that Price may have finally found Support at the 1.809 Fibonacci Extension Level of the Correction Wave.
With both Lows in March finding Support at the 1.809 Fibonacci Extension Level, Price is beginning to form what looks like a Reversal Pattern, the Double Bottom!
** Confirmation of Pattern will come when Price Breaks and Closes Above .8863, then we will be looking for a Long Opportunity to present itself as a Break and Retest Set-Up. The Retest will Validate the Trade Idea!
If we take the height of the Pattern and apply it to the Break of Confirmation, this puts the Potential Target at Previous Area of Support of the Correction Wave ( Point A ) in the .8975 area.
Fundamentals seem to Support the Bullish Idea with:
SNB Cutting Interest Rates by 25 Basis points from .5% to .25%
FED Holding Interest Rates @ 4.5% due to "Economic Uncertainty"
Unemployment Claims for USD came in as expected with no surprise and even 1K below Forecast ( Actual 223K / Forecast 224K )
Also Positive Outlook from Philly Fed Manufacturing Index and Existing Home Sales see USD rise.
Next Weeks Final GDP on Thursday, March 27th will be the next big News Event to bring some light to how the economy is doing and if USD will continue strengthening!
USDCHF Potential DownsidesHey Traders, in today's trading session we are monitoring USDCHF for a selling opportunity around 0.88900 zone, USDCHF is trading in a downtrend and currently is in a correction phase in which it is approaching the trend at 0.88900 support and resistance area.
Trade safe, Joe.
USD/CHF SELLERS WILL DOMINATE THE MARKET|SHORT
Hello, Friends!
USD/CHF is making a bullish rebound on the 3H TF and is nearing the resistance line above while we are generally bearish biased on the pair due to our previous 1W candle analysis, thus making a trend-following short a good option for us with the target being the 0.878 level.
Disclosure: I am part of Trade Nation's Influencer program and receive a monthly fee for using their TradingView charts in my analysis.
✅LIKE AND COMMENT MY IDEAS✅
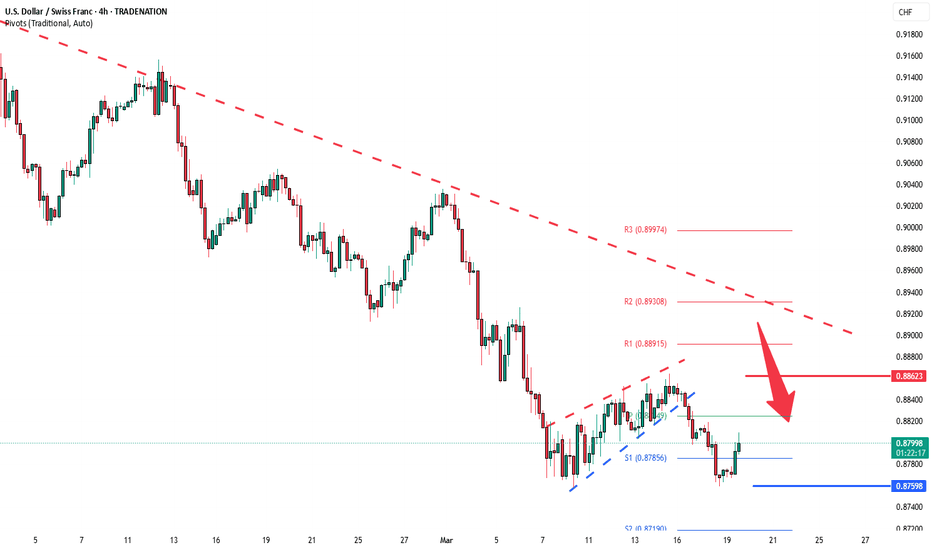
USDCHF INTRADAY oversold bounce backThe USD/CHF price action exhibits bearish sentiment, supported by the prevailing downtrend. The current intraday swing high at 0.8860 serves as a critical trading level, as the pair shows potential for an oversold rally before facing bearish rejection.
Key Levels to Watch:
Key Resistance: 0.8860 (current intraday swing high)
Immediate Support: 0.8760
Lower Support Levels: 0.8720, 0.8680
Upside Resistance Levels: 0.8890, 0.8930
Bearish Scenario:
An oversold rally toward the 0.8860 level, followed by a bearish rejection, could validate the downtrend and target the immediate support at 0.8760. Continued bearish momentum could extend the decline to 0.8720 and ultimately 0.8680 over the longer timeframe.
Bullish Scenario:
A confirmed breakout above the 0.8860 resistance level, accompanied by a daily close above this mark, would negate the bearish outlook. This scenario could trigger further rallies toward the next resistance levels at 0.8890 and 0.8930.
Conclusion:
The prevailing sentiment remains bearish amid the ongoing downtrend. Traders should closely monitor the 0.8860 level for potential bearish rejections or a bullish breakout. A sustained close above this resistance could signal a shift toward bullish momentum, while failure to break above would reinforce the bearish outlook.
This communication is for informational purposes only and should not be viewed as any form of recommendation as to a particular course of action or as investment advice. It is not intended as an offer or solicitation for the purchase or sale of any financial instrument or as an official confirmation of any transaction. Opinions, estimates and assumptions expressed herein are made as of the date of this communication and are subject to change without notice. This communication has been prepared based upon information, including market prices, data and other information, believed to be reliable; however, Trade Nation does not warrant its completeness or accuracy. All market prices and market data contained in or attached to this communication are indicative and subject to change without notice.
If you don't have DXY, keep an eye on USDCHF.Today we are waiting for the Federal Reserve interest rate decision, where the Bank is expected to keep the rates unchanged. However, it's the press conference, which we are more bothered about. Keep your eyes on TVC:DXY , but if you don't have MARKETSCOM:DOLLARINDEX , then MARKETSCOM:USDCHF will be just as good.
Let's dig in.
FX_IDC:USDCHF
Let us know what you think in the comments below.
Thank you.
74.2% of retail investor accounts lose money when trading CFDs with this provider. You should consider whether you understand how CFDs work and whether you can afford to take the high risk of losing your money. Past performance is not necessarily indicative of future results. The value of investments may fall as well as rise and the investor may not get back the amount initially invested. This content is not intended for nor applicable to residents of the UK. Cryptocurrency CFDs and spread bets are restricted in the UK for all retail clients.
USDCHF to continue in the downward move?USDCHF - 24h expiry
Broken out of the channel formation to the downside.
Our short term bias remains negative.
Offers ample risk/reward to sell at the market.
The weaker US dollar has boosted performance.
20 4hour EMA is at 0.8801.
We look to Sell at 0.8799 (stop at 0.8839)
Our profit targets will be 0.8701 and 0.8681
Resistance: 0.8777 / 0.8800 / 0.8818
Support: 0.8759 / 0.8740 / 0.8720
Risk Disclaimer
The trade ideas beyond this page are for informational purposes only and do not constitute investment advice or a solicitation to trade. This information is provided by Signal Centre, a third-party unaffiliated with OANDA, and is intended for general circulation only. OANDA does not guarantee the accuracy of this information and assumes no responsibilities for the information provided by the third party. The information does not take into account the specific investment objectives, financial situation, or particular needs of any particular person. You should take into account your specific investment objectives, financial situation, and particular needs before making a commitment to trade, including seeking advice from an independent financial adviser regarding the suitability of the investment, under a separate engagement, as you deem fit.
You accept that you assume all risks in independently viewing the contents and selecting a chosen strategy.
Where the research is distributed in Singapore to a person who is not an Accredited Investor, Expert Investor or an Institutional Investor, Oanda Asia Pacific Pte Ltd (“OAP“) accepts legal responsibility for the contents of the report to such persons only to the extent required by law. Singapore customers should contact OAP at 6579 8289 for matters arising from, or in connection with, the information/research distributed.
USD-CHF Free Signal! Buy!
Hello,Traders!
USD-CHF keeps falling down
But the pair will soon hit
A horizontal support
Of 0.8754 from where
We can enter a long trade
With the TP of 0.8795
And the SL of 0.8730
Buy!
Comment and subscribe to help us grow!
Check out other forecasts below too!
Disclosure: I am part of Trade Nation's Influencer program and receive a monthly fee for using their TradingView charts in my analysis.
Bullish bounce?USD/CHF is falling towards the support level which is an overlap support that is slightly above the 61.8% Fibonacci retracement and could bounce from this level to our take profit.
Entry: 0.8726
Why we like it:
There is an overlap support level that is slightly above the 61.8% Fibonacci retracement.
Stop loss: 0.8618
Why we like it:
There is a pullback support level that aligns with the 127.2% Fibonacci extension.
Take profit: 0.8851
Why we like it:
There is a pullback resistance level.
Enjoying your TradingView experience? Review us!
Please be advised that the information presented on TradingView is provided to Vantage (‘Vantage Global Limited’, ‘we’) by a third-party provider (‘Everest Fortune Group’). Please be reminded that you are solely responsible for the trading decisions on your account. There is a very high degree of risk involved in trading. Any information and/or content is intended entirely for research, educational and informational purposes only and does not constitute investment or consultation advice or investment strategy. The information is not tailored to the investment needs of any specific person and therefore does not involve a consideration of any of the investment objectives, financial situation or needs of any viewer that may receive it. Kindly also note that past performance is not a reliable indicator of future results. Actual results may differ materially from those anticipated in forward-looking or past performance statements. We assume no liability as to the accuracy or completeness of any of the information and/or content provided herein and the Company cannot be held responsible for any omission, mistake nor for any loss or damage including without limitation to any loss of profit which may arise from reliance on any information supplied by Everest Fortune Group.
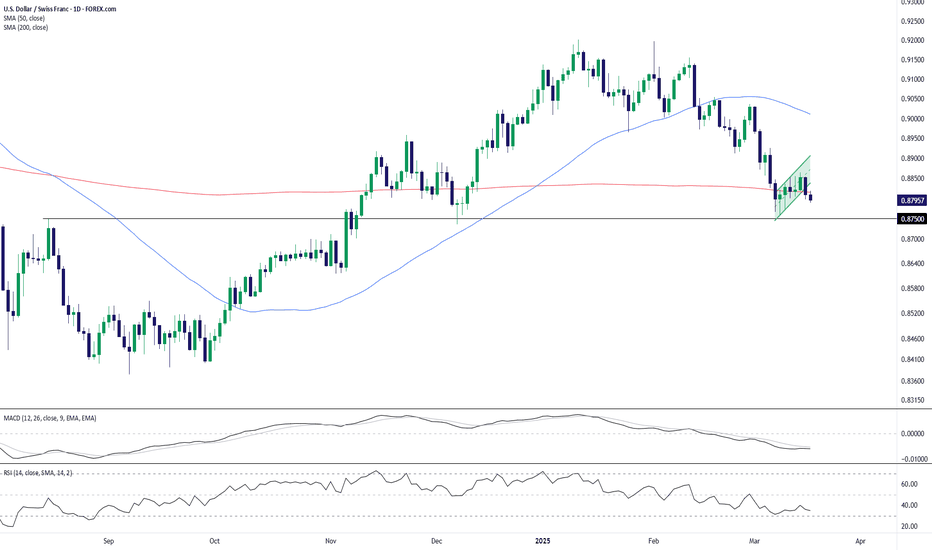
USD/CHF Struggles at Key Support Amid Bearish MomentumUSD/CHF remains under pressure after breaking below the 200-day SMA (0.8815) and failing to reclaim it. The pair has formed a bearish flag pattern, indicating the potential for further downside. The next key support level sits at 0.8750, which, if breached, could accelerate selling pressure.
Momentum indicators confirm the bearish outlook:
📉 MACD remains in negative territory, signaling weak momentum.
📊 RSI at 34.75 nears oversold conditions but hasn’t triggered a reversal signal yet.
Key Levels to Watch:
📌 Support: 0.8750 (critical level), 0.8650 (next downside target)
📌 Resistance: 0.8850 (recent swing high), 0.9010 (50-day SMA)
A break below 0.8750 could open the door for a deeper decline, while a bounce above 0.8850 would signal a potential recovery.
-MW
USDCHF: Expecting Bullish Continuation! Here is Why:
Looking at the chart of USDCHF right now we are seeing some interesting price action on the lower timeframes. Thus a local move up seems to be quite likely.
Disclosure: I am part of Trade Nation's Influencer program and receive a monthly fee for using their TradingView charts in my analysis.
❤️ Please, support our work with like & comment! ❤️
USDCHF INTRADAY Rising Wedge formingThe USD/CHF price action exhibits bearish sentiment, supported by the prevailing downtrend. The current intraday swing high at 0.8860 serves as a critical trading level, as the pair shows potential for an oversold rally before facing bearish rejection.
Key Levels to Watch:
Key Resistance: 0.8860 (current intraday swing high)
Immediate Support: 0.8760
Lower Support Levels: 0.8720, 0.8680
Upside Resistance Levels: 0.8890, 0.8930
Bearish Scenario:
An oversold rally toward the 0.8860 level, followed by a bearish rejection, could validate the downtrend and target the immediate support at 0.8760. Continued bearish momentum could extend the decline to 0.8720 and ultimately 0.8680 over the longer timeframe.
Bullish Scenario:
A confirmed breakout above the 0.8860 resistance level, accompanied by a daily close above this mark, would negate the bearish outlook. This scenario could trigger further rallies toward the next resistance levels at 0.8890 and 0.8930.
Conclusion:
The prevailing sentiment remains bearish amid the ongoing downtrend. Traders should closely monitor the 0.8860 level for potential bearish rejections or a bullish breakout. A sustained close above this resistance could signal a shift toward bullish momentum, while failure to break above would reinforce the bearish outlook.
This communication is for informational purposes only and should not be viewed as any form of recommendation as to a particular course of action or as investment advice. It is not intended as an offer or solicitation for the purchase or sale of any financial instrument or as an official confirmation of any transaction. Opinions, estimates and assumptions expressed herein are made as of the date of this communication and are subject to change without notice. This communication has been prepared based upon information, including market prices, data and other information, believed to be reliable; however, Trade Nation does not warrant its completeness or accuracy. All market prices and market data contained in or attached to this communication are indicative and subject to change without notice.
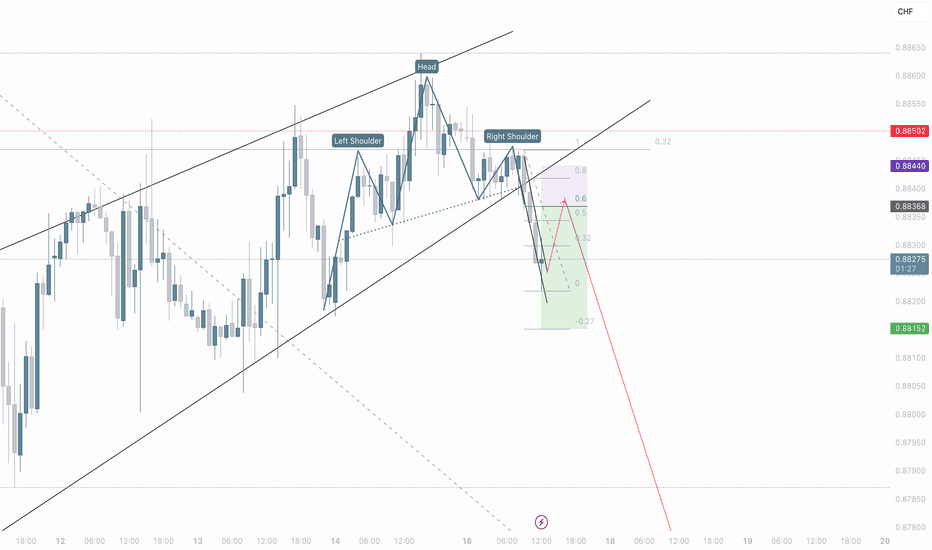
USD/CHF: Selling the Head & Shoulders BreakdownSpotted a clear H&S pattern on USD/CHF 15m chart!
Selling at 0.8826 with stop above 0.8844.
Target: First 0.8815, then possibly lower to the -0.27 Fib level.
The neckline break looks solid and we're still in the channel. Risk-reward looks good here.
What do you think? Are you bearish on USD/CHF too?
#USDCHF #Forex #TradingIdea
USDCHFHello Traders! 👋
What are your thoughts on USDCHF?
In the daily timeframe, USDCHF has broken a key support level, which has now turned into resistance.
The pair is currently forming a pullback to the broken level, retesting it as resistance.
We expect the price to complete its pullback to the broken level and then continue its decline toward the specified target.
Will USD/CHF resume its downtrend after the pullback, or will buyers regain control? Share your thoughts below!
Don’t forget to like and share your thoughts in the comments! ❤️
USD/CHF - Bullish Reversal Setup
This 4-hour chart of USD/CHF shows a potential bullish reversal from a key support level.
Support Zone: The price is approaching a strong support level around 1.10193 - 1.12261, where previous price action has reacted.
Reversal Expectation: A bounce from this level could trigger a bullish move toward the 1.15719 resistance level.
Target Projection: If price respects the support, a 3.00% potential upside is expected.
Trading Plan:
Buy Entry: Look for bullish confirmation signals at the support zone.
Stop-Loss: Below the support area to minimize risk.
Take Profit: First target at 1.15719.
Technical Indicators to Watch:
Bullish Candlestick Patterns at support.
RSI / MACD for momentum confirmation.
Trendline Breakout for additional bullish confirmation.
USD/CHF "The Swissy" Forex Market Heist Plan Bearish🌟Hi! Hola! Ola! Bonjour! Hallo! Marhaba!🌟
Dear Money Makers & Robbers, 🤑 💰🐱👤🐱🏍
Based on 🔥Thief Trading style technical and fundamental analysis🔥, here is our master plan to heist the USD/CHF "The Swissy" Forex Market. Please adhere to the strategy I've outlined in the chart, which emphasizes short entry. Our aim is the high-risk Green Zone. Risky level, oversold market, consolidation, trend reversal, trap at the level where traders and bullish robbers are stronger. 🏆💸Book Profits Be wealthy and safe trade.💪🏆🎉
Entry 📈 : "The vault is wide open! Swipe the Bearish loot at any price - the heist is on!
however I advise placing Sell limit orders within a 15 or 30 minute timeframe. Entry from the most recent or closest low or high level should be in retest.
Stop Loss 🛑: Thief SL placed at 0.90500 (swing Trade) Using the 4H period, the recent / nearest low or high level.
SL is based on your risk of the trade, lot size and how many multiple orders you have to take.
Target 🎯: 0.88000 (or) Escape Before the Target
Scalpers, take note 👀 : only scalp on the Short side. If you have a lot of money, you can go straight away; if not, you can join swing traders and carry out the robbery plan. Use trailing SL to safeguard your money 💰.
📰🗞️Fundamental, Macro, COT, Sentimental Outlook:
USD/CHF "The Swissy" Forex Market is currently experiencing a Bearish trend., driven by several key factors.
🌟Fundamental Analysis
The USD/CHF pair is influenced by:
Interest Rate Differential: The difference between the Federal Reserve's interest rates and the Swiss National Bank's interest rates.
Economic Growth: The US GDP growth rate and the Swiss GDP growth rate.
Inflation Rates: The US inflation rate and the Swiss inflation rate.
🌟Macroeconomic Analysis
Key macroeconomic indicators to watch:
US GDP Growth Rate: Expected to slow down in 2025.
Swiss GDP Growth Rate: Expected to remain stable in 2025.
US Inflation Rate: Expected to decrease in 2025.
Swiss Inflation Rate: Expected to remain low in 2025.
🌟COT Data Analysis
The latest Commitment of Traders (COT) report shows:
Net Long Positions: Decreased by 10,000 contracts.
Net Short Positions: Increased by 5,000 contracts.
🌟Market Sentimental Analysis
Market sentiment for USD/CHF is:
Bearish: 55% of investors expect the pair to fall.
Bullish: 30% of investors expect the pair to rise.
Neutral: 15% of investors remain neutral.
🌟Positioning Analysis
Traders are advised to:
Consider short-term investments: As the USD/CHF pair is expected to experience high volatility.
Monitor market news: As central bank decisions and global economic data may impact the pair.
🌟Quantitative Analysis
Technical indicators show:
Moving Averages: The 50-day and 200-day moving averages are indicating a bearish trend.
Relative Strength Index (RSI): The RSI is indicating an oversold condition.
🌟Intermarket Analysis
The USD/CHF pair is highly correlated with:
EUR/USD: A stronger euro may boost the Swiss franc against the US dollar.
USD/JPY: A weaker US dollar may boost the Swiss franc against the yen.
🌟News and Events Analysis
Upcoming events that may impact the USD/CHF pair include:
Federal Reserve Monetary Policy Decision: March 19, 2025
Swiss National Bank Monetary Policy Decision: March 20, 2025
🌟Next Trend Move
The USD/CHF pair may experience a:
Bearish move: Driven by the interest rate differential and economic growth.
🌟Overall Summary Outlook
The USD/CHF pair is expected to:
Experience high volatility: Due to central bank decisions and global economic data.
Remain bearish: In the short-term, driven by the interest rate differential and economic growth.
⚠️Trading Alert : News Releases and Position Management 📰 🗞️ 🚫🚏
As a reminder, news releases can have a significant impact on market prices and volatility. To minimize potential losses and protect your running positions,
we recommend the following:
Avoid taking new trades during news releases
Use trailing stop-loss orders to protect your running positions and lock in profits
💖Supporting our robbery plan will enable us to effortlessly make and steal money 💰💵 Tell your friends, Colleagues and family to follow, like, and share. Boost the strength of our robbery team. Every day in this market make money with ease by using the Thief Trading Style.🏆💪🤝❤️🎉🚀
I'll see you soon with another heist plan, so stay tuned 🤑🐱👤🤗🤩
Heading into 61.8% Fibonacci resistance?The Swissie (USD/CHF) is rising towards the pivot and could reverse to the 1st support.
Pivot: 0.8915
1st Support: 0.8771
1st Resistance: 0.9004
Risk Warning:
Trading Forex and CFDs carries a high level of risk to your capital and you should only trade with money you can afford to lose. Trading Forex and CFDs may not be suitable for all investors, so please ensure that you fully understand the risks involved and seek independent advice if necessary.
Disclaimer:
The above opinions given constitute general market commentary, and do not constitute the opinion or advice of IC Markets or any form of personal or investment advice.
Any opinions, news, research, analyses, prices, other information, or links to third-party sites contained on this website are provided on an "as-is" basis, are intended only to be informative, is not an advice nor a recommendation, nor research, or a record of our trading prices, or an offer of, or solicitation for a transaction in any financial instrument and thus should not be treated as such. The information provided does not involve any specific investment objectives, financial situation and needs of any specific person who may receive it. Please be aware, that past performance is not a reliable indicator of future performance and/or results. Past Performance or Forward-looking scenarios based upon the reasonable beliefs of the third-party provider are not a guarantee of future performance. Actual results may differ materially from those anticipated in forward-looking or past performance statements. IC Markets makes no representation or warranty and assumes no liability as to the accuracy or completeness of the information provided, nor any loss arising from any investment based on a recommendation, forecast or any information supplied by any third-party.

