USDCHF SELLThis is a USDCHF quick analysis on 1hr timeframe, the market is currently selling and i'm expecting it to continue to sell for 120 plus PIPs, this is ITT's take on it we urge you to trade with a good risk management, GOODLUCK.
Usdchfforecast


USDCHF BEARISHUSDCHF create bearish butterfly pattern with Hidden Bearish Divergence!
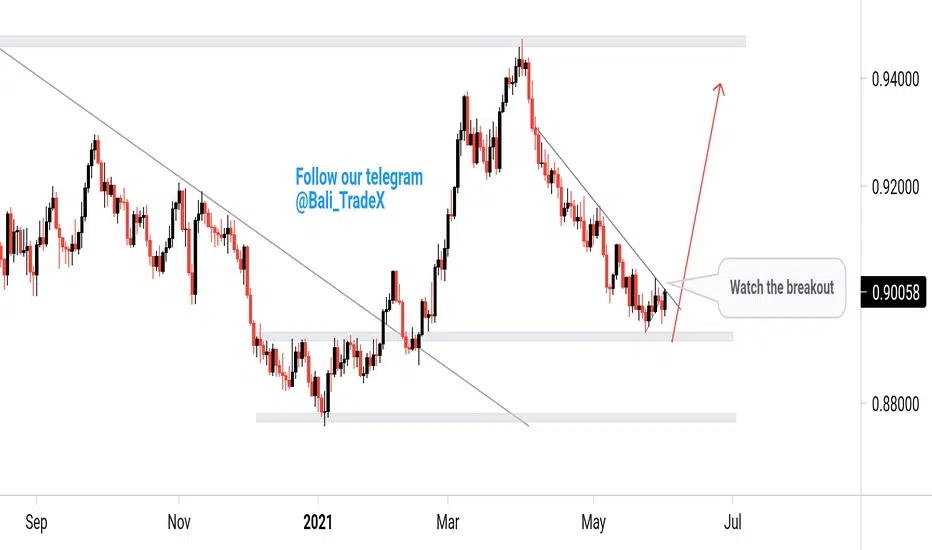
Retest the breakout and than gonna fly for .938xxx


USD CHF MAY GO SHORT ACCORDING TO MY TECHNICALS. {13/6/2021}Disclaimer:- Educational Analysis says USD CHF may go Short according to my technicals.
This is not an entry signal. I have no concern with your profit and loss from this analysis.
Why short?
DAILY SUPPORT AND RESISTANCE LEVEL HAVE BEEN PRESENTED ON THE CHART.
ON H1 TF PAIR IS MAKING LOWER HIGH AND LOWER LOW.
EVENTUALLY MADE DOUBLE TOP
ATR IS 15 PIPS.
I HAVE NO CONCERNS WITH YOUR PROFIT OR LOSS.
ADDITIONAL CONFIRMATION IS BEARISH ENGULFING ON SMALLER TIME FRAMES OF 5M TO 15M.
ENTRY 0.89670
STOP-LOSS 0.90076
TAKE PROFIT 0.87900

USDCHF-longUSDCHF market is going to buy in H4 timeframe analysis. Wait for some time after the opening of the market if it didn't reverse then you can open buy trade.

USD/CHF buy opportunity for short-termIt seems like USD/CHF is consolidating in the hourly chart and there
might be a rebound to the upside soon.
Based on the hourly chart, buying USDCHF@0.8955-0.8970 with SL below
0.8930 and TP at 0.9050 would be a possible buy set-up.

A short term #Long tradeUSDCHF is in a #bearish trend keep in mind, Inspite the downward trend, we have an upcomming #long trade. enjoy it.

USDCHF BULLISHUSDCHF Long Opportunity!
Dollar gonna be strong!
92% accuracy trade!
1. TrendLine With Hidden Bullish Divergence
2. Double Bottom
3. Falling Wages

USDCHF trade ideaUCHF is not on my Hotlist, but it is on my Watchlist for the week ahead. I am bearish, and any pullback with bearish PA following it will get me involved in shorting this pair.


USDCHF trade idea....Waiting for a pullback to enter short. I think this will set up nicely, as price is already on its way.


Failure at 50 MA on 4H. wouldn't it be a nice short here?I'm going short here. stop is 0.92 and take profit is at 0.89x 1:2 trade.

USDCHF | Perspective for the new week | Follow-upPrice has moved over 100pips in our direction since my last publication on this pair (see link below for reference purposes) and I am looking forward to a further dip to complete correction of the Breakout that happened on the 24th Feb 2021 to join the rally in the coming week(s).
Following the Swiss National Bank (SNB) Chairman Thomas Jordan perspective that it shall continue to adopt a negative interest rate approach appears to pose a negative effect on the Swiss franc as the risk of further decline remain imminent even though it remains highly valued.
Tendency: Uptrend ( Bullish )
Structure: Breakout | Supply & Demand | Harmonic pattern (AB = CD)
Observation: i. Following the neckline Breakout, the price hit a peak of Fr0.94750 - a level that was immediately met with rejection as it rolled back down with a possible motive of making a Correction of the last Breakout (AB leg).
ii. In this regard, I shall be looking forward to transposition into an AB = CD pattern with parameters explained below;
a. Leg A-to-B is expected to be in harmony with the potential C-to-D leg.
b. The B- to-C leg is expected to test 61.8% - Fr0.905000 (with the possibility of retracing into 78.6% - Fr0.89000 in the future) Fibonacci retracement of the A-to-B leg.
c. The C-to-D leg is expected to extend within 127.2 - 1.414% Fib. ext. of the A-to-B move @ FR0.975000 area.
iii. I must emphasize here that completion of retracement (BC leg) is what we are waiting for to join the rally and it is very possible that completion might be at the Demand zone which is around Fr0.890000/0.905000 before the rally begins.
iv. However, should price decide not to retrace that dip, then a close above Key level @ Fr0.915000 shall be a yardstick for buying opportunity in the coming week... trade consciously :)!
Trading plan: BUY confirmation with a minimum potential profit of 500 pips.
Risk/Reward : 1:8
Potential Duration: 20 to 30days
NB: his is a long term speculation and may be considered to make decisions on lower timeframes.
Watch this space for updates as price action is been monitored.
Risk Disclaimer:
Margin trading in the foreign exchange market (including foreign exchange trading, CFDs, etc.) has a high risk and is not suitable for all investors. The content of this speculation (including all data) is organized and published by me for the sole purpose of education and assistance in making independent investment decisions. All information herein is for your reference only and I take no responsibility.
You are hereby advised to carefully consider your investment experience, financial situation, investment objective, risk tolerance level, and consult your independent financial adviser as to the suitability of your situation prior to making any investment.
I do not guarantee its accuracy and is not liable for any loss or damage which may result directly or indirectly from such content or the receipt of any instruction or notification therewith.
Past performance is not necessarily indicative of future results.

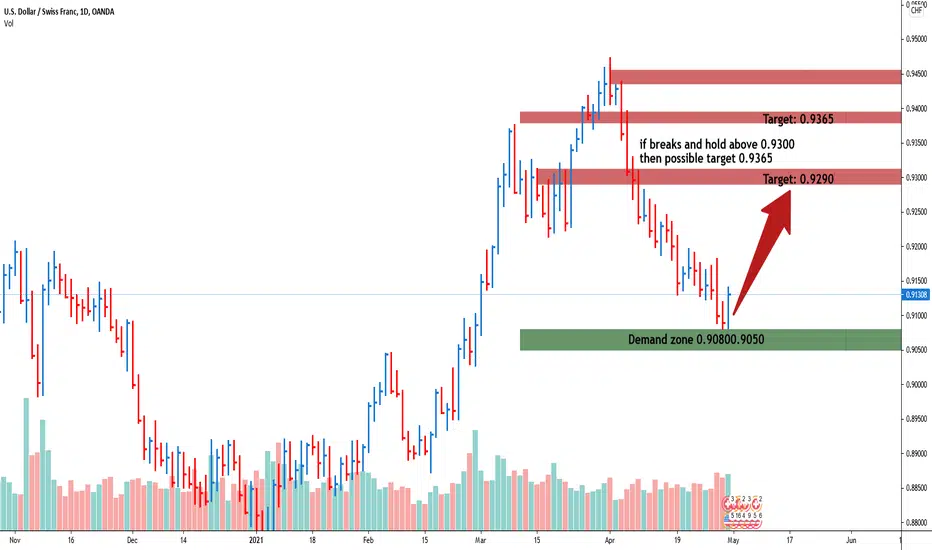
USDCHF two bar reversal setup initial target 0.9290 & 0.9365two bar reversal setup formed by friday bar closing. divide risk into two position, one from current level, second by 0.9080 if price retrace down. target 0.9290 & 0.9365
USDCHF: very nice R:R intraday tradeHi Traders,
This is my view on this pair for the next few days.
#USDCHF
SELL 0.912
SL 0.9144
TP 8.898
I remind you that this is only a forecast based on what current data are.
Therefore the following signal will be activated only if specific rules are strictly respected.
If you follow my strategy you will be able to identify the right filters and triggers to enter correctly the market and avoid fake signals.
I really hope you liked this video and I would like to know what do you think about this analysis, so please use the comment section below this video to give me your point of view.
Thank You
———————————
Pietro from Trading Kitchen

