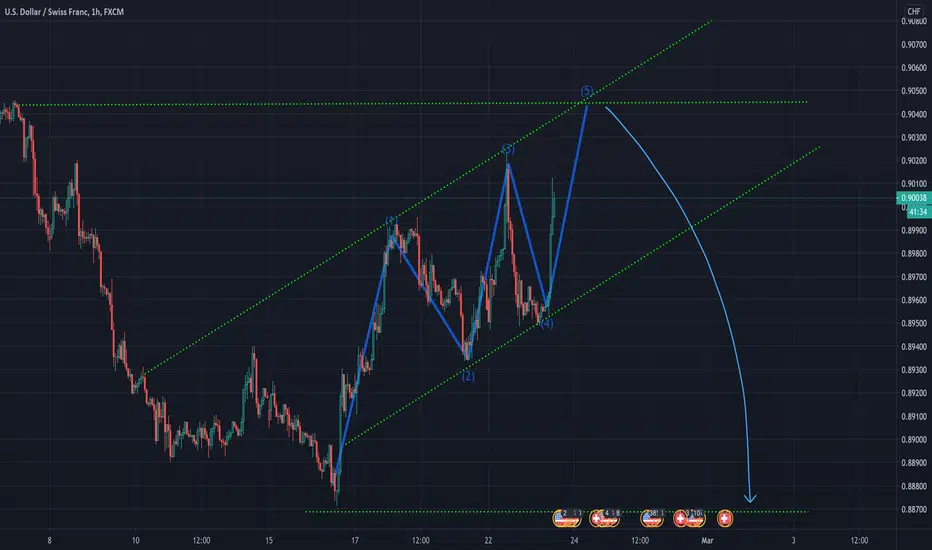
USDCHF potential to drop down Hello traders, this is my idea on UC, lets wait and see how it's going to move.
Usdchfidea

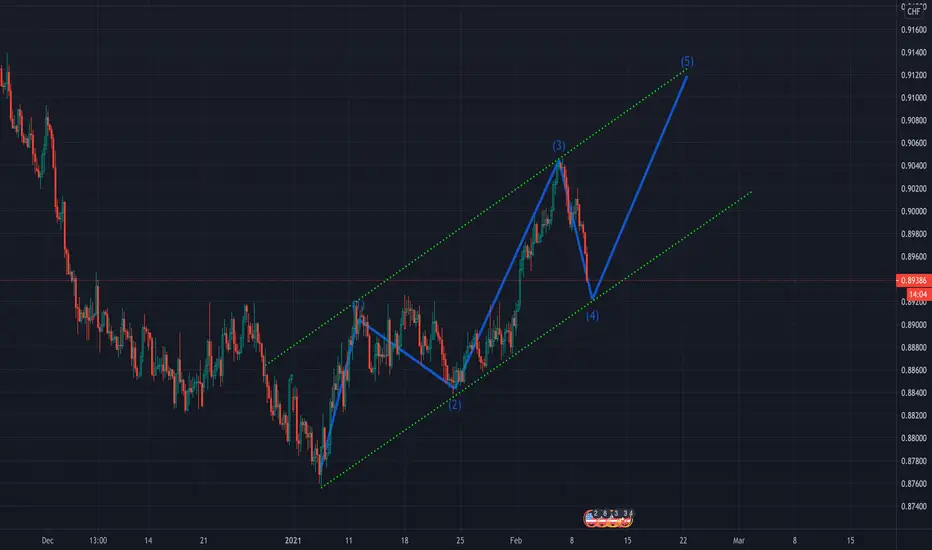
USD/CHF Broken Resistance, Now Testing As SupportThis broke above resistance and is now retracing to test it as support. Looking for a long entry between 0.382 and 0.5 Fibonacci, can use 1HR timeframe with MACD to more accurately pinpoint when this turns higher.
Above there is a big resistance level so I am setting the TP at the bottom of this at 0.91833 and SL is just below 0.786 Fib


SELL SELL SELLHello Team, price has reached supply with a great risk to reward ratio shorts shall be our bias. price created an ascending channel. kindly leave a comment

USD/CHF SELL IDEAHey tradomaniacs,
welcome to another free trading-setup.
Notice: This is meant to be a preparation for you! As always we will have to wait for a confirmation!
USD/CHF: Daytrade-Preparation
Market-Sell: 0,90730
Stop-Loss: 0,91020
Point of Risk-Reduction: 0,90430
Take-Profit: 0,89845
Stop-Loss: 30 pips
Risk: 0,5% - 1%
Risk-Reward: 3,0
LEAVE A LIKE AND A COMMENT - I appreciate every support! =)
Peace and good trades
Irasor
Wanna see more? Don`t forget to follow me

USDCHF sales from the level of the main target 0.88770USDCHF sales from the level of the main target 0.88770
❤️ If you find this helpful and want more FREE forecasts in TradingView
. . . . . Please show your support back,
. . . . . . . . Hit the 👍 LIKE button,
. . . . . . . . . . . Drop some feedback below in the comment!
❤️ Your Support is very much 🙏 appreciated!❤️
💎 Want us to help you become a better Forex trader?
Now, It's your turn!
Be sure to leave a comment let us know how do you see this opportunity and forecast.
USDCHF ANALYSIS 22 - 26 FEBANALYSIS
==========
DAILY - BULLISH
4HR - BULLISH
PLAN OF ACTION
================
IM EXPECTING PRICE TO COME RETEST 0.84 MINOR ZONE ON 4HR THEN WE TAKE BUYS IN LINE WITH THE HIGHER TIME FRAME INDICATION
BUYS:
ENTRY @ O.84 ZONE
EXIT AT 0.904
SL BELOW THE 0.84 ZONE
IF NOT THEN PRICE WILL BREAK THE 0.84 ZONE AND WE PUSH DOWN THUS TAKING SELLS

USDCHF could drop if we confirm the patternUSDCHF is performing a perfect short-term rebound and the resistances are confirmed, we could open a short position. Wait for the confirmation.

USDCHF:-I WILL BUY HEREHello traders and investors,
Welcome to technical analysis of USDCHF.
if you like this analysis please like and comment below, it will support creating more analysis for you.
USDCHF is near 0.86485 which is historically important price level , price rejected at this level many times.
so same expectations this time also, watch price action at support.
i will wait for bullish setup here ,
once trend line break i will enter long.

USDCHF - Mark UpPlease view the chart for a breakdown of my analysis on this pair. If you have any questions, please be sure to leave a comment below.

USD/CHF SELL IDEAHey tradomaniacs,
welcome to another free trading-setup!
Notice: Waiting for US-Data! Just an idea in case of dollar weakness!
USD/CHF: Daytrade-Preparation
Market-Sell: 0,89650
Stop-Loss: 0,90020
Point of Risk-Reduction: 0,89190
Take-Profit: 0,88715
Stop-Loss: 37 pips
Risk: 0,5% - 1%
Risk-Reward: 2,5
LEAVE A LIKE AND A COMMENT - I appreciate every support! =)
Peace and good trades
Irasor
Wanna see more? Don`t forget to follow me

USD/CHF - BUY TRADE SETUP#USDCHF - Possible Buy Trade setup.
Use Max (0.5% or 1%) Risk / Trade.
What Do You Think About This?
Please Comment below OR Share Your IDEA.

USD/CHF SELL IDEAHey tradomaniacs,
welcome to another free trading-setup.
Notice: This is meant to be a preparation for you! As always we will have to wait for a confirmatio!
USD/CHF: Day-Swingtrade-Preparation
Notice: Only for those with a higher risk-aversion! market is very choppy ahead the news!
Market-Sell: 0,89180
Stop-Loss: 0,89700
Point of Risk-Reduction: 0,88720
Take-Profit: 0,87750
Stop-Loss: 52 pips
Risk: 0,5% - 1%
Risk-Reward: 2,70
LEAVE A LIKE AND A COMMENT - I appreciate every support! =)
Peace and good trades
Irasor
Wanna see more? Don`t forget to follow me

USD/CHF - BUY - TRADE SETUPUSDCHF - Looks Like Bullish Trend Started.
Head and Shoulder Pattern Neckline also broke.
Entry is On Retest Level. Wait for Confirmation Candle.
What Do You Think About This?
Please Comment below & LIKE to Support us.
If you want Chart Analysis for any Currency Pair or Instrument.
Kindly mentioned in the comment section. All the Best !!

USD/CHF Short After RetraceLooking to short this since it has made a retrace back to 0.5 Fibonacci. For safer entry wait for EMA's to cut for short and MACD to remain below 0 which would confirm this is staying bearish.
Target is the low of support at 0.88389
SL is set just above 0.618 Fib around 0.89800 area

USDCHF Sell on H4USDCHF, Sell on H4.
- Daily: Downtrend
- H4: Downtrend
- H1: Break, below and confirmation
- Below EMA20
=> Sell
Target 0.877


UsdChf Long!UsdChf is forming a clear break and retest along with a head and shoulders forming at the bottom of the trend. Spotting clear Bullish Divergence to really help this one take off. Use proper risk management as always. If this stop loss hits ill enter one more time closer to the bottom of the retest structure for good risk to reward ratio.


USDCHF Short (Sell) Trade SetupPrice has now broken out from a strong resistance level and is rallying into a fairly strong supply zone. There may be an opportunity to short USDCHF from this level, with targets to retest the breakout (resistance, turned support).

USDCHF Retest potential ?I think we may have a solid USDCHF Bullish trend incoming after a retest of the key level on my chart. Would love to know what you guys think.

DON'T MISS THE OPPORTUNITY ON USD / CHF !!USD / CHF is in a very nice bearish channel with some nice touchpoints. Price should stop in the resistance trace at 1.903, after that we will aim for a sell on the top of the channel, targeting the bottom of the channel Ratio / Risk of 2.82%.
Follow me for more analysis!
