Liquidity Grab Complete? Why USDCHF Could Be Heading South📉 USDCHF remains firmly in a downtrend on both the weekly (1W) and daily (1D) timeframes. The recent bullish retracement is now confronting a critical resistance zone 🔒 — defined by a descending trendline and a daily order block between 0.8150–0.8200.
🧱 Price action at this level shows clear signs of rejection, aligning with a bear flag formation, which could pave the way for continued downside toward the 0.7800–0.7600 region.
📊 Fundamentally, the Swiss Franc (CHF) continues to gain strength, supported by Switzerland’s stable economic outlook and ongoing safe-haven demand. Meanwhile, the US Dollar faces headwinds from dovish Fed expectations and rising political uncertainty in the US 🇺🇸.
🔮 From a Wyckoff/ICT perspective, this upward move appears to be a liquidity grab into a premium zone, with smart money likely distributing positions before initiating a new markdown phase. A sell bias is favored below 0.8200, with downside targets set at 0.8000 and beyond.
📅 Keep a close eye on this week’s US NFP and Swiss CPI releases — both could inject fresh volatility into the pair.
Usdchfshort

Is USDCHF Ready to Drop? Short Setup Explained📉 USDCHF Trade Idea Breakdown
Taking a close look at USDCHF, we’re currently in a clear downtrend 🔻. Price is under pressure on the higher timeframes, but on the lower timeframes (15m & 30m), we’re seeing a pullback 🌀.
What I’m watching for now is a rejection at resistance 🔄 followed by a bearish break in market structure ⛔️. If that confirms, I’ll be looking to take a short entry with targets set at the two previous lows marked out in the video 🎯📉.
Stop loss placement would be just above the recent swing high for risk management 🛑.
As always — this is not financial advice ⚠️.

USD/CHF - Bearish Flag (24.07.2025)Fundamental Updates :
Dollar falls - New Trade agreement and uncertainties in Market :
President Donald Trump announced a trade deal on Tuesday with Japan, which lowers tariffs on auto imports to 15% in exchange for a $550 billion package of U.S.-bound investment and loans.
The USD/CHF Pair on the M30 timeframe presents a Potential Selling Opportunity due to a recent Formation of a Bearish Flag Pattern. This suggests a shift in momentum towards the downside in the coming hours.
Possible Short Trade:
Entry: Consider Entering A Short Position around Trendline Of The Pattern.
Target Levels:
1st Support – 0.7878
2nd Support – 0.7855
🎁 Please hit the like button and
🎁 Leave a comment to support for My Post !
Your likes and comments are incredibly motivating and will encourage me to share more analysis with you.
Best Regards, KABHI_TA_TRADING
Thank you.
Disclosure: I am part of Trade Nation's Influencer program and receive a monthly fee for using their TradingView charts in my analysis.

USD/CHF - Bearish Flag (24.07.2025)The USD/CHF Pair on the M30 timeframe presents a Potential Selling Opportunity due to a recent Formation of a Bearish Flag Pattern. This suggests a shift in momentum towards the downside in the coming hours.
Possible Short Trade:
Entry: Consider Entering A Short Position around Trendline Of The Pattern.
Target Levels:
1st Support – 0.7878
2nd Support – 0.7855
🎁 Please hit the like button and
🎁 Leave a comment to support for My Post !
Your likes and comments are incredibly motivating and will encourage me to share more analysis with you.
Best Regards, KABHI_TA_TRADING
Thank you.
Disclosure: I am part of Trade Nation's Influencer program and receive a monthly fee for using their TradingView charts in my analysis.

USDCHF – Two Levels, One PlanWe’re watching two key resistance zones for a potential short.
If the first level holds and gives a signal, we’ll short from there.
If that level breaks, we may switch to a short-term buy up to the next level.
Once price reaches the second resistance, we’ll be ready for another sell opportunity.
No predictions — just following the flow.

SHORT ON USD/CHFUSD/CHF has given a nice head and shoulders pattern on the 2hr timeframe.
I expect price to sweep sell side liquidity below the uptrend line and tap into the next level of support.
Looking to catch over 132 pips to the downside.

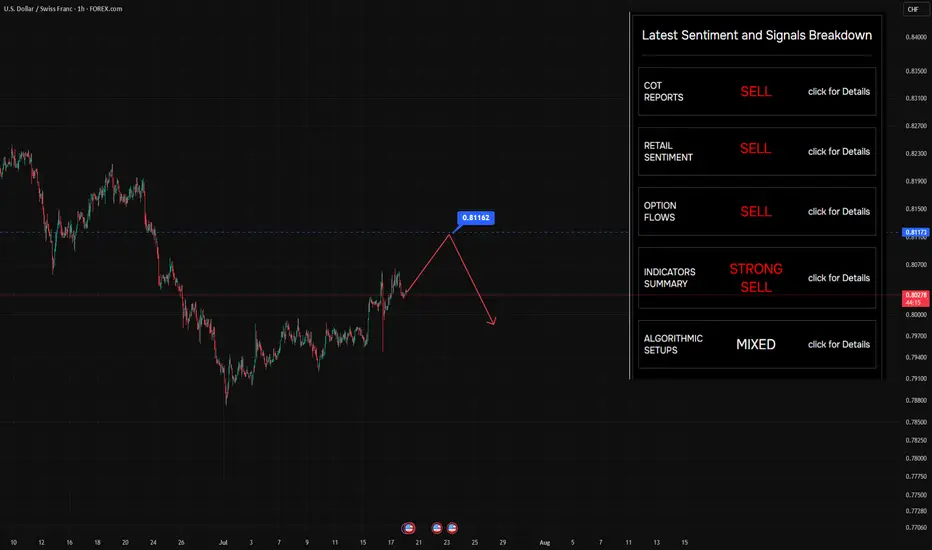
Still looking to sell on rallies — nothing’s changedStill looking to sell on rallies — nothing’s changed. The level on the chart? That’s where buyers jumped in before. Makes sense to target it again.
So… why do we say there are "suffering buyers" at this level?
Let’s rewind a bit (see Chart #2) and imagine price at the point marked on the chart.
At that moment, price had clearly returned to a visible local level — 0.8123 — a zone that naturally attracted traders to jump in on the fly , or triggered limit orders .
But here’s what happened next:
Selling pressure overpowered buying interest — and price moved swiftly lower .
That’s when those buyers got caught.
That’s when the pain started.
🔍 What Makes This Level Special?
Broker data from open sources confirms that open positions are still sitting at this level — meaning a lot of traders are underwater, hoping for a recovery that may never come.
It’s not just technical structure.
It’s crowded sentiment , failed expectations , and trapped capital — all wrapped into one.
🧠 This is what we call a "suffering trader" zone — and it often becomes a magnet for future selling .
📌 Follow along for more breakdowns on flow, positioning, and market sentiment .
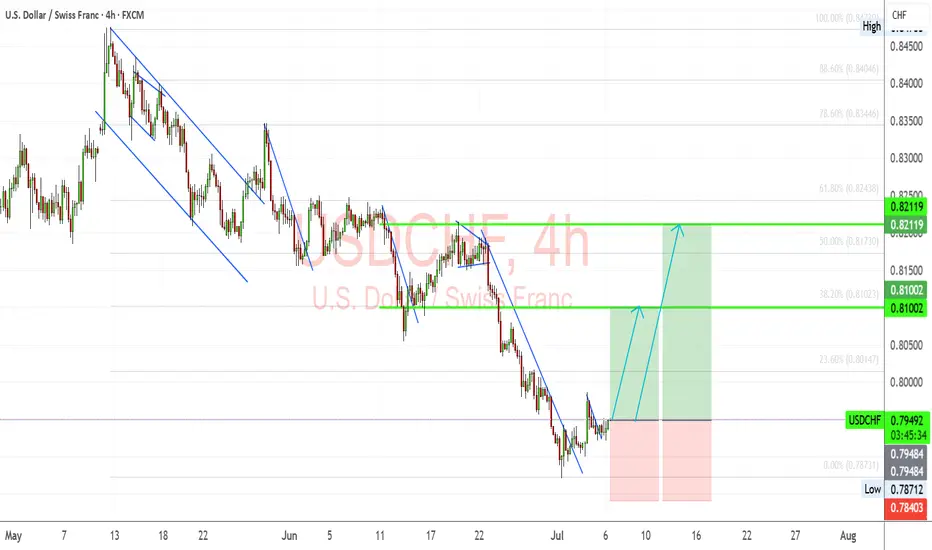
USDCHF – Reversal Setup Building Above 0.79 SupportUSDCHF has broken out of its steep downward channel and is now forming a potential bullish reversal base above the key support zone at 0.7940–0.7870. Price action suggests momentum could be shifting in favor of the bulls, with upside targets sitting at 0.8100 (Fibonacci 38.2%) and 0.8210 (previous resistance and 61.8% retracement).
🔍 Technical Structure:
Clean descending channel now broken.
Price holding above May–June lows, forming a potential higher low.
First target: 0.8100 zone.
Final target: 0.8210 resistance.
Stop: Below 0.7870 structure low.
🧠 Fundamentals:
USD Outlook: Bullish tilt as Fed members push back against early cuts. Markets eye July 11 CPI, which could confirm inflation stickiness and reinforce USD strength.
CHF Outlook: Weak bias, as the SNB has turned more dovish. With safe-haven demand easing and growth outlook softening, CHF is losing favor across the board.
Global sentiment: Risk appetite improving as geopolitical concerns (e.g., Strait of Hormuz, Iran) temporarily ease—removing upward pressure on CHF.
⚠️ Risk Factors:
A surprise drop in U.S. CPI this week could shift USDCHF sharply lower.
Renewed geopolitical tensions may revive CHF demand suddenly.
Fed speak and yields must remain supportive for this structure to play out.
🔁 Asset Dynamics:
USDCHF tends to lag behind DXY and USDJPY. Watch those pairs for confirmation. It can also follow moves in US10Y yields and react inversely to Gold volatility (safe-haven flow shifts).
✅ Trade Bias: Bullish
TP1: 0.8100
TP2: 0.8210
SL: Below 0.7870
Event to Watch: 🇺🇸 U.S. CPI – July 11
📌 If CPI confirms sticky inflation, USDCHF could rally toward the upper retracement zones quickly. Watch for confirmation candles near breakout.
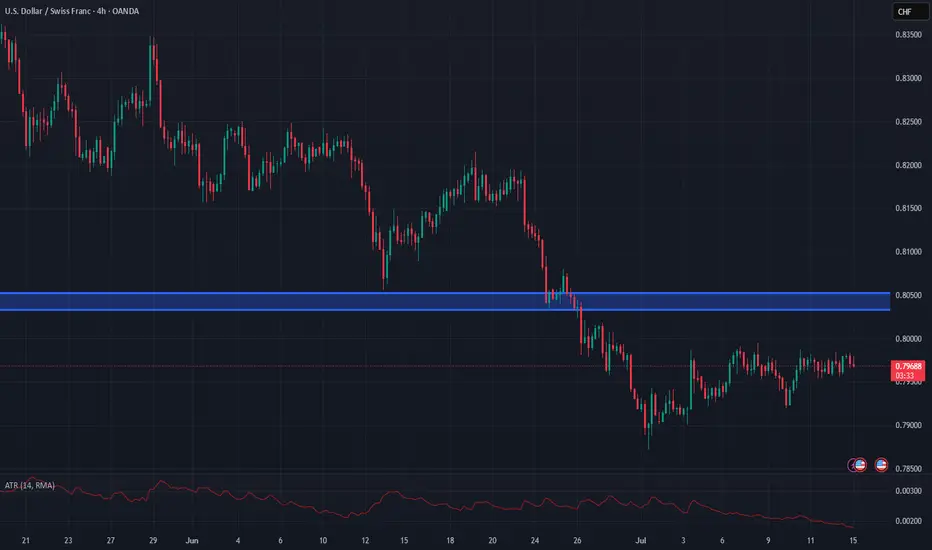
USD weakness has potential shorts on USDCHFUSD continues to show overall weakness ahead of CPI figures later today
Retests of the breakdown area on USDCHF at 0.8033-0.8048 can act as resistance on any retests
Stops should be above 0.8058
Targets can be back towards 0.7990
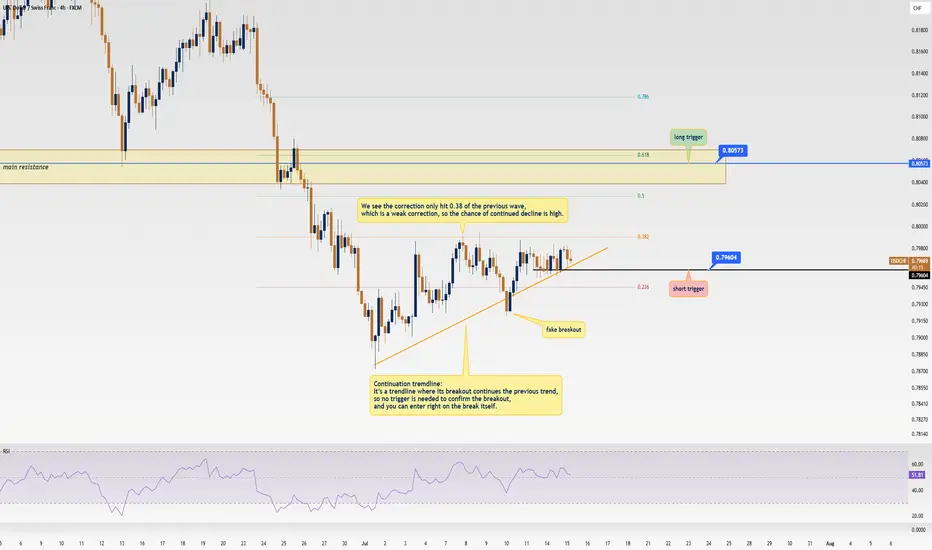
USD/CHF Update: Killer Short Trigger Ready to Pop!Welcome back, traders, it’s Skeptic from Skeptic Lab! 😎 We’ve got a juicy short trigger on USD/CHF that could deliver serious profits if it fires. Stay with me till the end to nail this trade! Let’s dive into the Daily and 4-hour timeframes for the full picture. Currently at $0.79671, here’s the play:
✔️ Daily Timeframe:
We’re in a rock-solid bearish major trend . After hitting a high of $ 0.84649 , we broke the key support at $ 0.80573 , resuming the bearish trend. A pullback to the broken $ 0.80573 level is likely, as it aligns with the 0.6 Fibonacci retracement from the prior 4-hour wave. Trading with the trend is smartest, so shorts are the focus. If you want to long, go with lower risk and close positions faster.
📊 4-Hour Timeframe (Futures Triggers):
Short Trigger: Two options here. Either enter on a trendline break (no extra trigger needed, as continuation trendlines mean the prior trend resumes on a break), or, for a safer play, short on a break of support at $ 0.79604 —this needs minimal confirmation.
Long Trigger: Wait for a break of the resistance zone at $ 0.80573 . Confirm with RSI entering overbought. Check my RSI guide ( link ) for how I use it differently—game-changing stuff!
📉 Key Insight: Stick to the bearish trend for higher-probability trades. Shorts at $0.79604 or on a trendline break are your best bet.
🔔Risk management is your lifeline—cap risk at max 1%–2% per trade to stay in the game.
I’ll catch you in the next analysis—good luck, fam! <3
💬 Let’s Talk!
Which USD/CHF trigger are you locked on? Hit the comments, and let’s crush it together! 😊 If this update lit your fire, smash that boost—it fuels my mission! ✌️
USDCHF continues bullish recovery. Opportunity for BUY signal✏️#USDCHF is showing bullish recovery. The price is trading in a triangle pattern in the recovery phase. The 1.79500 area is an important support zone that is driving the pair's upside. 0.80700 is the immediate Target for a BUY signal.
📈Key Level
SUPPORT 0.79500
RESISTANCE 0.80700
BUY now at support 0.79500
Target: 0.80700
SELL Trigger: Break support 0.79500
Leave your comments on the idea. I am happy to read your views.

Setupsfx_ | USDCHF: A Big Major Swing Sell In Making 760+ Pips The USDCHF pair has dropped significantly since our last update. We anticipate another drop before price may reverse. DXY is also dropping and may continue to decline. There’s a major swing target that will take time to complete successfully. Use risk management according to your own risk tolerance.
Thank you for your continued support!
Team Setupsfx_

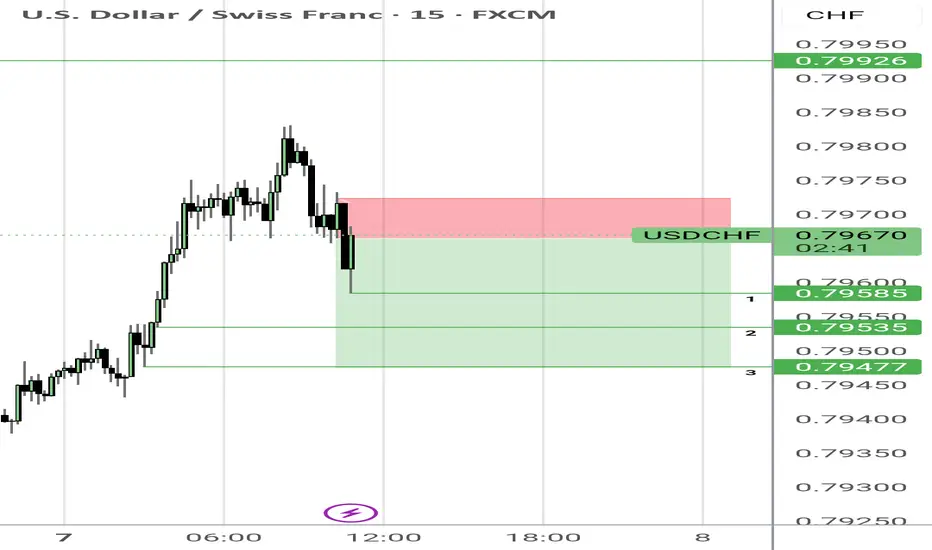
Usdchf short scalp Short scalp as continuation from previous trade idea. Simulation #3 with 3 targets... Success assessment when only one successful target reached.
#USDCHF: Will USD Breakthrough The Strong Bearish Downtrend? The USDCHF currency pair has experienced significant volatility due to the ongoing trade dispute between the United States and China, which has led to a substantial decline in the DXY index. Consequently, CHF and JPY have emerged as the most stable currencies in the market.
Despite the USDCHF currency pair reversing its bullish trend, we anticipate a potential reversal back to a bearish position. We believe this reversal may be a temporary trap, and the currency pair is likely to regain its bullish position in the future.
There are two potential areas where the USDCHF currency pair could reverse from its current trend. The first area is relatively early, and if the USDCHF currency pair crosses a specific region, we may have a second safe option that could provide greater stability.
We extend our best wishes and best of luck in your trading endeavours. Your unwavering support is greatly appreciated.
If you wish to contribute, here are several ways you can assist us:
- Like our ideas
- Comment on our ideas
- Share our ideas
Team Setupsfx_🚀❤️

USDCHF: DXY Likely to remain bearish in long term! The USDCHF pair is likely to remain bearish in the coming days as DXY doesn’t show any bullish momentum. However, we expect DXY to be bullish in the short term, which will help the price reach our designated selling zone. Once the price reaches this zone and shows a reversal sign in a smaller timeframe, you can consider entering or taking any decision.
If you’d like to contribute, here are a few ways you can help us:
- Like our ideas
- Comment on our ideas
- Share our ideas
Team Setupsfx_🚀❤️

Usdchf short idea after reversalAn update of previous idea. I see this one in reversal mode.
Likely marker maker sell model playing out now.

How to Trade USDCHF 's Downtrend with Precision📉 Market Breakdown: USDCHF Under Pressure
Currently keeping a close watch on USDCHF 💵🇨🇭 — the pair has been in a strong, sustained bearish trend 🔻, and the overall pressure remains clearly to the downside.
My bias is firmly bearish 📊, but I’m not rushing in. Instead, I’m patiently waiting for an optimal entry 🎯 — one that offers the right balance of confluence, structure, and reduced risk 🧠🛡️.
🎥 In today’s video, we dive into:
✅ Market structure
✅ Price action
✅ The prevailing trend
✅ Entry zones with minimized risk
I also walk you through my personal entry strategy and trading plan 📋, it's not just an idea drop.
📌 Disclaimer: This is not financial advice — the content is for educational purposes only.

USDCHF..SHORT📌 USDCHF – Multi-Scenario Setup
This pair has two key levels: one short-term, the other long-term.
If price reaches the first level and shows solid bearish reaction, I’ll enter a short.
If that level breaks and confirms, I’ll go long—but manage the long aggressively, since I’ll look to exit around the higher level.
If the price pushes beyond even the second zone, I’ll be ready to buy again.
❗️I’m never upset by a loss or a broken level.
The market leads—I follow.
Claiming “it must drop from here” or “it has to rise” is wishful thinking, not trading.
✅ Stay calm, stay flexible, and stay prepared for every scenario.

USDCHF Analysis – "Dollar Trying to Break Free from Downtrend"USDCHF is breaking out from a multi-week descending channel.
Structure shows a potential trend reversal from the June 12th low.
First bullish leg may target the 23.6% Fib level at 0.8266, followed by an extended move toward 0.8355.
Key resistance: 0.8266 and 0.8355 (Fib levels)
Stop loss: around 0.8093–0.8056 zone (previous support and breakout base)
Structure Bias: Bullish breakout after prolonged downtrend – confirmation depends on sustained move above 0.8200
📊 Current Bias: Cautiously Bullish
🧩 Key Fundamentals Driving USDCHF
USD Side (Mildly Bearish to Neutral):
FOMC held rates, Dot Plot showed only one cut expected for 2025, but Powell’s tone was less hawkish.
US Retail Sales soft, and PPI/CPI showed signs of inflation cooling.
Recent risk-off sentiment (Middle East, oil spikes, equity volatility) supports the USD.
Trump commentary and 2025 election anticipation bring long-term uncertainty.
CHF Side (Strong but potentially weakening):
SNB held rates steady, with cautious tone—no urgency to hike again.
Safe-haven flows still support CHF, but waning inflation and stronger global equity market might reduce CHF appeal.
SNB has hinted at FX intervention readiness, which could weaken CHF if necessary.
⚠️ Risks That May Reverse or Accelerate Trend
False breakout risk if 0.82 fails to hold → deeper pullback toward 0.8090
Stronger CHF demand on geopolitical fear (Israel–Iran, Ukraine)
Unexpectedly weak US data this week or renewed Fed dovish talk
🗓️ Important News to Watch
US: Core PCE, GDP revision (June 27), jobless claims
CHF: Swiss CPI, SNB FX intervention chatter
Risk sentiment: Iran/Israel tensions, equity volatility, Trump Fed commentary
🏁 Which Asset Might Lead the Broader Move?
USDCHF could mirror sentiment across CHF pairs—if risk-on resumes and CHF weakens across the board (EURCHF, NZDCHF also rallying), USDCHF may accelerate higher.

Swissy Heist: USD/CHF Bearish Breakout Blueprint🚨 Swissy Heist Alert: USD/CHF Bearish Breakout Plan for Swing/Day Traders 🌐💸
Hello, Wealth Chasers and Market Mavericks! 👋😎
Welcome to the Thief Trading Strategy, a cunning blend of technical precision and fundamental insight to conquer the USD/CHF Forex market. This is your blueprint to pull off a masterful heist on "The Swissy." Follow the plan, target the high-reward Green Zone, and navigate the traps where bullish players lurk. Let’s grab those pips and treat ourselves to the spoils! 💰🎯
📈 Trade Blueprint: USD/CHF Setup
Market: USD/CHF (Forex) 🌍
Bias: Bearish Breakout 📉
Timeframe: 4H (Swing/Day Trade) ⏰
Entry Plan 📊:
Breakout Strategy: Wait for a confirmed break below the Neutral Zone at 0.81800. Set Sell Stop orders just below 0.81800 to surf the bearish momentum. 🚀
Pullback Strategy: For safer entries, place Sell Limit orders at the nearest 15M/30M swing high (e.g., 0.82100–0.82300) after a support break. 📍
Pro Tip: Activate a price alert at 0.81800 to catch the breakout live! 🔔
Stop Loss 🛑:
📍 Set your Stop Loss above the nearest 4H swing high (e.g., 0.82750) for swing/day trades.
📍 Adjust SL based on your risk tolerance, lot size, and number of open positions.
Target 🎯: Aim for 0.80700 or exit early to secure profits.
💡 Why the Bearish Bias?
The USD/CHF is showing strong bearish momentum, fueled by technical patterns and fundamental drivers. Key factors include:
Technicals: Recent support at 0.81931–0.82120 held briefly but failed to sustain bullish momentum, reinforcing a bearish tilt below key moving averages (100/200-hour MAs).
Fundamentals: Safe-haven demand for the Swiss Franc persists amid global uncertainties, with bearish patterns like an inverse cup and handle signaling further downside. For a deeper dive, check fundamental reports, COT data, sentiment analysis, and intermarket trends via Linkks🔗
⚠️ Volatility Warning: News Impact 📰
News releases can spike volatility and disrupt price action. To protect your trades:
Avoid opening new positions during major news events.
Use trailing stops to lock in gains and shield running positions.
💪 Join the Heist!
Support this Thief Trading Strategy by smashing the Boost Button! 🚀 Let’s strengthen our crew and make pips effortlessly. With this plan, you’re equipped to navigate the USD/CHF market like a pro. Stay sharp, and I’ll be back with the next heist plan soon! 🐱👤💸
Happy trading, and let’s steal those profits! 😎🎉

USDCHF H4 AnalysisUSDCHF Showing a Bearish Flag. If it breaks this zone above, Most probably can fly up to 0.82512 and higher to 0.83491. If no, Can rally between 0.80552 or even lower. Trading Analysis from 23-06-25 to 27-06-25. Take your risk under control and wait for market to break support or resistance on smaller time frame. Best of luck everyone and happy trading.🤗

USDCHF LONG FORECAST Q2 W24 D11 Y25👀 USDCHF LONG FORECAST Q2 W24 D11 Y25
🔥HOT PICK ALERT 🔥
Professional Risk Managers👋
Welcome back to another FRGNT chart update📈
Diving into some Forex setups using predominantly higher time frame order blocks alongside intraday confirmation & breaks of structure.
Let’s see what price action is telling us today! 🔥
💡Here are some trade confluences📝
✅Weekly order block rejection
✅Daily order block rejection
✅15’ order block
✅Intraday bullish breaks of structure
🔑 Remember, to participate in trading comes always with a degree of risk, therefore as professional risk managers it remains vital that we stick to our risk management plan as well as our trading strategies.
📈The rest, we leave to the balance of probabilities.
💡Fail to plan. Plan to fail.
🏆It has always been that simple.
❤️Good luck with your trading journey, I shall see you at the very top.
🎯Trade consistent, FRGNT X

USD/CHF 1-Hour Timeframe – Short Position Setup
Entry Point: Consider initiating a short position slightly above 0.82224.
Stop-Loss: Place at 0.82548 to limit potential losses.
Break-Even Adjustment: Move stop-loss to break-even once the price tests 0.81936.
Target Levels:
Primary Target: A breakdown toward the 0.81598–0.81558 zone.
Secondary Target: A potential retest of 0.80947.
Important Note:
Avoid entering a short position if the price rises above 0.82489, as this may signal bullish momentum.
Tags: OANDA:USDCHF
