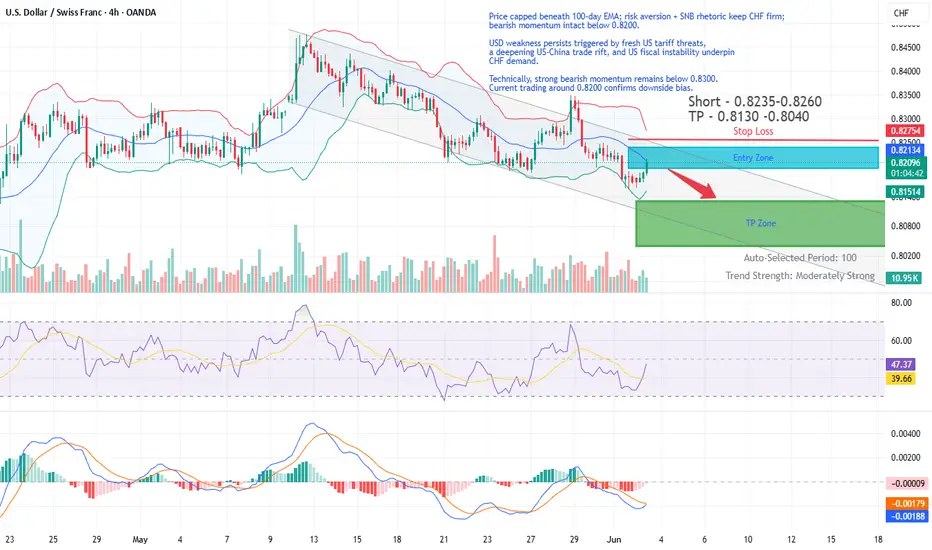
USD/CHF Short Trade Idea - UpdatedPrice capped beneath 100-day EMA; risk aversion + SNB rhetoric keep CHF firm; bearish momentum intact below 0.8200.
USD weakness persists triggered by fresh US tariff threats,
a deepening US-China trade rift, and US fiscal instability underpin
CHF demand.
Technically, strong bearish momentum remains below 0.8300.
Current trading around 0.8200 confirms downside bias.
Usdchfshort
USD/CHF Short Trade IdeaUSD/CHF Short Trade Idea
Renewed USD weakness triggered by fresh US tariff threats, a deepening US-China trade rift, and US fiscal instability underpin CHF demand. Technically, strong bearish momentum remains below 0.8300. Current trading around 0.8180 confirms downside bias.
USD/CHF (Short):
With the USD under persistent pressure from tariff-related uncertainties and deteriorating US-China relations, safe-haven demand for CHF remains elevated. Technical analysis confirms a bearish bias below key resistance at 0.8300. Selling rallies towards 0.8210–0.8240 provides an attractive risk-reward profile targeting recent lows at 0.8100, and potentially extending to the year-to-date trough around 0.8035.

USDCHF - is a collapse coming soon?My chart shows exactly what I am seeing and anticipating.
What about you? What is your opinion?
Please comment.

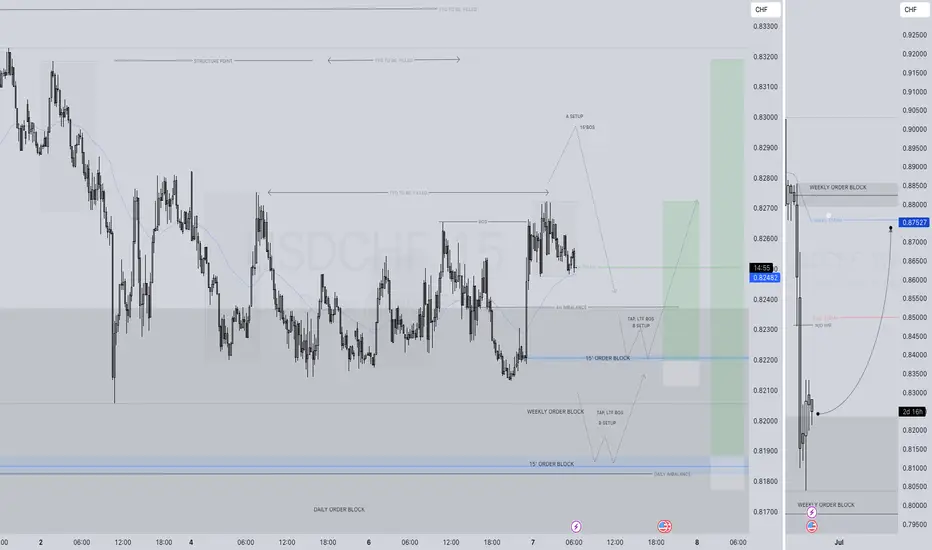
USDCHF LONG FORECAST Q2 W22 D26 Y15👀 USDCHF LONG FORECAST Q2 W22 D26 Y25
Professional Risk Managers👋
Welcome back to another FRGNT chart update📈
Diving into some Forex setups using predominantly higher time frame order blocks alongside intraday confirmation & breaks of structure.
Let’s see what price action is telling us today! 🔥
💡Here are some trade confluences📝
✅Weekly order block rejection
✅Daily order block rejection
✅15’ order block
✅Intraday bullish breaks of structure
🔑 Remember, to participate in trading comes always with a degree of risk, therefore as professional risk managers it remains vital that we stick to our risk management plan as well as our trading strategies.
📈The rest, we leave to the balance of probabilities.
💡Fail to plan. Plan to fail.
🏆It has always been that simple.
❤️Good luck with your trading journey, I shall see you at the very top.
🎯Trade consistent, FRGNT X

Skeptic | USD/CHF Analysis: Short Setups Ready to Pop!Hey everyone, Skeptic here! Let’s kick off the week with a sharp USD/CHF analysis, a pair that’s flashing some juicy short opportunities! 📉 Stick around as I break down why this could be a prime setup. Let’s dive in with the Daily Timeframe. 📊
Daily Timeframe: The Big Picture
USD/CHF has been rocking a major bullish trend, but in recent weeks, it’s slipped into a secondary corrective trend, pulling back to the 0.382 Fibonacci retracement level. This tells us the bullish momentum is still alive and kicking. The last candle, closed on May 12, was a full bearish engulfing pattern, showing that despite the correction, buyer strength is weak, and sellers are taking over. Because of this, if our short triggers activate, we could ride the continuation of the major bullish trend (likely a typo in the original, as the context suggests a bearish move for shorts) and target levels at 0.81904 and 0.80865 . If 0.80865 breaks, per Dow Theory, the major bullish trend officially resumes, and we can open shorts with more confidence and higher risk. With this big-picture view, let’s zoom into the 4-Hour Timeframe to find our long and short triggers.
4-Hour Timeframe: Long & Short Setups
For our short setup, the main trigger is a break below the support at 0.83264 . As you can see, we’ve reacted to this support twice, but each time, we formed lower highs, signaling this support is getting weaker and weaker. This makes a break more likely. You could place a stop sell below this level, but personally, I wait for a breakout candle on the 15-minute timeframe to confirm. For a long setup, I’m not opening longs until we consolidate above 0.83902 and see uptrend momentum return. The risk of hitting a stop loss is too high otherwise, and since we’d be trading against the main trend, sudden reversals are likely, giving us a lower R/R. 😎
💬 Let’s Talk!
If this analysis helped you out, give it a quick boost—it means a lot! 😊 Got a pair or setup you want me to tackle next? Drop it in the comments, and I’ll get to it. Thanks for hanging out, and I’ll see you in the next one. Keep trading smart! ✌️

USDCHF looks ready to resume the downtrend .the week of 19 May The area between 0.8434 and 0.8330 has been a strong support all year but got broken to the downside on 10 April. Since then, this pair gave several day trades as it pulled back to the zone (see my previous posts). As my daily chart shows, the recent retracement helped price to catch up to the 50ema and is now nicely below it.
I will be monitoring price action also on H4 to confirm if my analysis is correct and act if appropriate. We could be looking at a trade with +350 pips potential in uncertain times (due to unconventional Trumpeconomics) so I would be prepared for large swings and the need to hold the trade for extended time periods.
This is not a trade recommendation; it’s merely my own analysis. Trading carries a high level of risk so carefully managing your capital and risk is important. If you like my idea, please give a “boost” and follow me to get even more.
It’s not whether you are right or wrong, but how much money you make when you are right and how much you lose when you are wrong – George Soros

USDCHF looking to fly higher and higherHello Guys,
A recent bullish shift in USDCHF has been monitored and we are in good levels to go long and TARGET 0.8585 level.
as long as we are above 0.8250 level bias is bullish.
Regards
Rizwan Ali

USDCHF Analysis: Break & Retest or Mean Reversion?Hello traders!
USDCHF is offering two trading scenarios on the daily timeframe.
The first scenario suggests the pair may react bearishly from the resistance zone, setting up a break-and-retest opportunity that could drive price lower toward the 0.80001 area.
The second scenario anticipates a bounce toward the 0.89100 region, where a mean reversion setup may come into play (if sellers step in and price action confirms bearish intent near that resistance).
Discretionary Trading: Where Experience Becomes the Edge
Discretionary trading is all about making decisions based on what you see, what you feel, and what you've learned through experience. Unlike systematic strategies that rely on fixed rules or algorithms, discretionary traders use their judgment to read the market in real time. It's a skill that can't be rushed, because it's built on screen time, pattern recognition, and the ability to stay calm under pressure.
There's no shortcut here. You need to see enough market conditions, wins, and losses to build that intuition—the kind that tells you when to pull the trigger or sit on your hands. Charts might look the same, but context changes everything, and that's something only experience can teach you.
At the end of the day, discretionary trading is an art, refined over time, sharpened through mistakes, and driven by instinct. It's not for everyone, but for those who've put in the work, it can be a powerful way to trade.

USDCHF LONG FORECAST Q2 W19 D7 Y25USDCHF LONG FORECAST Q2 W19 D7 Y25
Professional Risk Managers👋
Welcome back to another FRGNT chart update📈
Diving into some Forex setups using predominantly higher time frame order blocks alongside confirmation breaks of structure.
Let’s see what price action is telling us today!
💡Here are some trade confluences📝
✅Weekly order block rejection
✅Daily order block rejection
✅15’ order block
✅Intraday bullish breaks of structure
🔑 Remember, to participate in trading comes always with a degree of risk, therefore as professional risk managers it remains vital that we stick to our risk management plan as well as our trading strategies.
📈The rest, we leave to the balance of probabilities.
💡Fail to plan. Plan to fail.
🏆It has always been that simple.
❤️Good luck with your trading journey, I shall see you at the very top.
🎯Trade consistent, FRGNT X
USDCHF SUPPLY ZONE (DOWNTREND)PATTERN. Key Technical Levels:
Support: The pair has found support near 0.8220, which has helped stabilize its recent movements .
Resistance: Immediate resistance is observed at 0.8333, with a more significant resistance zone between 0.8482 and 0.8550, aligning with the 38.2% Fibonacci retracement level from the 0.9200 to 0.8038 decline .
Trading Strategy:
Bullish Scenario: A sustained move above 0.8333 could open the path toward the 0.8482–0.8550 resistance zone.
Bearish Scenario: Failure to hold above 0.8220 may lead to a retest of the recent low at 0.8038, potentially resuming the broader downtrend.
Traders should remain vigilant for the Federal Reserve's announcement, as it may introduce volatility and influence the USD/CHF's direction.

TOKYO knows something...SUS @ 0.8270OANDA:USDCHF
Tokyo opened as usual...but so hard to swallow...that they control direction of USD and more surprisingly CHF...
btw...just shorted USDCHF ...watch this 🙈
SUS @ 0.8270
and y'all what that means for Gold 🪙🥇 😉
sorry no trendlines OB or FVG or fib ...since unreliable for execution of investment grade...they monitor DD and other KPIs like RR and return in K/hr...
this is a system generated alert based on statistical significance...kinda like math.
can't predict manipulation magnitude...but usually -33p...our SL is $ value based on position size...
🥂

USD/CHF: Bearish ForecastPrice is likely to retrace into the 0.83593 – 0.85750 demand zone or push higher into the FVG (0.8700 – 0.8800) before facing rejection. As long as price holds below these zones, the downtrend should continue, targeting new lows below 0.8100.
Bearish momentum remains intact unless price breaks above the FVG.

USDCHF LONG FORECAST Q2 W18 D1 Y25USDCHF LONG FORECAST Q2 W18 D1 Y25
Professional Risk Managers👋
Welcome back to another FRGNT chart update📈
Diving into some Forex setups using predominantly higher time frame order blocks alongside confirmation breaks of structure.
Let’s see what price action is telling us today!
💡Here are some trade confluences📝
✅Weekly order block rejection
✅Daily order block rejection
✅15’ order block
✅Intraday bullish breaks of structure
🔑 Remember, to participate in trading comes always with a degree of risk, therefore as professional risk managers it remains vital that we stick to our risk management plan as well as our trading strategies.
📈The rest, we leave to the balance of probabilities.
💡Fail to plan. Plan to fail.
🏆It has always been that simple.
❤️Good luck with your trading journey, I shall see you at the very top.
🎯Trade consistent, FRGNT X

USDCHF – breakout (down), retest and bearish continuation The area between 0.8410 and 0.8330 has been a solid support but recently, price broke (to the downside). Now, price has been pulling back for a re-test and I believe that next week we may see a bearish continuation. Price will also come closer to the 20ema that I rely on as a guide to the mean.
I will be watching this area on a lower time frame, looking for bearish price action to go short. If bearish price action does resume, we are likely to see the round number 0.8000 be achieved.
This is not a trade recommendation; it’s merely my own analysis. Trading carries a high level of risk, so only trade with money you can afford to lose and carefully manage your capital and risk. If you like my idea, please give a “boost” and follow me to get even more. Please comment and share your thoughts too!!
It’s not whether you are right or wrong, but how much money you make when you are right and how much you lose when you are wrong – George Soros

Potential sell for USDCHFFX:USDCHF
Price came upwards and gave a perfect reaction on the swap zone, closing with a rejection candle on the 15 min timeframe.

USD/CHF "The Swissy" Forex Market Heist Plan Bearish (Swing/Day)🌟Hi! Hola! Ola! Bonjour! Hallo! Marhaba!🌟
Dear Money Makers & Robbers, 🤑💰✈️
Based on 🔥Thief Trading style technical and fundamental analysis🔥, here is our master plan to heist the USD/CHF "The Swissy" Forex Market. Please adhere to the strategy I've outlined in the chart, which emphasizes short entry. Our aim is the high-risk Green Zone. Risky level, oversold market, consolidation, trend reversal, trap at the level where traders and bullish robbers are stronger. 🏆💸"Take profit and treat yourself, traders. You deserve it!💪🏆🎉
Entry 📈 : "The vault is wide open! Swipe the Bearish loot at any price - the heist is on!
however I advise to Place sell limit orders within a 15 or 30 minute timeframe most nearest or swing, low or high level for Pullback Entries.
Stop Loss 🛑:
📌Thief SL placed at the nearest/swing High or Low level Using the 4H timeframe (1.81400) Day/Swing trade basis.
📌SL is based on your risk of the trade, lot size and how many multiple orders you have to take.
Target 🎯: 1.79300 (or) Escape Before the Target
💰💵💸USD/CHF "The Swissy" Forex Market Heist Plan (Swing/Day Trade) is currently experiencing a Bearish trend.., driven by several key factors.👇👇👇
📰🗞️Get & Read the Fundamental, Macro, COT Report, Quantitative Analysis, Sentimental Outlook, Intermarket Analysis, Future trend targets with Overall outlook score... go ahead to check 👉👉👉🔗🔗
⚠️Trading Alert : News Releases and Position Management 📰 🗞️ 🚫🚏
As a reminder, news releases can have a significant impact on market prices and volatility. To minimize potential losses and protect your running positions,
we recommend the following:
Avoid taking new trades during news releases
Use trailing stop-loss orders to protect your running positions and lock in profits
💖Supporting our robbery plan 💥Hit the Boost Button💥 will enable us to effortlessly make and steal money 💰💵. Boost the strength of our robbery team. Every day in this market make money with ease by using the Thief Trading Style.🏆💪🤝❤️🎉🚀
I'll see you soon with another heist plan, so stay tuned 🤑🐱👤🤗🤩

USDCHF SELLSPrice is still bearish therefore I’m only interested in sells for now. I’d wait for price to breakout of this h4 range then I’ll look for sells towards 0.78250 area.

USDCHF Discretionary Analysis: Bounce at 0.85Hello traders.
I'm anticipating the momentum on USDCHF to carry on. Got my eyes locked on the 0.85 area. It might turn into a strong bounce point. If the signs are there, I'm jumping in with a short.
Discretionary Trading: Where Experience Becomes the Edge
Discretionary trading is all about making decisions based on what you see, what you feel, and what you've learned through experience. Unlike systematic strategies that rely on fixed rules or algorithms, discretionary traders use their judgment to read the market in real time. It's a skill that can't be rushed, because it's built on screen time, pattern recognition, and the ability to stay calm under pressure.
There's no shortcut here. You need to see enough market conditions, wins, and losses to build that intuition—the kind that tells you when to pull the trigger or sit on your hands. Charts might look the same, but context changes everything, and that's something only experience can teach you.
At the end of the day, discretionary trading is an art, refined over time, sharpened through mistakes, and driven by instinct. It's not for everyone, but for those who've put in the work, it can be a powerful way to trade.

USDCHF Imbalance Zone Possible Set Up for Bearish ContinuationBased on the current analysis of USDCHF, there's a compelling bearish setup forming on the 4-hour timeframe. Let's dive into the details! 🔍
Fundamental Analysis 💹
USDCHF is currently under significant bearish pressure at 0.8655 📉. The Swiss Franc has been strengthening against the USD, likely due to its safe-haven status amid current market uncertainties. This fundamental backdrop supports our technical bearish bias! 🇨🇭
Technical Analysis on 4H Chart 📈
The price is trading below both the 20 EMA (0.8677) and 50 EMA (0.8715) 📊, confirming the bearish momentum. This bearish EMA alignment creates a perfect environment for short entries! ⚡
Imbalance Zone Opportunity 🎯
There's a clear imbalance zone between 0.8664 - 0.8674 that hasn't been properly retested yet. This zone represents an area where price moved quickly, leaving behind unfilled orders. If price retraces into this zone, it could act as a magnet for sellers! 💰
The Perfect Setup 🔄
Wait for price to retrace into the imbalance zone (0.8664 - 0.8674) ⬆️
Look for bearish price action confirmation (engulfing candles, rejection wicks) 🕯️
Confirm a bearish structure break after the retracement 📉
Enter short position with stops above the recent swing high (~0.8680) 🚫
Target the equilibrium level (0.8661) as first take-profit 🎯
Extended targets at previous lows or 1:2 risk-reward ratio 💸
Risk Management ⚠️
Keep your stop loss tight above the imbalance zone
Consider scaling out at key support levels
Total risk should not exceed 1-2% of your trading capital 💵
This setup offers an excellent risk-to-reward opportunity if executed properly! The bearish momentum is strong, with both EMAs confirming the downtrend. The imbalance zone provides a high-probability entry point for shorts! 🔥

USDCHF - BUYING OPPORTUNITYTeam, i do not trade very often on USDCHF
but i do watching when the price is right for enter
I am long position now.
Please review the chart carefully

USDCHF Daily Outlook – Smart Sell Opportunity AheadAfter a clean break and retest of the ascending trendline, USDCHF shows signs of weakness below the key supply zone — perfectly aligned with the 38.2–50% Fibonacci retracement.
🔻 My Bias: Bearish
I'm watching for a short-term pullback into the red zone (possible liquidity grab), followed by a strong continuation toward the next demand area.
💡 Why this setup matters: ✔️ Trendline break & retest
✔️ Strong bearish momentum
✔️ Fibonacci confluence
✔️ Supply zone reaction
🧠 Patience = Profits. Entry should be planned with precision.

Possible Bearish Market on USDCHFUSDCHF has been moving between support and resistance levels thereby creating a sideways movement on daily and weekly timeframes, also creating some flag patterns, currently, there is a potential sells on weekly and daily timeframes,
we might see a little movement up to the resistance zone at 92081, creating a triple top pattern before starting the downward movement again.
let's watch out for the market this week.
like and share your opinion

USDCHF .. will the weakness continue ??I really don't see any reason for a change unless of course Mr .. causes another upheaval. For now, check out your charts and note that:
Monthly - bearish
Weekly - bearish
Daily - bearish
Intraday - all bearish.
We will hit and break a few S/R levels, but IMO, we should eventually get down to 0.8400.
This is not a trade recommendation, merely my own analysis. Trading carries a high level of risk, so only trade with money you can afford to lose and carefully manage your capital and risk. If you like my idea, please give a “boost” and follow me to get even more. Please comment and share your thoughts too!!
