Usdchftrade


SELL USD/CHF @ MARKET .9758USDCHF has made steady progress north for the last 24 hours but has now hit the top of the existing channel. With RSI readings becoming stretched, the signs are that this channel may hold the price and we'll see a move south. USD/JPY has sold off steadily for the last 2 hours and possibly USD/CHF will try and catch up. I'm in at .9759 with a STOP above the channel at .9780 and a TAKE PROFIT at .9700. As ever I'll lock in a break even trade if we drop 25 pips.

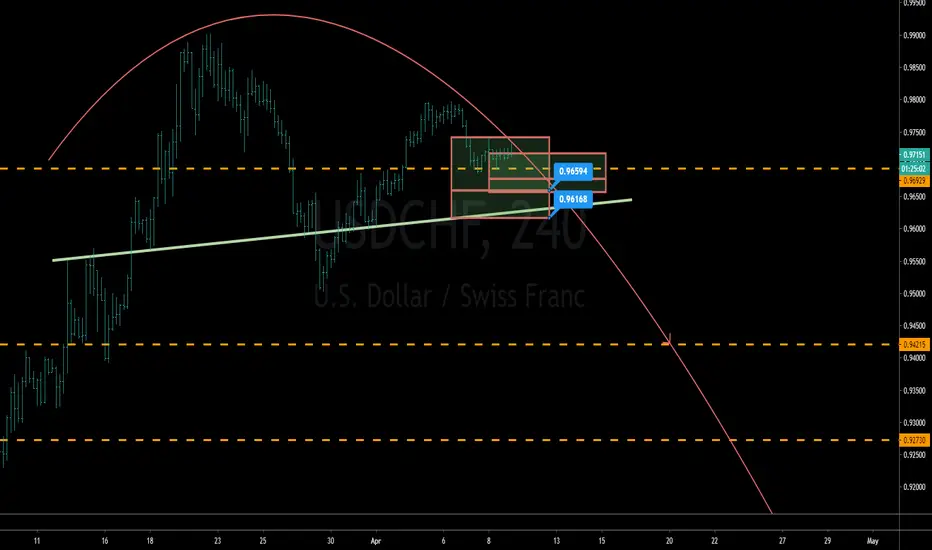
USDCHF SELL IDEAUSDCHF will come back to trendline and 0.236 fibo level
Good Lucks
Please support by liking and doing comment

USDCHF short opportunity! On screen analysis...Hi All,
Last week I traded this pair with succes and was waiting on a new opportunity to go short again. The Down trend is still intact and Price got reject several times at a historic S/R level @0.96850. My momentum indicator shows a bearish pattern once again so I'm confident Price will start dropping very soon.
Be patient and ride the waves... StopLoss is @0.97500 and Target as shown @0.94600

I LOVE TREND LINES - SELL USD/CHFOn the H1 chart we can see a really nice trend line that dates back from the 1st of April. This line has been significant for the last 17 days so the question is - will this line hold and repulse the BEARS. My guess is no.
Not with WR1 so close. WR1 will be targeted by the BEARS and my guess is that they will wait there to lay their ambush. Its only 30 pips from the trend line to WR1 and a move by the BEARS if they come in too soon will falter.
I expect price to be met with resistance at the trend line and we could see a few hours of sideways movement before the BULLS make for WR1. Thats where the main SELLERS will be. I'll watch the battle on the smaller time frames and either enter the market if it looks like the BULLS are retreating or come in at WR1 if my indicators give me the green light.

USDCHF ON THE UPPER PART OF THE BUBBLESigns of Bullish USDCHF (BUY)
-Prices have traverse to the upper part of the channel
-Wicks from above
-Breakout from the 1 hour triangle
-RSI at 4H maintained at 50 to 65
-Breaking the bubble
Please do hit LIKE if you agree or COMMENT for your reactions. Thank you.

USD/CHF, price in Symmetrical TriangleWe saw today false breakout on USD/CHF, so we expect further continuation upwards. Next Target is the top of Ascending triangle, the area around 0.97150

USDCHF Long! 1HrNote: Idea is to complement your research.
Check comments section for future updates on idea.
Like this idea? Like, Share, Follow (...)
Thank you and Happy trading.

USDCHF SELL SELL SELL, DON'T ASK WHYHI, TRADERS
MY NAME IS KD
TODAY I HAVE A GOOD STRATEGY PUBLISH TO ALL OF YOU :)
YOU CAN CLOSE YOUR TRADE ANYTIME AFTER YOU SEE PROFIT.
THERE IS NO OBLIGATION TO CLOSE AT TARGET TP.
RISK MANAGEMENT IS VERY IMPORTANT :)
HAPPY TRADING~
_________________________________________________
WANT TO LEARN MORE OR RECEIVE ACCURATE AND IMMEDIATE SIGNAL?
Telegram: KDEZ00

USDCHF bounced from support, potential for a further rise!
USDCHF bounced off 0.96827 where it could potentially rise further to 0.97943.
Trading CFDs on margin carries high risk.
Losses can exceed the initial investment so please ensure you fully
understand the risks.

USDCHF Short! See Comment SectionNote: Idea is to complement your research.
Check comments section for future updates on idea.
Like this idea? Like, Share, Follow (...)
Thank you and Happy trading.

U.S. DOLLAR / SWISS FRANC (USDCHF) MonthlyDates in the future with the greatest probability for a price high or price low

U.S. DOLLAR / SWISS FRANC (USDCHF) WeeklyDates in the future with the highest probability for price direction reversals

U.S. DOLLAR / SWISS FRANC (USDCHF) DailyDates in the future with the greatest probability for a price high or price low

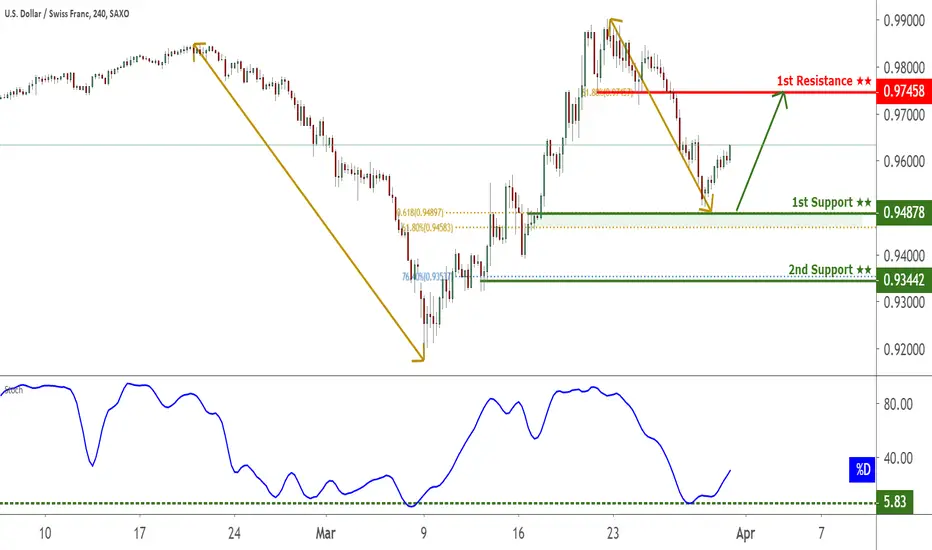
USDCHF potential reversal!
USDCHF expected to rise up to 1st resistance at 0.97458 where it could potentially react off and drop down to 1st support at 0.94878.
Trading CFDs on margin carries high risk.
Losses can exceed the initial investment so please ensure you fully
understand the risks.


USDCHF bounced from support, potential for a further rise!
USDCHF bounced off 0.94878 where it could potentially rise further to 0.97458.
Trading CFDs on margin carries high risk.
Losses can exceed the initial investment so please ensure you fully
understand the risks.

USDCHF SELL SHORTS from pink box zone given await rejection then enter, if it doesn't reject this trade set up is then invalid

USDCHF reversed from resistance, potential drop!
USDCHF reversed off its resistance at 0.98429 where it could potentially drop further to 0.95515.
Trading CFDs on margin carries high risk.
Losses can exceed the initial investment so please ensure you fully
understand the risks.
