Pay off the mortgage ;p This pairing is in an interesting place at the moment because it is reaching weekly highs it hasn't seen since August 2010... 9 years, price is currently 100 pips away from this level so we could see a bullish run up to it.
Another possible outcome is the 1 we have drawn on the chart, price could come back down to retest this trend line that has formed and make a new HL ( higher low ) before going up hitting this massively strong resistance before coming down and breaking through our TL, if this is the case and our TL is broken this pair could sink quicker than the Titanic.
We can only see bearish movement once price does hit this level as we can see USD weakness coming very soon and a possible recession.
This is a swing trade so expect this to develop over a few weeks or months so if this is not your style then don't enter, this trade works well for us as we don't have to keep checking the charts so we can just sail off into the sunset on our Yacht and not worry about a thing ( I'm joking about the yacht ;p but I do have a dinghy if that counts )
If this trade plays out by the rules you will be able to pay your mortgage off ;p
Usdchftrade

USDCHF - Short Trade Idea on the Daily ChartIntroduction:
This is a very straightforward trade. Following CHF's weakness today across major pairs and a mild USD rally, FX:USDCHF is now back at the top price levels since March 2017, repeating itself over 5 times already. There were a series of higher lows and approximately same highs, forming an ascending triangle on a macro level but a slight bearish wedge once you zoom in, this represented on the charts by the dotted trendlines. The chosen timeframe here is the daily chart since it more accurately presents our point of view, containing more information and reinforcing the 4h analysis.
How to proceed:
Our team already opened two short positions with two more orders pending: one at the immediate resistance and another at the upper resistance, both shown on the graph.
Take profit:
Should all 4 orders trigger, our first take profit is an interaction with the first dotted trendline: approximately 80-100 pips. The next level should be the interaction with the second trendline and the rest will be set with a 40 pips trailing stop-loss. Move stops to profit once at least 25-50 pips in profit. This is represented by the arrows.
Stop-loss (invalidation of analysis):
Should it surpass the top resistance level, a stop-loss for all orders is set on 1.02. By then we will reavaluate the market conditions and make decisions accordingly.
Indicators:
We usually prefer naked charts, but the chosen indicator here is the Relative Strength Index (RSI), since it corroborates our bias.
Side-notes:
Switzerland has an export-based economy that relies heavily on its monetary policy to maintain competitivity on international markets. The SNB (Swiss National Bank) actively interferes in its currency price, often undermining it to enhance the country's exports. By the, a correction is due and this is the precise moment we stand on.
Please leave your comments below and don't forget to follow us! Have a great trading session!

USDCHF broke major resistance zone now it can act support.USDCHF broke major resistance zone now it can act support. Wait for pullback and price action.


USDCHF - SELL BREAK DOWNnice time to capture some pips on this pair
PLEASE SUPPORT THE MOVEMENT WITH YOUR LIKES, COMMENTS AND FOLLOW FOR MORE

USD/CHF : Sell After BreakDown !!BUY & SELL Above Given Chart or
You Can Also set Own Risk reward.
Let see what Will be Next Move.
Warning- I m Not a Financial Advisor this idea Only For Educational Purpose Only.
Thank You !!

USD comeback? - Ichimoku USD/CHF Long Trade SetupIf you are in my membership then this setup should seem familiar to you. It's been on our watch list since last week and I am still waiting for it to progress to give me a valid entry. We've been ranging in the kumo so far and we're approaching a bullish kumo twist soon. I'm still waiting for this to progress a little further in the kumo until we can get to a bullish kumo breakout which will hopefully coincide with a bullish TK cross and chikou span rising up and through price. Any combination of these confirmations with the kumo breakout should be enough to validate a buy entry for me. You'll notice the lines I've drawn out from our previous successful sell entries. I've left these drawn on this chart to illustrate that the market tends to return to key levels. What acted as support and resistance will now act as potential take profit levels and resistance once again. That is exactly what these indicators do is point to confluences of price structure without having to draw anything manually on our charts. I am going to use some of these horizontal lines as partial take profit levels if we get a valid buy entry. The reason I do this is to limit risk exposure as this progresses as well as take some profit off the table, but ultimately you need to decide to trade based on a style that best suits you. If we fail to get a bullish breakout or our bullish confirmations fail, this setup may become invalidated.

USDCHF trade IdeaThe yellow bar represents the 50 and 61.8 fibonacci levels based on the first bullish move after the drop. Price printed a pin bar pinning both these levels, also note the trend line remains unchallenged.
I have bought at market price 0.99466 and
# placed my stop just below the trend line and previous low @ 0.98876 and
# my take profit is below the resistance level higher up @ 1.00496
Don't bet the farm and never invest what you can't afford to lose.
For full details on trade management join me in Forex Bootcamp using the Telegram link below

USD/CHF: Sell From Double TOP !!BUY & SELL Above Given Chart or
You Can Also set Own Risk reward.
Let see what Will be Next Move.
Warning- I m Not a Financial Advisor this idea Only For Educational Purpose Only.
Thank You !!

USDCHF Trade IdeaWhen checking the D1 and W1 time frame I can see an ascending triangle pattern formed, equal highs but more specifically higher lows = bullish market structure
Price may fall lower down to the trend line BUT IF price prints a buy signal on the yellow bar (50 and 61.8 fibo levels for recent bullish move, although small) I will look to buy
My level of interest to buy at will be 0.99336 with
SL below the previous swing low @ 0.98576 and
Take profit higher up just below resistance @ 1.00496
As usual, don't bet the farm and exercise good risk management.
For more info on exact entry and trade management feel free to follow me in Forex Bootcamp using the Telegram link below


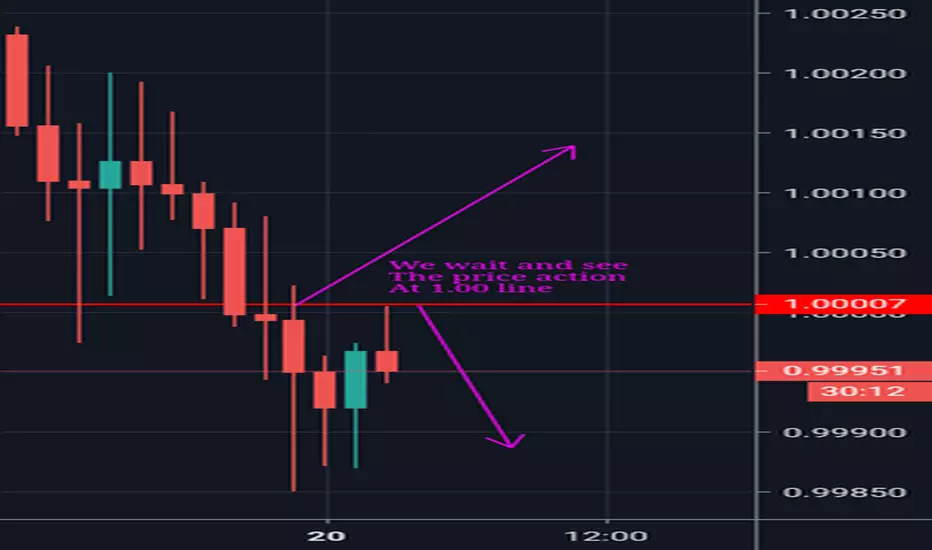
USDCHF at 1.00 s/rIt might be short or long.
The important thing is that trading opportunity will happen here.
Wait and see for the moment.
More likely short, waiting for the signal.
USDCHF Trade IdeaDouble top / M formation completed.
Price also re tested the minor resistance marked (pinning the level is a big price action clue)
Entered @ market price 1.00608 and
TP lower down at next support 0.99907 and
SL above the high @ 1.00890
Don't bet the farm and always exercise healthy risk management :)

USDCHF - SELLFX_IDC:USDCHF
I am demo trading and documenting my progress. This is not intended to be a sell signal !
Ascending Trendline Structure on 4H
Currently Trading Between Support & Resistance Zones
Sell Limit - 1.00950
TP - 0.9995
SL - 1.0127

The #USDCHF strengthened a lot? This is not the end, apparentlyAs can be seen in the graph above there is a serious resistance at 10090 price, each time the usdchf touched this resistance it fell, the first time the fell was relatively large and each time it shortened more and more it usually signifies that the sellers are getting weaker, We think this time it will break this resistance and then the price of the USDCHF will strengthen by 200 pips as it reaches its next resistance.
Buy USDCHF:
Entry Price:1.0077
Stop Loss: 0.99
Take Profit: 1.03

USD/CHF: Buy For 150 Pips Traget !!BUY & SELL Above Given Chart or
You Can Also set Own Risk reward.
Let see what Will be Next Move.
Warning- I m Not a Financial Advisor this idea Only For Educational Purpose Only.
Thank You !!

USD/CHF: Long Term Bullish !!BUY & SELL Above Given Chart or
You Can Also set Own Risk reward.
Let see what Will be Next Move.
Warning- I m Not a Financial Advisor this idea Only For Educational Purpose Only.
Thank You !!

Too SimpleDuring the last week of trading price has been declining in conjunction with RSI dropping below 55. Wait for the crossover and give it a go. Too simple.

USDCHF Trade IdeaThe resistance level has been pinned and price is around a key supply zone on the Daily time frame - I am shorting at market price with:
Stop loss 25 pips from my entry (just above the highs) making this an ultra low risk setup (Sl at 1.00288) and
Take profit lower down at the support level at 0.99256
This trade offers a 1:3 RRR
Don't bet the farm and always exercise healthy risk management :)
PS: Check the bearish engulfing pattern on H1 confirming the short....


USDCHF Strong Breakout Setup - Possible Buy TradeHello Everyone!
Looking at the lower time frames USDCHF is making new lows and lower highs, so far price has reached mutli-sessions downtrend line where I see hidden divergence, there are possible 2 cases here,
Case 1:
Market may fell and makes a double bottom and then carries on testing prior highs, so in this case execute trade once it breaks the trend line.
Case 2:
Keeping bigger picture in mind, where momentum is positive on higher time frames, scope is there that the market may break out the trend line and visits the highs straight away, in this case wait for an expansion bar, breaking the trend line and closing above it.
This is it for now, hope it helps understanding the idea.
Thank you for your support.
Good luck and trade safe!

