USDCHF trade ideaUSDCHF has been battling to break those highs on the higher time frames so this is an indication that the bulls may be losing control....
Note the following:
1. Trend line broken to the down side
2. Support re tested as resistance and the candle popped a wick to the up side (clue)
3. 50 ema broken...
I am shorting at market price @ 1.000281 with
TP provisionally at first support @ 0.99890 and
SL just above the resistance level @ 1.00580
Don't bet the farm and always exercise healthy risk management
Usdchftrade


USDCHF TRADE IDEAUSDCHF lose some power and it closed pretty bearish. I'll be looking to go short here, as I know that bearish pin bars after that kind of strong bullish closes are more like a "trap", but risk/reward ratio is not bad, and I'll take it with smaller risk.
My trade idea here is:
USDCHF SELL BELOW 0.9920
SL 1.0000 (-80 pips)
TP 0.9800 (+120 pips, Key zone)
TP2 0.9550 (+370 pips, only if price break below the trend line)
USDHCF BUY ABOVE 1.0000
SL 0.9925 (-75 pips)
TP 1.0110 (+110 pips)


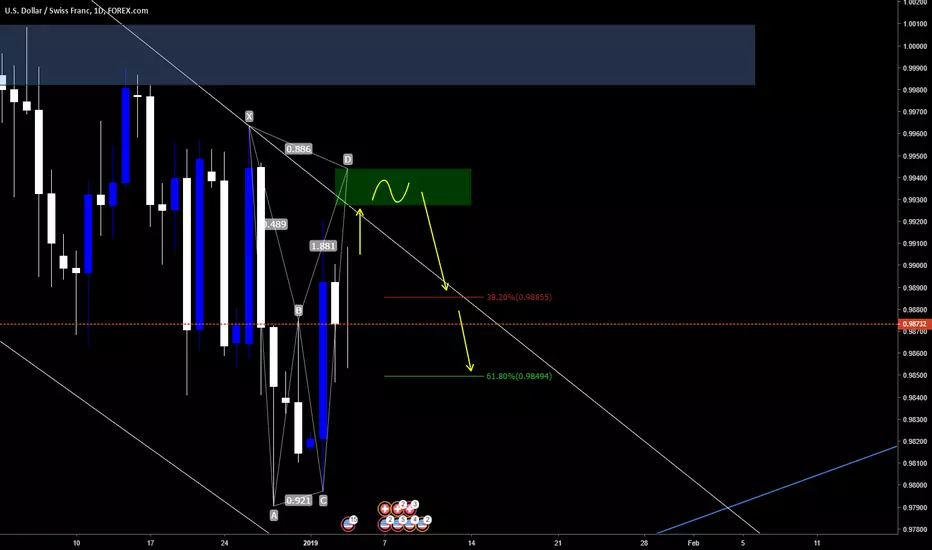
Waiting for short opportunity on USDCHFPair: USDCHF
Daily Bat Pattern
Prediction: Price go up -> Consolidate in the Green Zone/ Sell Zone -> First TP at 38.2% -> Second TP at 61.8%
USDCHF LONG TRADE ENTRY ZONEHello! I have for you a very interesting long idea:
Stop on the chart. All details available on the chart, but if you need - please comment and let's discuss.


USDCHF Completed AB=CD PatternUSDCHF Completed AB=CD Pattern
Downtrend starts Two Bearish Target Given...

USD/CHF SELL LIMIT (4:1)two very strong resistance zones on the daily chart, as you can see the market has been rejected over 10 times at these levels since 2013. This is a very high probability trade, with an amazing Reward/Risk of 4:1

USDCHF - Important SupportAs we can see in the chart the Support zone is holding quite well. If the Support zone won't be broken we could see a nice long to the first Resistance level of 0,98500-0,98600.


USDCHF - Double bottom incoming before end of the year?If this pullback will reach the Support level of 0,97900 we could see a double bottom. After that double bottom we could see a raise to 0,99500 somewhere in the first week of 2019.

USDCHF SHORTISH Trending down USDCHF. If the trend maintains its structure, we may see a small bounce followed by a heavy downtrend. Since price is at the lower trend/channel I am looking for a sell entry closer to the upper channel/trend to ride it back down.

USDCHF Sell Trade IdeaUSDCHF Sell Trade Idea: Looking To Open A Sell Trade On This Pair. Smart Move Is Waiting For A Pullback Then Go In Hard & Have An SL Of 0.991 or 0.993. Looking For A Strong Move Down In The Coming Days.


USD/CHF - Nearing Support In the next few hours I expect a drop to the Support level of 0,98500. If the Support level can hold we could see a raise to the Resistance level of 0,99200.
To be updated.

USD/CHF - 2 Scenario's for a long trade!If the first support level of 0.99500 won't be broken we could see a possible raise to 0.99950
If the support level will be broken we could see a fall to the second support level which is 0.99200
Wait for confirmation of the first support level!
Goodluck trading and join my free telegram to stay updated of my analysis:
t.me


USDCHF Sell setup USDCHF broke out sharply last week, expecting the correction to continue a bit before fresh falls, momentum across the board is in line so looking for short setups here.
Trade safe!
Thanks for your support.

Forget H&STaking contrarian view and betting against head and shoulders forming; predicting up-side stop-run.
