#USDDKK 4HUSDDKK 4-Hour Analysis
The USDDKK pair is forming a descending triangle pattern on the 4-hour chart, a bearish continuation pattern that indicates the potential for further downside. The price is consolidating near the support line, and a breakout below this level would confirm the bearish setup.
Technical Outlook:
Pattern: Descending Triangle
Forecast: Bearish (Sell Opportunity)
Entry Strategy: Enter a sell position after a confirmed breakout below the triangle’s support line.
Traders should look for confirmation such as a strong bearish candlestick closing below the support level or increased selling volume. Proper risk management is crucial, with stop-loss orders placed above the upper boundary of the triangle. Profit targets can be set at the next key support levels, aligning with the measured move from the triangle’s height.
Usddkkidea

USDDKK – Bullish? Not really but watching … week of 14 Nov 2022This pair has been falling like a ton of bricks the whole of last week. I have a feeling this could change now, because:
- the area around 7.1800 has been a solid S/R zone for this entire year.
- The 200 dma is nearby too and could act as dynamic support.
However, I do need to see some evidence of bullish strength before I commit to a trade. For this is I will be monitoring price action on 4 hour and even the 1 hour chart, looking for signs that the bulls are gaining control. These signs can come in the form of double bottom, hammer or an engulfing candle formation.
For now this is a counter trend idea, so even if a setup forms, I would recommend an initial half position size. If this works out as per my expectation, we should have a +2R trade, with a possible extension to 4R.
Always use sound money and risk management and stay patient in all your trades.
If you like my analysis, please give it a “thumbs up” and follow me to get even more awesome content.
What do you think about this trade idea? Please comment and share your thoughts!!

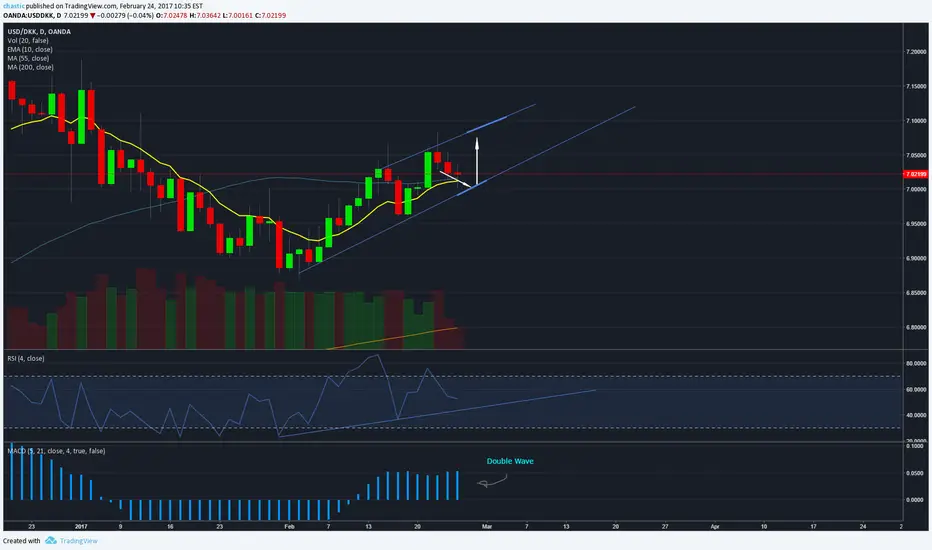
Finding Support Before Going LongI'm pretty strong believer that we are going to see a third touch on the upper trend line. It does feel like it has found support already on the 55MA and 10EMA, but be aware it might go down and touch the bottom support, before going up.