USDJPY LONG USDJPY has being bearish for weeks , now price tested a key level at marked zone and rejected it & has closed back above another important zone.We can also see the large engulfing candle showing lots of bullish momentum on the Dollar. If not yet in the trade , wait for minor retracement , to the marked zone then jump in .If it doesnt retrace and continues bullish can look for another setup.Trade will only become invalid if price breaks back below the 104.36.
In Conclusion Usdjpy is bullish for longterm investements .
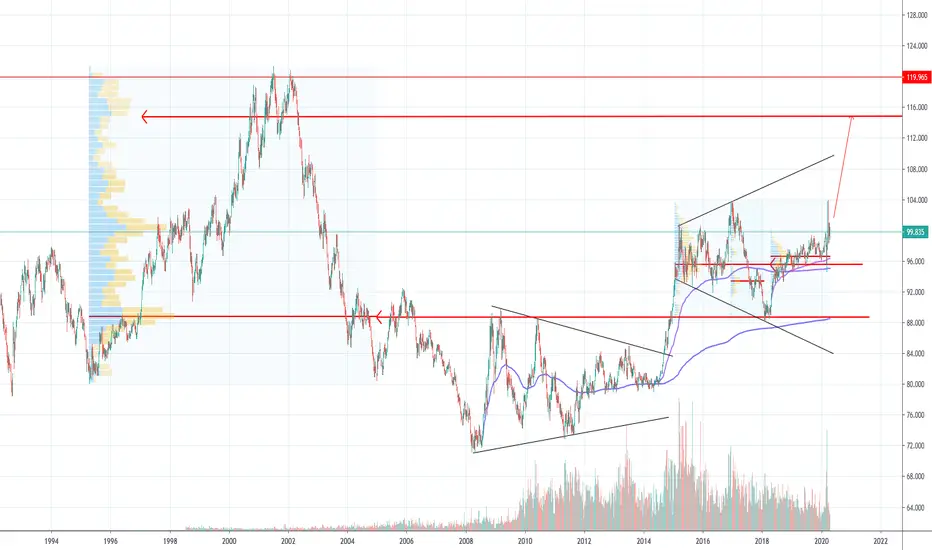
Usddollar

Long USD Dollar, Breaking out soonIt look like an inverse head and shoulder chart pattern is forming, could we see a break out soon?
If stocks and gold continues to sell off, it will be more likely.


Bank Of America short if dollar holds Stock symbol BAC has been hitting 4 hr trend line and falling if USD dollar can hold up strength looking for short to weekly trend line $.40 drop, late at seeing this chart but earlier had some nice shorts


USDTRY In A Bullish Move! - Elliott wave analysisHello traders,
USDTRY is bullish, clearly in a five-wave move, up from 5.64 level. We can see waves (I), (II), (III) and (IV) as completed, so recovery from 6.68 can be part of a final wave (V). Wave (V) is an impulse itself, therefore five legs within is must be seen, before resistance, and a reversal in three legs may show up. Now there are only three legs seen, within a wave (V).
Possible resistance for wave (V) is at 7.5/7.8 level.


USDJPY - Potential ShortA potential short opportunity may arise for USDJPY at the 107.400 level.
Confluences here will be a rejection of the descending trendline, in line with the 100/200 EMA, and the previous support zone.
We may experience an initial drop to the 106.635 area ('TP1'), with a second target around the 106 psychological if momentum is strong.
Let's see how this plays out, and if confirmations are present we can look to enter a short position on this pair.

USDCAD Targeting 1.385 Level - Elliott wave analysisHello traders,
USDCAD started rallying from the 1.3318 low, indicating that wave C) of a higher degree is completed, and that a minimum three-wave turn is underway.
We labelled a completed leg A/1 and B/2 as part of a reversal, so current rally from 1.348 swing low can be part of wave C or 3. In case of wave C price can target area at Fib. ratio of 100.0 (1.385 level), where wave A would equal wave C in length, and price would turn lower. However, in case of wave 3, price can reach area at Fib. ratio of 161.8 (1.40 level), and turn lower only for a temporary setback as part of a bullish reversal.
Trade well,
The EW-forecast team

DXY That could be it for wave C . We have our first leg up form the lows expect PB and another leg up where bears will fade the 61.8 and THEN the reaction from there will be key


Dollar Index ~ Poised for rallyMarket structure suggest USD Dollar index poised for good rally towards 110 and 115 in coming months.
DXYHope all of you survived March 2020...
So we have a quite interesting scenarios with DXY which is showing us several possible down movements.
What is important to know, we are about to enter "the post-virus economy" which already started with huge stimulus from FED and other CBs worldwide. BUT why don't we get a USD falling into hyperinflation after the enlarged QE and agreed to add up to 2 trl? The answer is in money multipliers but anyway we will see some effect.
Let's back to TA, so we have 3 base scenarios:
1. Yellow: we wait for the continuation of down movement after the recent correction;
2. Green: similar to the Yellow but more extended in time;
3. Purple: in this case, we wait for much deeper down movement;
P.S. First of all I'm looking at the shape of the movement, not at the price, please don't consider levels and line as a target or as a signal.


Gold will retest before going downGold has changed it's a trend and broken the trendline, wait for a retest and take a short position.

EURUSD Entering Strong Resistance!
EURUSD keeps rising.
so many traders are struggling with the identification of the next pivot point for the pair.
and indeed: just during the last two weeks, at least 4 key levels were easily broken to the upside without any hesitation.
on Friday the pair has reached an important historical area of resistance and the market closed with a strong rejection confirming the significance of the underlined area.
based on that, next week EURUSD may retrace lower at least to 1.122 - first strong support.
take this into consideration and adjust your trading plan accordingly!
have a great weekend!
please, support the idea with like and comment! thank you!

USD/CAD Double Top Formation Drop Incoming - M.W.Hello followers,
Get ready!! Drop Incoming
USD/CAD reached a huge resistance, and CRUDE OIL is now ready for another jump.
Double Top Formation is a confirmation.
Down Trend Line following
How do I know ?
Technical Analysis
Enjoy => it is free!
M.W.


XAUUSD DECLINE LIKELY TO CONTINUEThe Gold versus the US Dollar will most likely continue to edge lower.
The 200- period simple moving average could provide resistance for the exchange rate in the short-term future,

USDCHF could go downThe USD/CHF currency exchange rate will most likely continue to edge lower within the following trading sessions.
The possible target for the exchange rate will be at the 0.9750 area.
