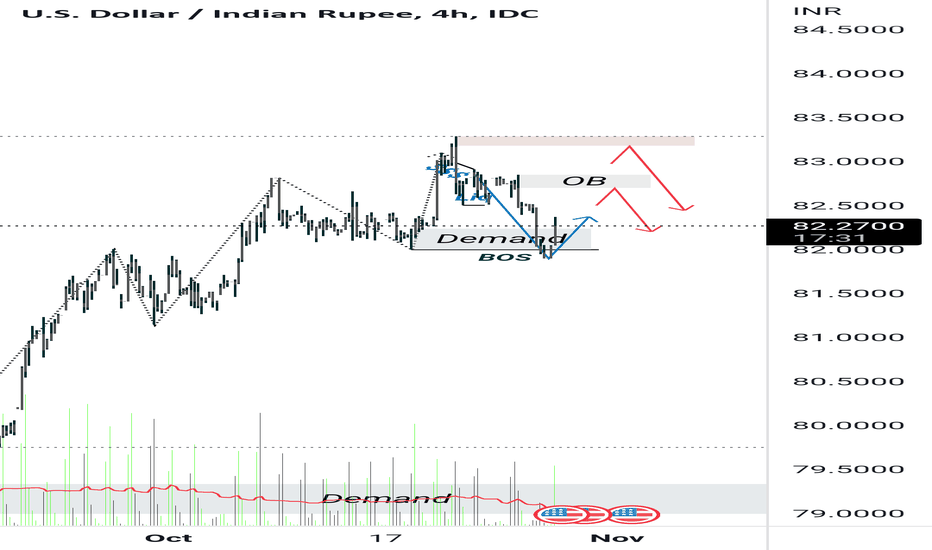
USDINR
USDINR (U.S.Dollar / Indian Rupee) Currency Analysis 29/03/2021on a bullish impulsive wave we can see there exist a Hidden Bullish Divergence with MACD which is the sign of trend Continuation, followed by a Milled Bullish Divergence
there total of 2 Targets Defined by Fibonacci projection,
79.50 Rs seem to be a good target for the end of 2021
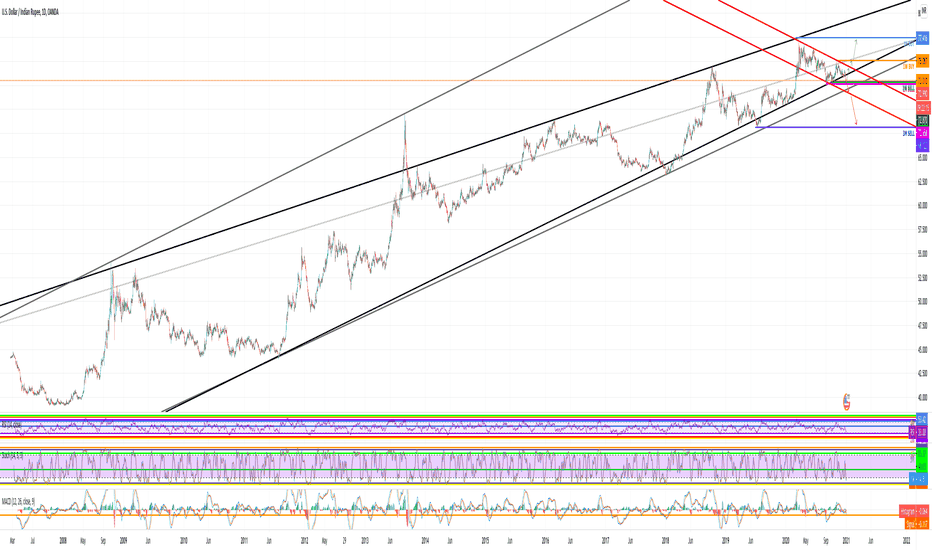
USDINR STRONG IMPORTANT LEVELHello friends,
First, I love India and the Indian people. I made an analysis for the Indian rupee and I think it is on a very important level now. You see the huge rising channel, in which a small falling one is formed. I have indicated the important levels on monthly and weekly charts, which were just hit. We saw a strong rejection from these levels, which means that the price is struggling to fall down further. If the daily candle closes today with a bullish candlestick pattern, I drew the path upside. However, my opinion is that we would only make a price correction in order to break those levels and fall further. Downside levels are really strong and if those are broken we might see a massive crash of the price. I advise you to follow the fundamental analysis of the Indian economy because it is an integral part of this trade. I will also upload pictures under this trade in order to see closer daily candle and fibonacci levels. I will update this trade and follow it closely!
This information is not a recommendation to buy or sell. It is to be used for educational purposes only.
Namaste! I wish you all the best and bags of profits during the new year.
USDINR Bullish Trend - Target 80-81 by Aug 2022USDINR has been in bullish upwards trend channel for last 4-5 years and has been consolidating sideways since Mar 2020. If it manages to close above 76 in next 2-3 months, it will be big breakout and soon we can expect it to reach 80-81 by Aug 2022 or earlier. Globally all countries are printing money and weakening the currencies and with all uncertainty around COVID and global economy, Dollar seems to be a better hedge. Most currencies will lose value against US Dollar and USD will lose against Gold.
Dj30 long trade possible One can go long in index
At current levels
Sl 30300
Tgt 31250 31400
Ask your financial advisor before taking any action based on my view
Only for educational purposes
USDINR Short 2HRTF based on 3 simle indicatorsIndicators:
200EMA
Bollinger bands
RSI
Trade conviction:
RSI Daily TF strength is declining
Dear traders, I have identified chart levels based on my analysis,
major support & resistance levels. Information shared by me here for educational
purpose only. Please don’t trust me or anyone for trading/investment
purpose as it may lead to financial losses. Focus on learning,
how to fish, trust on your own trading skills and please do consult your
financial advisor before trading.
Please do review, analyse and share your comments as well.
Let us work and win together. Wish you a very happy, healthy & profitable trading day ahead!
Disclaimer: I have analysed the data based on my limited knowledge.
Please don’t trust me for trading as it may lead to financial losses.
Please consult your financial advisor before trading
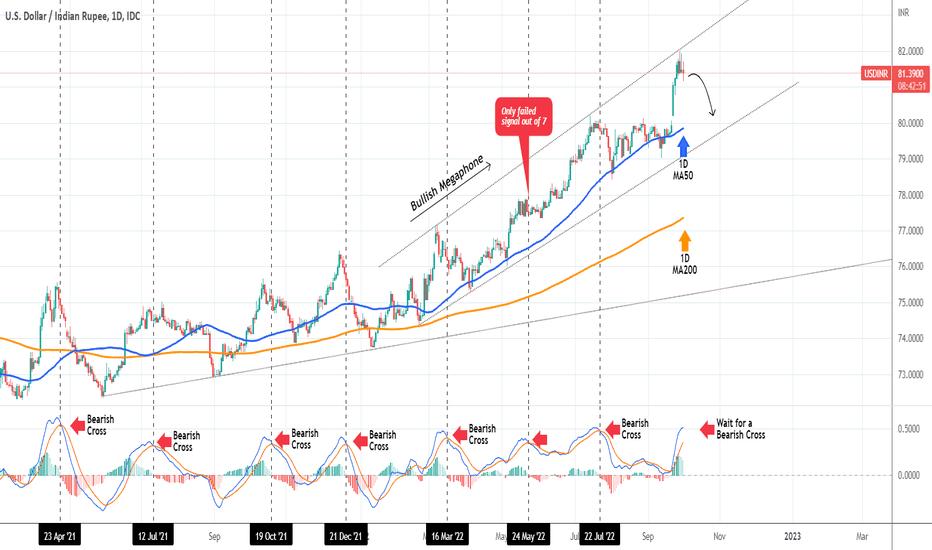
USDINR Sell when the MACD gives a Bearish CrossThe USDINR pair has been trading within a Bullish Megaphone since February 21 2022. Just 2 days ago, the price hit the top (Higher Highs trend-line) of this pattern and got rejected. We may see a pull-back towards the 1D MA50 (blue trend-line) or even the bottom of the Megaphone.
The best confirmation to take that sell trade would be to wait for the 1D MACD to form a Bearish Cross. As you see, since April 23 2021 all seven MACD Bearish Cross occurrences have delivered substantial Lower Lows on the short-term, except for one time (May 24 2022).
-------------------------------------------------------------------------------
** Please LIKE 👍, SUBSCRIBE ✅, SHARE 🙌 and COMMENT ✍ if you enjoy this idea! Also share your ideas and charts in the comments section below! This is best way to keep it relevant, support me, keep the content here free and allow the idea to reach as many people as possible. **
-------------------------------------------------------------------------------
You may also TELL ME 🙋♀️🙋♂️ in the comments section which symbol you want me to analyze next and on which time-frame. The one with the most posts will be published tomorrow! 👏🎁
-------------------------------------------------------------------------------
👇 👇 👇 👇 👇 👇
💸💸💸💸💸💸
👇 👇 👇 👇 👇 👇
DXY - DAILY TIME FRAME VIEW - Q. What is the biggest confusion you have ever had in trading and how did you solve it?
#Financial Markets....
Applying Classical Charts Patterns On The Candlesticks Price Charts:
Ans.
Hey there,
These are one of the most important Patterns which i have replaced the same principles on the charts. we need to apply the same on the price charts. These are found in CANDLESTICK (pricechart). We call them as Classical Chart Patterns and are always seen on any time frame. this shall be in BULLISH OR BEARISH MARKETS the same above image can be reversed for the bearish Markets as well.
The question come is that. how to find and trade them. These are the basic principles and very important principles, that one needs to understand them and also apply them on the price charts. just applying with one particular time frame on the same instrument is not the right methodology.
We need to have this BULLISH patterns, in minimum of 3-4 time frame..... same applies on the BEARISH MARKETS as well. Next I shall be sharing, how these patterns can be traded and will be seen in the in the Price Charts.
Keep Following us for more information.
Note: Its my view only and its for educational purpose only. Only who has got knowledge about this strategy, will understand what to be done on this setup. its purely based on my technical analysis only (strategies). we don't focus on the short term moves, we look for only for Bullish or Bearish Impulsive moves on the setups after a good price action is formed as per the strategy. we never get into corrective moves. because it will test our patience and also it will be a bullish or a bearish trap. and try trade the big moves.
we do not get into bullish or bearish traps. We anticipate and get into only big bullish or bearish moves (Impulsive Moves). Just ride the Bullish or Bearish Impulsive Move. Learn & Know the Complete Market Cycle.
Buy Low and Sell High Concept. Buy at Cheaper Price and Sell at Expensive Price.
Keep it simple, keep it Unique.
please keep your comments useful & respectful.
Thanks for your support....
Tradelikemee Academy
USDINR - A Triangle PossibilityUSDINR.
There is a possibility for a triangular formation on this pair based on the idea that all the waves have a 3 wave structure in the form of a-b-c. In such case, the price will be forming another bullish wave following a breakout. The analysis is based on the Elliott Wave Theory.
USDINR taking channel supportUSDINR saw a sharp decline today. With this fall, it has touched the support region of the rising channel within which it was moving for last few weeks.
As the RSI is also reaching the oversold region, I feel there might be a pause here and we may see some pullback.
I will wait for the price-action to unfold during next few hours on this support region to determine the direction of next move.
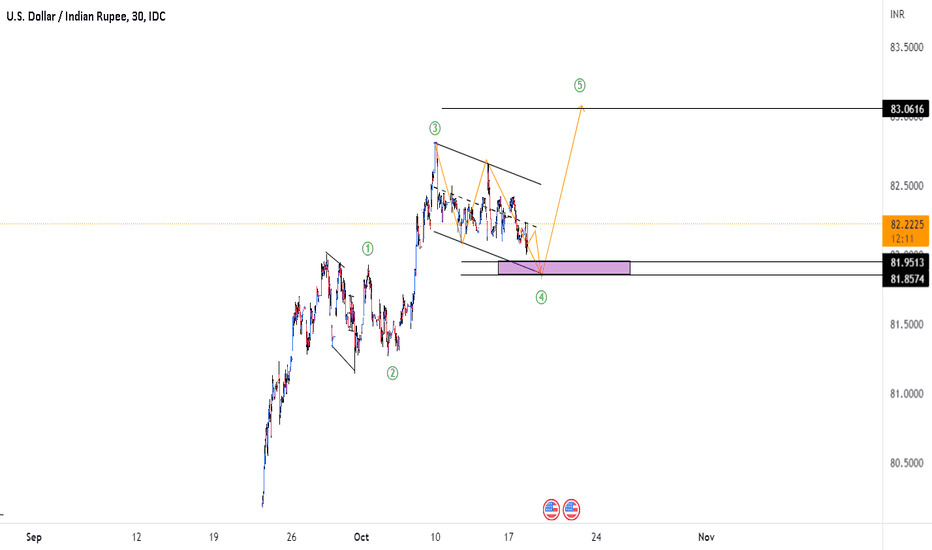
USDINR : Elliott wave Analysis USDINR is in its 5th wave as per my Elliott wave analysis. Wave#3 was extended, so the wave 1 should be = wave 5, with this assumptions I think the USDINR will go upto 81.80 are before deciding further direction.
USDINR - Approaching resistance zoneAfter showing a sharp fall early last week, USDINR has again started its upward journey. It is slowly approaching a strong resistance zone. This zone lies between 79.69 - 79.82. A breakout of this will clear its path towards 80.00 and then towards the recent all time high of 80.20.
However, a strong rejection of this level might mean a fall back to 79.00 levels.
So, if you are planning a fresh entry, price action in the region of 79.69 - 79.82 is an area to watch for.
USDINR current price going to be a historyUSDINR is going to be a history at this current price where it is standing.
People (traders and investors) are going to remember this price 81 for a very long time.
I am an Elliottician and I will upload the counts of this chart. Right now, all I can say is that this chart is going to make a big reversal. The psychology of money is telling that something big is going to happen here.
The time of India is start now.
Short USDINR with the capital at which you can bear loses because the real meat if you want to eat, a right amout of capital should be placed on a trade.
Thanks
USDINR - Testing a critical resistanceUSDINR gave a strong upmove last day and is now out of the weekly resistance of trend-line. The resistance was broken with a strong candle and we can expect further upmove.
At the same time, USDINR is testing another resistance trend-line that has been tested 3 times since 2013 and now being tested for the 4th time. A weekly close above this would mean further uptrend.
However, we don't see a deep down-side also as of now since we broke a trendline nearby laready.
As of now, I am Neutral to Bullish on this pair with a strong support region of 78.40 - 78.30. Daily close below this would mean change in trend.


