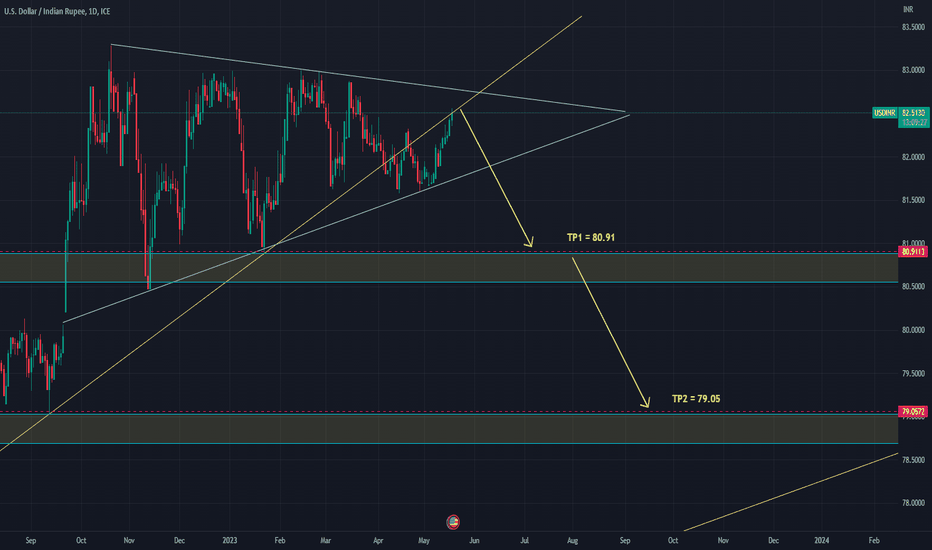
USD/INR sale nowHi everyone! USD/INR pair long was in one range, thereby a narisova a triangle. Now the price drew already 2/3 triangles. Therefore it is possible to expect it breakdown in the nearest future. I expect breakdown of a triangle down. Now the price is close to the upper bound of a triangle therefore the entrance to the transaction is safe. Stop loss can be delivered above a triangle, that is on breakdown up. I consider that the price as a result all the same will achieve the designated objectives (even at breakdown up and leaving up to 88). Technical indicators nap week and monthly schedules showed a turn long ago. So, I sold at the current price 82.53 with the purposes:
TP1 = 80.91
TP2 = 79.05
Information provided is only educational and should not be used to take action in the market.
Usdinrshort
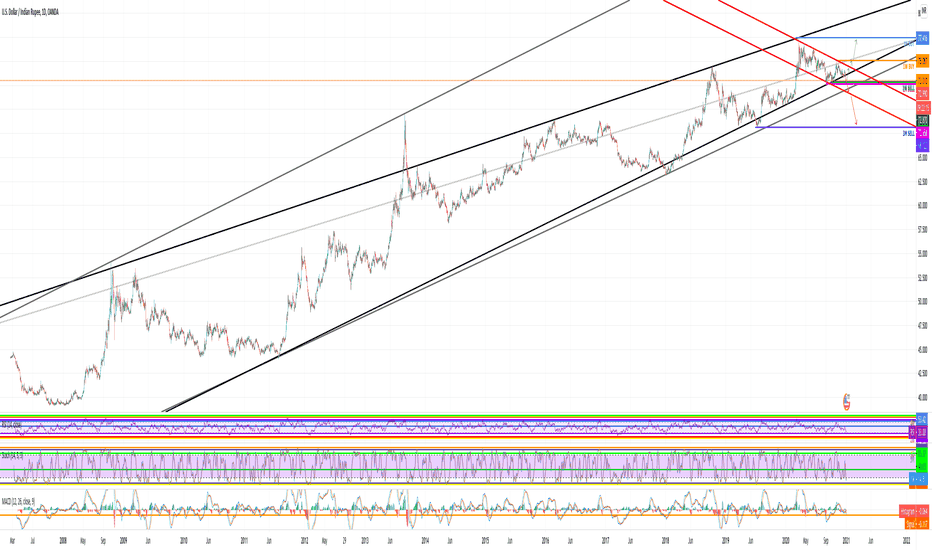
USDINR STRONG IMPORTANT LEVELHello friends,
First, I love India and the Indian people. I made an analysis for the Indian rupee and I think it is on a very important level now. You see the huge rising channel, in which a small falling one is formed. I have indicated the important levels on monthly and weekly charts, which were just hit. We saw a strong rejection from these levels, which means that the price is struggling to fall down further. If the daily candle closes today with a bullish candlestick pattern, I drew the path upside. However, my opinion is that we would only make a price correction in order to break those levels and fall further. Downside levels are really strong and if those are broken we might see a massive crash of the price. I advise you to follow the fundamental analysis of the Indian economy because it is an integral part of this trade. I will also upload pictures under this trade in order to see closer daily candle and fibonacci levels. I will update this trade and follow it closely!
This information is not a recommendation to buy or sell. It is to be used for educational purposes only.
Namaste! I wish you all the best and bags of profits during the new year.
USDINR Short 2HRTF based on 3 simle indicatorsIndicators:
200EMA
Bollinger bands
RSI
Trade conviction:
RSI Daily TF strength is declining
Dear traders, I have identified chart levels based on my analysis,
major support & resistance levels. Information shared by me here for educational
purpose only. Please don’t trust me or anyone for trading/investment
purpose as it may lead to financial losses. Focus on learning,
how to fish, trust on your own trading skills and please do consult your
financial advisor before trading.
Please do review, analyse and share your comments as well.
Let us work and win together. Wish you a very happy, healthy & profitable trading day ahead!
Disclaimer: I have analysed the data based on my limited knowledge.
Please don’t trust me for trading as it may lead to financial losses.
Please consult your financial advisor before trading
USD/INR shortTechnical indicators indicate corrections the need. I specially chose the purpose achievement by which perhaps with high probability. It does not mean that correction on it will end. On the week chart the price moves in the upward channel, that is the medium-term trend remains upward.
TP = 76.42
Information provided is only educational and should not be used to take action in the market.
USDINR looks to be good short, heading down to 77.2 levelsUSDINR has been trading in an Upward Parallel Channel, since last year end till now. Recently it has hit the upper top of the channel at 77.88 levels.
Its a SELL till 77.4 and if it breaks 77.4 level with good volume, it can further drift down to 77.17 levels.
76.94 to 77.1 7 is a Buy Zone, where can be a bounce back but till that time, its a Short.
USDINR USDINR faced resistance near the falling trendline from the 2020 top,
it came close to touching it but turned lower,
also hit has broken down recent support trendline too,
another move to the bottom end of the triangle near 72.47 should develop,
if this triangle is complete as presumed then we should break below 72.47, and that would be b d trendline and it can make it more bearish.
Key Levels are Mentioned on chart
Wave Structure
Trendline breakdown
Macd in daily negative and crossed under zero line
Rsi in daily below 40 and down tick
Lower bollinger band challenged in daily time frame
Dmi adx also Negative ungli
Disclaimer
I am not sebi registered analyst
My studies are Educational purpose only
Consult with your Financial advisor before trading or investing
USD/INR: section fast transactionsHi everyone! USD/INR pair achieved the objects set earlier and now correction is necessary. I expect correction at least up to 0.382 levels according to Fibonacci.
Sold on 74.51
TP = 73.9296
SL = 74.9133
Information provided is only educational and should not be used to take action in the market.
This section is intended for short-term speculation. Be ready to leave a position at any time.
USDINR ::: SHORTL O N G T E R M S I P T R A D E
DATE: 20 MAY 2021
INSTRUMENT: USDINR
TREND: SELL
TIME FRAME: DAY
CMP: 73.160
SELL BELOW: 73.118
STOP LOSS: 73.30
TGT 01: 73
TGT 02: 72.84
TGT 03: 72.70
TGT 04: 72.323
TGT 05: 72.70
DISCLAIMER:
We are not S E B I registered analysts. Please consult your personal financial advisor before investing. We are not responsible for your profits/losses whatsoever.
Leave a comment that is helpful or encouraging. Let's master the markets together.
USDINR ::: SHORT07 MAY 2021
INSTRUMENT: USDINR
TREND: SELL
TIME FRAME: DAY
CMP: 73.54
SELL BELOW: 73.424
STOP LOSS: 73.752
TGT 01: 73.298
TGT 02: 73.196
TGT 03: 73.058
DISCLAIMER:
We are not S E B I registered analyst. Please consult your personal financial advisor before investing. We are not responsible for your profits/losses whatsoever.
USDINR ::: SHORTRISK DISCLOSURE
Futures and options trading has large potential rewards, but also large potential risk. You must be aware of the risks and be willing to accept them in order to invest in the futures and options markets. Trade with risk capital only. The past performance of any trading strategy or methodology is not necessarily indicative of future results. Past performance is no guarantee of future results and should not be interpreted as a forecast of future performance. We make no promise as to the performance of the account and while the investment objective is major capital appreciation over time no representation is being made or implied that any account will or is likely to achieve profit. The value of your investments can decrease as well as increase and, as such, funds invested should constitute risk capital. The risk of loss in trading commodities and options can be substantial. You should therefore carefully consider whether such trading is suitable for you in light of your financial condition. The high degree of leverage that is often obtainable in commodity trading can work against you as well as for you. The use of leverage can lead to large losses as well as gains. You should carefully consider whether your financial condition permits you to participate in futures trading. In so doing, you should be aware that futures and options trading can quickly lead to large losses as well as gains. Such trading losses can sharply reduce the value of your investment. All information provided on these pages is for fair use. Normal copyright protections apply to all commercial use of any documents or information. We are not responsible for any loss due to inaccuracies in the information provided. Nothing presented here should be construed as investment advice or recommendations.
USD/INR short: section fast transactionsHi everyone! On the week chart USD/INR pair moves in an upside channel towards its lower bound. And also now the price overcame the important trend line down and tested it from below. Now some indicators indicate continuation of the movement down. Therefore I expect price movement down at least to two following supports (my purposes).
Short on 73.3470
TP1 = 72.76
TP2 = 72.52
Information provided is only educational and should not be used to take action in the market.
This section is intended for short-term speculation. Be ready to leave a position at any time.
USDINR #US #USD #UnitedStates #Indian #Rupee 60 minute #shortA bat pattern seem to be maturing on the last part of it's journey, from leg C to leg D.
Sell from 75.948 (approx) for a R/R of 2.08% on T.P 1.
Sell again from 75.948 (approx) for a R/R of 3.31% on T.P 2.
Thanks & good luck in all your trading.
Monthly Chart of USDINRMonthly Chart of USDINR:
As seen from the Monthly Chart of USDINR, the currency is trading in the Rising Channel pattern since 2013 to till date.
In the month of April-2020 the currency has hit the Upper part of Channel around the levels of 76.50-77.00 and retraced.
The currency has formed a Shooting star Candlestick pattern around the resistance levels on Monthly chart.
If this pattern is to hold then we may see appreciation in the Currency.
1st Support lies around the levels of 74.00-74.50 and if it is broken then 2nd support lies around the levels of 72.00-72.50.
Resistance lies around the levels of 76.50-77.00
For educational purpose
Short and then long on USDINRUSDINR is looking to complete a flat pattern. The forecast has been shown.


