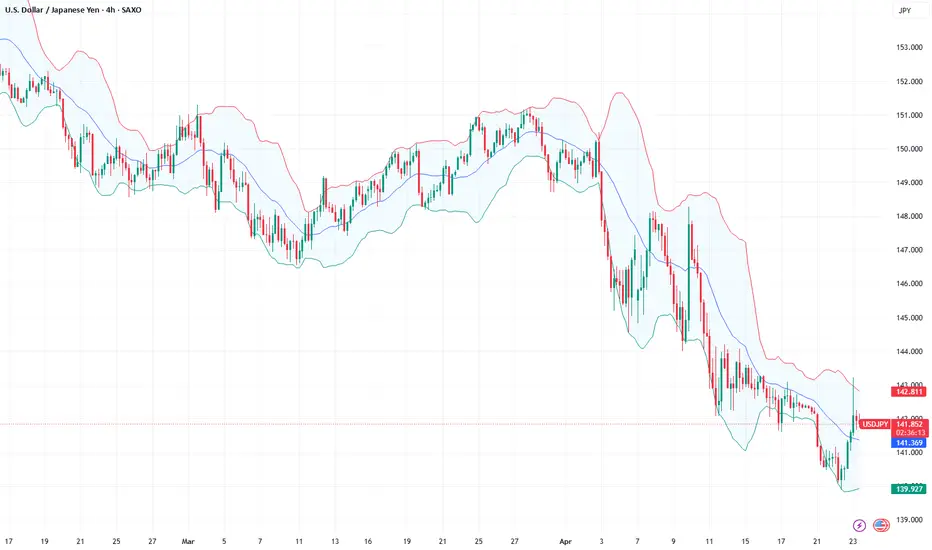
Fundamental Market Analysis for April 23, 2025 USDJPYThe Japanese yen (JPY) declined against its US counterpart for a second straight day on Wednesday and retreated further from the multi-month peak reached the previous day. The Trump administration officials' comforting comments on US-China trade talks triggered a sharp rebound in global risk sentiment, which in turn had a strong impact on traditional safe-haven assets, including the yen. Moreover, a slight recovery in the US dollar (USD) from multi-year lows, supported by easing concerns over Federal Reserve (Fed) independence, pushed the USD/JPY pair to a one-week high, a level above 143.000 during the Asian session.
Growing optimism that the US and Japan are moving closer to a temporary trade agreement is helping the yen, which reacted weakly to unimpressive domestic PMIs, to pause its intraday decline. In addition, strengthening expectations that the Bank of Japan (BoJ) will continue to raise interest rates in 2025 is keeping JPY bears from betting aggressively. Meanwhile, investors are losing confidence in the US economy amid Trump's rapidly shifting stance on trade policy. This, as well as bets that the Fed will soon resume its rate-cutting cycle, is holding back the dollar and taking the USD/JPY pair below 142.000 in the last hour.
Trading recommendation: SELL 141.700, SL 142.100, TP 140.500
USDJPY
USDJPY Potential DownsidesHey Traders, in today's trading session we are monitoring USDJPY for a selling opportunity around 141.600 zone, USDJPY is trading in downtrend and currently is in a correction phase in which it is approaching the trend at 141.600 support and resistance area.
Trade safe, Joe.

Potential bullish rise?USD/JPY is falling towards the support level which is a pullback support and could bounce from this level to our take profit.
Entry: 140.98
Why we like it:
There is a pullback support level.
Stop loss: 140.24
Why we like it:
There is a pullback support level that lines up with the 78.6% Fibonacci retracement.
Take profit: 142.41
Why we like it:
There is a pullback resistance level that lines up with the 78.6% Fibonacci retracement.
Enjoying your TradingView experience? Review us!
Please be advised that the information presented on TradingView is provided to Vantage (‘Vantage Global Limited’, ‘we’) by a third-party provider (‘Everest Fortune Group’). Please be reminded that you are solely responsible for the trading decisions on your account. There is a very high degree of risk involved in trading. Any information and/or content is intended entirely for research, educational and informational purposes only and does not constitute investment or consultation advice or investment strategy. The information is not tailored to the investment needs of any specific person and therefore does not involve a consideration of any of the investment objectives, financial situation or needs of any viewer that may receive it. Kindly also note that past performance is not a reliable indicator of future results. Actual results may differ materially from those anticipated in forward-looking or past performance statements. We assume no liability as to the accuracy or completeness of any of the information and/or content provided herein and the Company cannot be held responsible for any omission, mistake nor for any loss or damage including without limitation to any loss of profit which may arise from reliance on any information supplied by Everest Fortune Group.


Yen extends gains, BOJ Core CPI lower than expectedThe Japanese yen has rallied for a third straight day. In the European session, USD/JPY is trading at 140.38, down 0.33% on the day. The yen has climbed 1.3% since Thursday, as the US dollar is under pressure against the major currencies.
BoJ Core CPI, a key inflation indicator, remained at 2.2% for a third consecutive month in March, shy of the forecast of 2.4%. This follows Japan's National Core CPI, which rose 3.2% y/y, matching expectations but higher than the 3.0% gain in February. National CPI eased to 3.6%, down from 3.7% in February and below the market estimate of 3.7%.
The inflation data comes a week before the BoJ's policy meeting next week. The central bank has signaled that it will continue to raise interest rates as wages and inflation have been rising. However, the risks to inflation and growth from US tariffs have muddied the rate outlook and the BoJ may decide to push off another hike until later in the year.
The finance ministers of Japan and the US will meet later this week, as Tokyo looks to carve out some tariff exemptions. The BoJ is likely to sit tight and see if the talks lead to a breakthrough. The US is expected to bring up the exchange rate, as President Trump has accused Japan of deliberately keeping the yen weak in order to protect its export sector.
There are no key releases out of the US today, but we'll hear from three FOMC members later today. The markets have priced in a rate cut in May at 10%, with a 62% probability of a rate cut in June.

USD/JPY Analysis: Exchange Rate Falls Below 140 Yen per DollarUSD/JPY Analysis: Exchange Rate Falls Below 140 Yen per Dollar Today
As shown on the USD/JPY chart today, the exchange rate between the US dollar and Japanese yen has fallen below 140 yen per dollar – marking the first time this has occurred in 2025. Since the beginning of the year, the rate has dropped by approximately 11%.
Among the main driving factors is the White House's tariff policy, which has triggered a sell-off in US government bonds and a weakening of the dollar. One of the more recent developments includes the release of the Consumer Price Index report by the Bank of Japan, which revealed that the CPI remained steady at 2.2%, despite analysts (according to ForexFactory) forecasting a rise to 2.4%.
It’s possible that, due to the lack of inflationary pressure in Japan, the yen is in a relatively stronger position compared to the US currency, where concerns persist that trade wars and Trump’s push for lower interest rates may lead to a spike in inflation and a devaluation of the dollar.
Technical Analysis of the USD/JPY Chart
It’s worth noting that the psychological level of 140 yen per dollar has acted as key support since late 2023. On the rare occasions when the rate has dipped below this mark, the bulls have soon regained confidence, prompting a reversal.
It’s quite possible we may witness a similar attempt on the USD/JPY chart in the coming weeks or even days. However, the current outlook remains bearish, as the price has broken below the Descending Wedge pattern (marked with black lines), indicating that supply is outweighing demand.
This article represents the opinion of the Companies operating under the FXOpen brand only. It is not to be construed as an offer, solicitation, or recommendation with respect to products and services provided by the Companies operating under the FXOpen brand, nor is it to be considered financial advice.

USD/JPY in Free Fall: What’s Behind the Break Below 140?🔍 Technical Analysis – USD/JPY
The weekly chart shows a sharp rejection in the macro zone between 155–158, where strong supply is present (highlighted in red). After brushing historical highs, USD/JPY experienced a vertical drop down to 140, decisively breaking through the key zone at 148–146.
Price has now broken the weekly structure and is approaching an area that previously triggered significant rallies (blue zone between 138–141). Monthly support is in danger, with the RSI deeply in oversold territory, but no clear reversal signals just yet.
📊 COT Report – USD Index
Asset Managers: Slight recovery on long positions, but still in neutral territory.
Leverage Money: Increasing net shorts, indicating speculative bets against the dollar.
The divergence between the falling USD Index and speculative positions confirms a growing lack of confidence in the greenback.
📊 COT Report – JPY Futures
Asset Managers: Strong increase in long positions on the yen since December 2024.
Leverage Money: Reinforcing long bias since February 2025.
This confirms that institutional players are accumulating yen, possibly anticipating BoJ interventions or a broader flight-to-safety.
💥 Trade Outlook
USD/JPY is in full bearish breakout mode. If the 140 level breaks decisively, the next technical targets are:
137.00 → historical mid-level support
134.00 → base of the 2023 structure
Keep an eye on the RSI: a bullish divergence with strong volume could trigger a technical rebound. But as long as the overall sentiment remains strongly risk-off, every rally is a selling opportunity.

Yen surges to five-month high as US dollar under pressureThe Japanese yen came flying out of the gates on Monday. In the European session, USD/JPY is trading at 141.00, down 0.79%. Earlier the yen strengthened to 140.47, its strongest level since Sep. 2024.
The US dollar has posted losses against the major currencies on Monday, including against the yen. Investors gave the US dollar a thumbs down after President Trump's top economic advisor said that Trump was considering the dismissal of Fed Chair Jerome Powell.
Trump has been increasingly critical of Powell for not lowering interest rates and said last week that "Powell's termination cannot come fast enough". Trump fired his latest salvo after Powell said that US tariffs would raise inflation and that the Fed could find itself having to balance keeping a lid on inflation and supporting economic growth. Powell added that tariffs are "likely to move us further away from our goals".
Powell has insisted that he isn't going anywhere and will serve until the end of his term in May 2026. Can Trump legally fire Powell? That is a complicated legal question, but the markets aren't waiting for an answer and the US dollar has retreated.
Trump's attacks on Powell threaten the independence of the US central bank and is eroding confidence in the US dollar. The dollar is also under pressure from Trump's tariff policy, which has dampened the confidence of foreign investors.
USD/JPY has pushed below support at 141.16. Below, there is support at 140.14.
There is resistance at 142.62 and 143.64

USD_JPY SWING LONG|
✅USD_JPY is set to retest a
Strong support level below at 139.559
After trading in a local downtrend from some time
Which makes a bullish rebound a likely scenario
With the target being a local resistance above at 141.384
LONG🚀
✅Like and subscribe to never miss a new idea!✅
Disclosure: I am part of Trade Nation's Influencer program and receive a monthly fee for using their TradingView charts in my analysis.

Japanese Yen seems poised to appreciate further against weaker UFrom a technical perspective, the daily Relative Strength Index (RSI) is already flashing slightly oversold conditions and warrants some caution for bearish traders. Hence, it will be prudent to wait for some near-term consolidation or a modest bounce before positioning for an extension of the USD/JPY pair's well-established downtrend witnessed over the past three months or so.
In the meantime, attempted recovery might now confront some resistance near the 141.60-141.65 region. This is followed by the 142.00 round figure and the 142.40-142.45 hurdle, above which a fresh bout of a short-covering move could lift the USD/JPY pair to the 143.00 mark en route to the 143.25-143.30 zone. Any further move up, however, might still be seen as a selling opportunity.
On the flip side, a sustained break and acceptance below the 141.00 mark could be seen as a fresh trigger for bearish traders and makes the USD/JPY pair vulnerable. The subsequent downfall below the 140.45-140.40 intermediate support might expose the 140.00 psychological mark. The downward trajectory could extend to the 2024 yearly swing low, around the 139.60-139.55 region.

USD/JPY H4 | Downtrend to extend further?USD/JPY is rising towards a pullback resistance and could potentially reverse off this level to drop lower.
Sell entry is at 141.82 which is a pullback resistance.
Stop loss is at 143.20 which is a level that sits above an overlap resistance.
Take profit is at 139.85 which is a swing-low support.
High Risk Investment Warning
Trading Forex/CFDs on margin carries a high level of risk and may not be suitable for all investors. Leverage can work against you.
Stratos Markets Limited (tradu.com):
CFDs are complex instruments and come with a high risk of losing money rapidly due to leverage. 63% of retail investor accounts lose money when trading CFDs with this provider. You should consider whether you understand how CFDs work and whether you can afford to take the high risk of losing your money.
Stratos Europe Ltd (tradu.com):
CFDs are complex instruments and come with a high risk of losing money rapidly due to leverage. 63% of retail investor accounts lose money when trading CFDs with this provider. You should consider whether you understand how CFDs work and whether you can afford to take the high risk of losing your money.
Stratos Global LLC (tradu.com):
Losses can exceed deposits.
Please be advised that the information presented on TradingView is provided to Tradu (‘Company’, ‘we’) by a third-party provider (‘TFA Global Pte Ltd’). Please be reminded that you are solely responsible for the trading decisions on your account. There is a very high degree of risk involved in trading. Any information and/or content is intended entirely for research, educational and informational purposes only and does not constitute investment or consultation advice or investment strategy. The information is not tailored to the investment needs of any specific person and therefore does not involve a consideration of any of the investment objectives, financial situation or needs of any viewer that may receive it. Kindly also note that past performance is not a reliable indicator of future results. Actual results may differ materially from those anticipated in forward-looking or past performance statements. We assume no liability as to the accuracy or completeness of any of the information and/or content provided herein and the Company cannot be held responsible for any omission, mistake nor for any loss or damage including without limitation to any loss of profit which may arise from reliance on any information supplied by TFA Global Pte Ltd.
The speaker(s) is neither an employee, agent nor representative of Tradu and is therefore acting independently. The opinions given are their own, constitute general market commentary, and do not constitute the opinion or advice of Tradu or any form of personal or investment advice. Tradu neither endorses nor guarantees offerings of third-party speakers, nor is Tradu responsible for the content, veracity or opinions of third-party speakers, presenters or participants.

USD/JPY. A simple, multi-year trend breakthroughThe Americans have become so utterly unpredictable, Dollar contunues its crash.
The main USDJPY graph indicates on a multi-year trend breakthrough.

USDJPY Outlook – Bearish Continuation or Bullish Reversal??In this analysis, I'm breaking down the USDJPY structure starting from the 4H to identify the overall market direction (Bearish/Sells), then zooming into the 1H to fine-tune potential trade setups.
On the 4H timeframe, we’re assessing whether the recent bearish momentum is likely to continue or if price action is showing early signs of a bullish reversal. The LOW created at 141.800 level is our first target IF we continue to sell as its creating that LowerLow.
IF price closes bullish above 142.500, I will switch sides and look for potential buys.
On the 1H timeframe, I’m watching for a bullish liquidity sweep below141.888, followed by a clear break of structure to the upside on the 15m or 1H for more confirmation. That would indicate smart money accumulation and a potential shift in market sentiment—giving me confirmation to start looking for long setups.
🚀 Give me a boost and follow for upcoming $niper entries this week! 🦇🔥
CMCMARKETS:USDJPY

Bullish bounce off pullback support?USD/JPY is falling towards the pivot which has been identified as a pullback support and could bounce to the 1st resistance which is a pullback resistance.
Pivot: 140.84
1st Support: 137.22
1st Resistance: 144.98
Risk Warning:
Trading Forex and CFDs carries a high level of risk to your capital and you should only trade with money you can afford to lose. Trading Forex and CFDs may not be suitable for all investors, so please ensure that you fully understand the risks involved and seek independent advice if necessary.
Disclaimer:
The above opinions given constitute general market commentary, and do not constitute the opinion or advice of IC Markets or any form of personal or investment advice.
Any opinions, news, research, analyses, prices, other information, or links to third-party sites contained on this website are provided on an "as-is" basis, are intended only to be informative, is not an advice nor a recommendation, nor research, or a record of our trading prices, or an offer of, or solicitation for a transaction in any financial instrument and thus should not be treated as such. The information provided does not involve any specific investment objectives, financial situation and needs of any specific person who may receive it. Please be aware, that past performance is not a reliable indicator of future performance and/or results. Past Performance or Forward-looking scenarios based upon the reasonable beliefs of the third-party provider are not a guarantee of future performance. Actual results may differ materially from those anticipated in forward-looking or past performance statements. IC Markets makes no representation or warranty and assumes no liability as to the accuracy or completeness of the information provided, nor any loss arising from any investment based on a recommendation, forecast or any information supplied by any third-party.

Bullish bounce off major support level?USD/JPY is falling towards the support level which is a pullback support that lines up with the 78.6% Fibonacci projection and could bounce from this level to our take profit.
Entry: 140.82
Why we like it:
There is a pullback support level that lines up with the 78.6% Fibonacci projection.
Stop loss: 137.37
Why we like it:
There is a pullback support level that is slightly above the 100% Fibonacci projection.
Take profit: 144.77
Why we like it:
There is an overlap resistance level.
Enjoying your TradingView experience? Review us!
Please be advised that the information presented on TradingView is provided to Vantage (‘Vantage Global Limited’, ‘we’) by a third-party provider (‘Everest Fortune Group’). Please be reminded that you are solely responsible for the trading decisions on your account. There is a very high degree of risk involved in trading. Any information and/or content is intended entirely for research, educational and informational purposes only and does not constitute investment or consultation advice or investment strategy. The information is not tailored to the investment needs of any specific person and therefore does not involve a consideration of any of the investment objectives, financial situation or needs of any viewer that may receive it. Kindly also note that past performance is not a reliable indicator of future results. Actual results may differ materially from those anticipated in forward-looking or past performance statements. We assume no liability as to the accuracy or completeness of any of the information and/or content provided herein and the Company cannot be held responsible for any omission, mistake nor for any loss or damage including without limitation to any loss of profit which may arise from reliance on any information supplied by Everest Fortune Group.

Weekly FOREX Forecast: Buy EUR, GBP, AUD, NZD vs USDThis is the FOREX outlook for the week of April 21 - 25th.
In this video, we will analyze the following FX markets:
USD Index
EUR
GBP
AUD
NZD
CAD
CHF
JPY
Not a lot of movement last week, as price traded in a small range. May see more of the same this coming week, as there are no major news events planned. The USD is still weak, and there may be opportunities to buy against it in the EUR, GBP, AID, NZD, CAD, CHF, AND JPY.
Wait for good confirmation before taking valid buy setups!
Enjoy!
May profits be upon you.
Leave any questions or comments in the comment section.
I appreciate any feedback from my viewers!
Like and/or subscribe if you want more accurate analysis.
Thank you so much!
Disclaimer:
I do not provide personal investment advice and I am not a qualified licensed investment advisor.
All information found here, including any ideas, opinions, views, predictions, forecasts, commentaries, suggestions, expressed or implied herein, are for informational, entertainment or educational purposes only and should not be construed as personal investment advice. While the information provided is believed to be accurate, it may include errors or inaccuracies.
I will not and cannot be held liable for any actions you take as a result of anything you read here.
Conduct your own due diligence, or consult a licensed financial advisor or broker before making any and all investment decisions. Any investments, trades, speculations, or decisions made on the basis of any information found on this channel, expressed or implied herein, are committed at your own risk, financial or otherwise.

CHFJPY TECHNICAL AND FUNADEMENTALS DETAILS ANALYSISCHFJPY has just broken out of a long-term descending channel on the daily chart, currently trading near 174.09. This breakout is technically significant, as it marks the end of a prolonged downtrend and suggests the beginning of a potential bullish reversal. The price action shows a clean breakout above the upper channel resistance, followed by a healthy retest—textbook price behavior when momentum shifts to the upside. With this structure flip, we are now positioning for a continuation towards the 182.40 zone, which aligns with a previous key resistance and measured move projection.
This breakout is supported by strong fundamentals. The Swiss Franc remains firm, driven by Switzerland’s resilient economic data and the Swiss National Bank’s cautious monetary stance. Meanwhile, the Japanese Yen continues to struggle as the Bank of Japan maintains its ultra-loose policy, despite recent signs of inflation picking up. The yield differential and risk-on sentiment are weighing heavily on JPY, making it an ideal quote currency for this bullish CHF move. Traders are increasingly favoring CHFJPY in the current macro landscape due to this divergence.
What makes this setup even more attractive is the clean technical structure paired with a favorable risk-reward ratio. The stop below the retest area around 171.63 offers tight risk management, while the upside potential toward 182.40 presents a strong 1:3+ R/R swing opportunity. These types of breakouts—especially after extended consolidation—often lead to trend-following momentum plays that institutions favor.
CHFJPY is now on many watchlists across TradingView due to this breakout from a descending channel, which is a highly searched pattern by technical traders. This pair is poised to deliver a profitable swing trade backed by both technical strength and macro alignment. If momentum continues, we could see a strong bullish leg throughout Q2.

USDJPY – Strong Bounce Incoming from Key Support?Price has tapped into a major support zone that’s held strong since early 2024. With confluence from the Fibonacci 0.618–0.65 retracement overhead, we could see a sharp bullish reversal targeting that region.
🟧 Strong support – historically reactive
📈 Potential bullish reversal in play
📊 Fib confluence at 152 – key reaction area
⏳ Watching for confirmation signs before entry
A clean structure here—could turn into a solid mid-term long setup.
Thoughts? Reversal or continuation lower?

DeGRAM | USDJPY Reached the Lower Channel Boundary📊 Technical Analysis
Descending channel
USD/JPY is trading within a downward channel, recently bouncing off support near 142.00.
Key resistance
The upper boundary near 146 serves as key resistance; a breakout would indicate a trend reversal.
Predictive scenario
Price may retest resistance with potential for further upside if bullish momentum holds.
💡 Fundamental Analysis
The Fed maintains high rates, while the BoJ remains dovish. The yield gap favors USD strength. Steady US data supports recovery, while global risks may limit JPY demand.
✨ Summary
A bounce from support within the channel aligns with USD-positive fundamentals. Watch 146 for a breakout signal.
-------------------
Share your opinion in the comments and support the idea with like. Thanks for your support!

USDCAD and USDJPY Analysis todayHello traders, this is a complete multiple timeframe analysis of this pair. We see could find significant trading opportunities as per analysis upon price action confirmation we may take this trade. Smash the like button if you find value in this analysis and drop a comment if you have any questions or let me know which pair to cover in my next analysis.

18-04-25 USDJPY Pivot LevelSimple and yet effective. Price did retrace from upper pivot level yesterday.
Today the upper trend should continue with bounce off lower pivot of 142.194, though most banks are on holiday

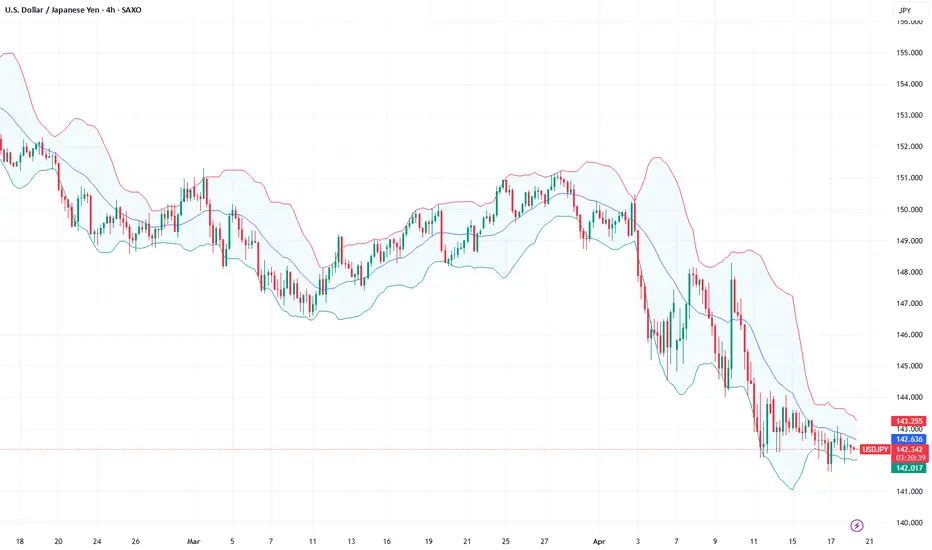
Fundamental Market Analysis for April 18, 2025 USDJPYThe USD/JPY pair is down to 142.25 in thin trading session on Friday. The US Dollar (USD) is declining against the Japanese Yen (JPY) amid concerns over the economic impact of tariffs.
Data released by the Statistics Bureau of Japan on Friday showed that the national consumer price index (CPI) rose 3.6% in March, up from the previous reading of 3.7%. Meanwhile, the national CPI excluding fresh food was 3.2% y/y in March, up from 3.0% previously. The reading was in line with the market consensus.
Finally, the consumer price index excluding fresh food and energy rose 2.9% y/y in March vs. the previous reading of 2.6%. The Japanese Yen remains strong against the US Dollar as an immediate reaction to Japanese inflation data.
However, JPY gains may be limited as Bank of Japan (BoJ) officials signalled a pause in the consideration of interest rate hikes, emphasising the need to monitor uncertainty heightened by US tariff measures.
Economic data from the US on Thursday was mixed. US initial jobless claims fell to their lowest level in two months, signalling a stable labour market. In addition, the Philadelphia Fed index fell short of expectations, a warning shot from the manufacturing sector.
Trade recommendation: SELL 142.05, SL 143.40, TP 139.80
6J1!: Yen Steady as Dollar Recovers: Reversal WatchThe Japanese Yen maintains its strength in relation to the recovering US Dollar. However, recent improvements in global risk sentiment are beginning to weaken the JPY's appeal as a safe-haven currency. At this point, the Yen is positioned within a significant supply zone, where we are closely monitoring for potential reversal opportunities.
According to the latest COT report, retailers are predominantly holding long positions, which adds an interesting dynamic to the current market environment. As we evaluate the situation, our focus is on the possibility of a reversal, especially as the US Dollar shows signs of regaining momentum. This scenario could lead to notable shifts in currency dynamics, and we are keen to see how these factors will unfold in the near term.
✅ Please share your thoughts about 6J1! in the comments section below and HIT LIKE if you appreciate my analysis. Don't forget to FOLLOW ME; you will help us a lot with this small contribution.
