USDJPY
Heading into overlap resistance?USD/JPY is rising towards the resistance level which is an overlap resistance that lines up with the 50% Fibonacci retracement and could reverse from this level to our take profit.
Entry: 149.13
Why we like it:
There is an overlap resistance level that line sup with the 50% Fibonacci retracement.
Stop loss: 149.83
Why we like it:
There is a pullback resistance level that is slightly above the 78.6% Fibonacci retracement.
Take profit: 148.19
Why we like it:
There is a pullback support level.
Enjoying your TradingView experience? Review us!
Please be advised that the information presented on TradingView is provided to Vantage (‘Vantage Global Limited’, ‘we’) by a third-party provider (‘Everest Fortune Group’). Please be reminded that you are solely responsible for the trading decisions on your account. There is a very high degree of risk involved in trading. Any information and/or content is intended entirely for research, educational and informational purposes only and does not constitute investment or consultation advice or investment strategy. The information is not tailored to the investment needs of any specific person and therefore does not involve a consideration of any of the investment objectives, financial situation or needs of any viewer that may receive it. Kindly also note that past performance is not a reliable indicator of future results. Actual results may differ materially from those anticipated in forward-looking or past performance statements. We assume no liability as to the accuracy or completeness of any of the information and/or content provided herein and the Company cannot be held responsible for any omission, mistake nor for any loss or damage including without limitation to any loss of profit which may arise from reliance on any information supplied by Everest Fortune Group.
USD/JPY - Breakdown Confirmation & Potential DeclineUSD/JPY - Breakdown Confirmation & Potential Decline
Chart Overview:
The USD/JPY price action has broken down from a previously established ascending channel.
A lower high formation suggests weakening bullish momentum, indicating a potential continuation of the downtrend.
The key support zones are marked below, with the price likely to move towards these levels if bearish momentum persists.
Technical Analysis:
Breakdown Zone: The price has breached the lower trendline of the ascending channel, confirming a bearish breakdown.
Resistance Levels: The price faces resistance around 0.0067786 - 0.0068488.
Support Targets: Possible downside targets at 0.0066848, 0.0066012, and 0.0065720.
Bearish Confirmation: A retest of the breakdown level followed by rejection strengthens the bearish outlook.
Trade Consideration:
Bearish Bias: A short position could be considered if the price fails to reclaim the broken trendline.
Stop Loss: Above the breakdown zone to avoid potential fakeouts.
Target Levels: Lower support zones for potential take-profit areas.
Conclusion:
The breakdown from the rising channel suggests a shift in market sentiment, with a bearish move likely. Traders should monitor price action for further confirmations.
USDJPY My Opinion! SELL!
My dear friends,
My technical analysis for USDJPY is below:
The market is trading on 149.96 pivot level.
Bias - Bearish
Technical Indicators: Both Super Trend & Pivot HL indicate a highly probable Bearish continuation.
Target - 148.72
Recommended Stop Loss - 150.69
About Used Indicators:
A pivot point is a technical analysis indicator, or calculations, used to determine the overall trend of the market over different time frames.
———————————
WISH YOU ALL LUCK
USD/JPY Analysis: Dollar Weakens After Fed DecisionUSD/JPY Analysis: Dollar Weakens After Fed Decision
Yesterday, the Federal Reserve announced its interest rate decision, which, as expected, remained unchanged. Fed Chair Jerome Powell emphasised that there is no rush to cut rates amid uncertainty surrounding US inflation and the tariff policies implemented by the Trump administration.
This key announcement triggered volatility in financial markets, notably:
→ US stock indices rose;
→ the US dollar weakened, which was evident in currency (and cryptocurrency) charts involving USD pairs.
The most significant movement occurred in the USD/JPY chart, as the Bank of Japan was also active yesterday. While it also left interest rates unchanged, it acknowledged growing uncertainty around Japan’s economy and added a new reference to the "changing trade environment."
Technical Analysis of USD/JPY
As we noted on 21 February when analysing the Japanese yen’s exchange rate against the US dollar:
→ Price fluctuations are forming a downward channel (marked in red).
→ The former support at the lower boundary of the blue channel may now act as resistance.
Since then, the price has:
→ Tested the breakout level (indicated by an arrow) before continuing to decline within the channel, confirming its relevance.
→ Reached the lower boundary of the channel and rebounded upwards from the 147 yen per dollar level.
Given that the price is closely interacting with the channel lines and is currently around its median, it suggests that supply and demand are relatively balanced under these conditions. This is further supported by the fact that neither the Fed nor the Bank of Japan introduced surprises, leaving interest rates unchanged.
This article represents the opinion of the Companies operating under the FXOpen brand only. It is not to be construed as an offer, solicitation, or recommendation with respect to products and services provided by the Companies operating under the FXOpen brand, nor is it to be considered financial advice.
Dollar Weakens Post-Fed, Lifting Yen Beyond 148.5The yen strengthened past 148.5 per dollar, rising for a second session as the dollar weakened after the Fed reaffirmed two rate cuts this year. Fed Chair Powell downplayed Trump’s tariffs as short-lived. The BoJ kept rates at 0.5% on Wednesday, adopting a cautious stance amid global risks, especially US tariffs. It also emphasized monitoring forex markets and their impact on the economy.
Key resistance is at 150.30, with further levels at 152.00 and 154.90. Support stands at 147.00, followed by 145.80 and 143.00.
USDJPYKey Levels:
Support Levels:
147.710 – First support zone (potential buy area).
147.230 – Stronger support level where price may react if it continues downward.
Resistance Levels:
149.500 – Key resistance level if the price reverses bullish.
Trade Setup:
A short position is anticipated with entry after a pullback towards a minor FVG.
Take Profit: Near 147.710 or deeper at 147.230.
Stop Loss: Likely above the broken trendline or at a key resistance zone (149.500).
A long position could be considered at 147.710 or 147.230 if price shows bullish signals.
USD/CAD: Rebound Above 1.4265 or Imminent Drop?📊 Market Context
The USD/CAD exchange rate has shown recent volatility with a significant surge followed by a retracement phase. The market is reacting to expectations regarding decisions from the Federal Reserve and the Bank of Canada (BoC), as well as fluctuations in oil prices, a key factor for the Canadian dollar.
🔍 Technical Analysis
The chart analysis highlights the following key levels:
Main Resistance: 1.4521 → Located in the upper zone of the chart, this level could act as a barrier to further bullish movements.
Key Supports: 1.4333 - 1.4265 - 1.4239 → These levels have previously acted as bounce points and could provide a base for price recovery.
Market Structure: The price reacted with a strong green candle after testing the lower support area, followed by a correction phase.
Bullish Momentum: If the price holds above 1.4265, it could attempt another push towards 1.4521.
📌 Potential Bullish Scenario: If the price remains above 1.4265, we could see another push towards 1.45 and beyond.
📌 Bearish Scenario: A break below 1.4239 could trigger a sharper decline towards the 1.41 - 1.40 range.
🌍 Fundamental Analysis
Federal Reserve: The Fed is assessing the impact of its monetary policies, with markets speculating on a potential rate cut by mid-year.
Bank of Canada: The BoC maintains a cautious approach, monitoring inflation and the labor market.
Oil Prices: The CAD is correlated with oil prices, so an increase in crude oil could strengthen the Canadian dollar and push USD/CAD lower.
🎯 Conclusion
Main Bias: Bullish above 1.4265, targeting 1.45.
Trend Invalidation: Below 1.4239, a potential downward correction could occur.
Fundamental Market Analysis for March 20, 2025 USDJPYThe Japanese yen (JPY) attracted buyers for the second consecutive day and strengthened to a new one-week high against its US counterpart during the Asian session on Thursday. Expectations that strong wage growth could boost consumer spending and contribute to higher inflation give the Bank of Japan (BoJ) room to raise interest rates further. This has led to a recent sharp narrowing of the rate differential between Japan and other countries, which continues to support the low-yielding yen.
In addition, uncertainty over US President Donald Trump's trade policy and its impact on the global economy, as well as geopolitical risks and the political crisis in Turkey, are contributing to inflows into the Yen. The US Dollar (USD), on the other hand, is struggling to gain meaningful momentum amid increased economic uncertainty amid US President Donald Trump's trade tariffs. This, in turn, is weighing on the USD/JPY pair and contributing to the intraday decline.
However, interest rate differentials, the Bank of Japan's loose monetary policy, the trade balance differential and global market sentiment put pressure on the Japanese yen. The further direction of the USD/JPY pair lies on the upside.
Trading recommendation: BUY 148.400, SL 147.600, TP 150.100
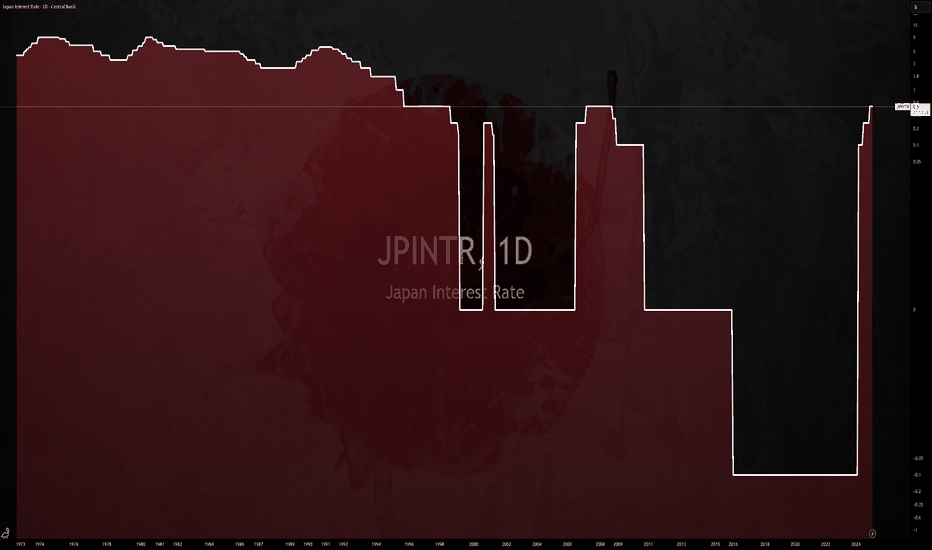
$JPINTR -Japan's Interest Rates (March/2025)ECONOMICS:JPINTR
March/2025
source: Bank of Japan
-The Bank of Japan (BoJ) kept its key short-term interest rate at around 0.5% during its March meeting, maintaining it at its highest level since 2008 and in line with market expectations.
The unanimous decision followed the central bank’s third rate hike in January and came before the U.S. Federal Reserve’s rate announcement.
The board took a cautious stance, focusing on assessing the impact of rising global economic risks on Japan’s fragile recovery.
The BoJ pointed to ongoing uncertainties in the domestic economic outlook amid higher U.S. tariffs and headwinds from overseas conditions.
While the Japanese economy had recovered moderately, some weaknesses remained.
Private consumption continued to grow, helped by wage hikes, even as cost pressures persisted.
However, exports and industrial output were mostly flat.
Inflation ranged between 3.0% and 3.5% yearly, driven by higher service prices.
Inflation expectations increased moderately, with underlying CPI projected to rise gradually.
USDJPY Breakout And Potential RetraceHey Traders, in today's trading session we are monitoring USDJPY for a selling opportunity around 149.300 zone, USDJPY was trading in an uptrend and successfully managed to break it out. Currently is in a correction phase in which it is approaching the retrace area at 149.300 support and resistance area.
Trade safe, Joe.
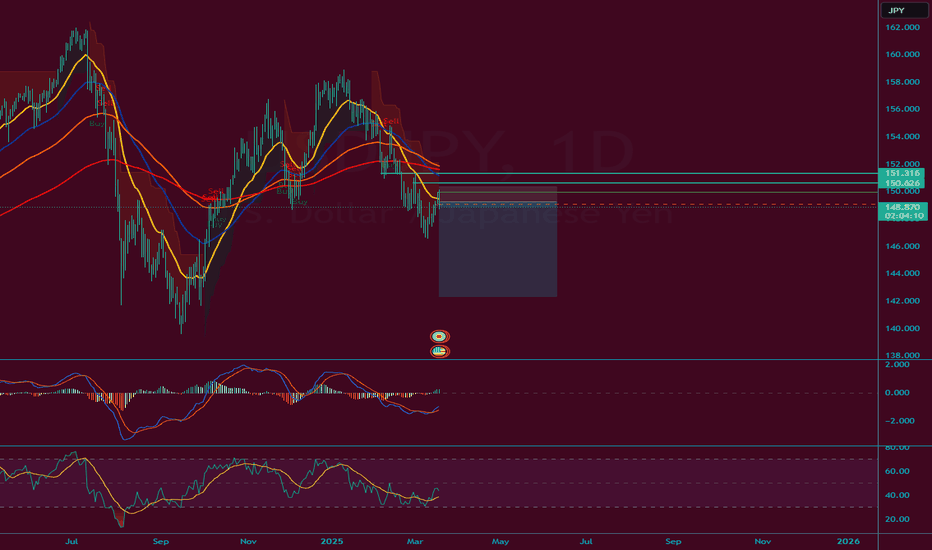
USDJPY bearish trend continuation below 150.60The USDJPY currency pair remains bearish, following the prevailing downtrend. Recent price action shows resistance at the 150.60 level, which marks the current intraday swing high.
Key Levels:
Resistance: The critical resistance level to watch is 150.60. A rally to this level followed by a bearish rejection could signal further downside momentum.
Support: On the downside, key support levels are positioned at 148.15, 147.00, and 146.30, marking potential bearish targets over the longer term.
Bullish Scenario: If the pair breaks above the 150.60 resistance and achieves a daily close above it, the bearish outlook would be invalidated. This would open the door for further rallies, with resistance levels at 151.46 and 152.36 acting as possible targets.
Conclusion: The bearish sentiment remains strong as long as 150.60 holds as resistance. Traders should be cautious of rallies and look for bearish rejections near this level. A confirmed breakout above 150.60 would signal a potential trend reversal, favoring further upside.
This communication is for informational purposes only and should not be viewed as any form of recommendation as to a particular course of action or as investment advice. It is not intended as an offer or solicitation for the purchase or sale of any financial instrument or as an official confirmation of any transaction. Opinions, estimates and assumptions expressed herein are made as of the date of this communication and are subject to change without notice. This communication has been prepared based upon information, including market prices, data and other information, believed to be reliable; however, Trade Nation does not warrant its completeness or accuracy. All market prices and market data contained in or attached to this communication are indicative and subject to change without notice.
USDJPY Analysis todayHello traders, this is a complete multiple timeframe analysis of this pair. We see could find significant trading opportunities as per analysis upon price action confirmation we may take this trade. Smash the like button if you find value in this analysis and drop a comment if you have any questions or let me know which pair to cover in my next analysis.
USDJPY Trading strategyThe USDJPY is currently at a critical level, with the price fluctuating around 149.00. The resistance level above is at 150.00, and if broken through, it may further test 151.00. The support level below is at 148.50, and if it falls below, it may drop to 148.00. Recently, the market has been focusing on the monetary policy trends of the Federal Reserve and the Bank of Japan. The strengthening of the US dollar and the weakness of the Japanese yen may push USDJPY higher.
USDJPY Trading strategy:
buy@148.50-149.00
tp:150.00-150.50-151.00
Traders, if this concept fits your style or you have insights, comment! I'm keen to hear.
For those who are seeking professional guidance in trading trend analysis, strategy formulation, and risk management, please click below to get the daily strategy updates.
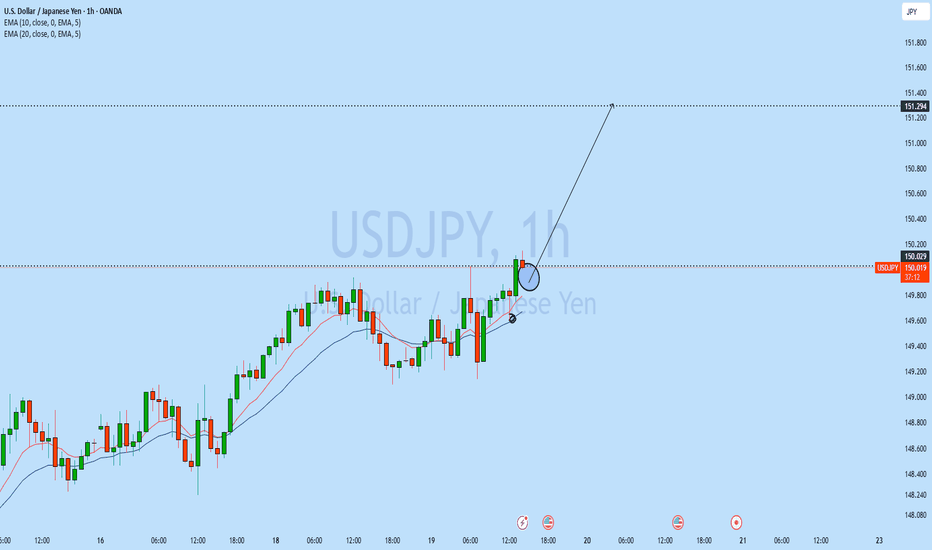
USDJPY EA MAN UPDATE > READ THE CHAPTIAN Key Observations:
Resistance Level: The price is testing a key resistance zone around 150.026, where selling pressure could emerge.
EMA Confluence: The price is currently above both the 30 EMA (149.639, red) and 200 EMA (149.339, blue), indicating an overall bullish trend.
Projected Bearish Move: A rejection from the resistance zone could lead to a pullback towards the 149.117 support level, aligning with the potential short-term bearish scenario.
If price fails to break above the resistance and starts forming lower highs, a move towards the target point at 149.117 could unfold.
USDJPY Tests Cup and Handle Formation Ahead of FOMCUSDJPY has formed a cup-and-handle pattern just below the 150 level. Today, the Bank of Japan kept interest rates steady at 0.50%. Wage negotiations so far indicate a 5.46% wage increase, which Governor Ueda described as "somewhat strong." Combined with rising food prices, the risk of further inflation has increased. Japan's inflation has remained above 2% since early 2022, and there’s no sign of that trend reversing anytime soon. In light of these factors, the BOJ is likely to consider a rate hike in May.
However, today’s market focus will shift to the FOMC. The Fed is expected to raise its inflation and unemployment forecasts while lowering its growth forecast due to the anticipated effects of new U.S. trade policies. These stagflationary pressures are likely to keep the Fed’s rates elevated for an extended period. If the dot plot shows only one rate cut this year (instead of two as projected in December), the dollar index may begin to recover.
The 150 level remains a key resistance for USDJPY. A confirmed breakout of the cup-and-handle pattern has the potential to push the pair towards the 153 level over the medium term. However, given the underlying fundamentals favoring BOJ rate hikes, any upward movement will likely be slower and more choppy, unless of course FOMC goes full hawkish.
On the downside, if the Fed is less hawkish than expected, 149 (and sliglty below)becomes the critical support to watch. A break below 149 would invalidate the bullish pattern and shift momentum to the downside for USDJPY.
USDJPY analysis todayHello traders, this is a complete multiple timeframe analysis of this pair. We see could find significant trading opportunities as per analysis upon price action confirmation we may take this trade. Smash the like button if you find value in this analysis and drop a comment if you have any questions or let me know which pair to cover in my next analysis.
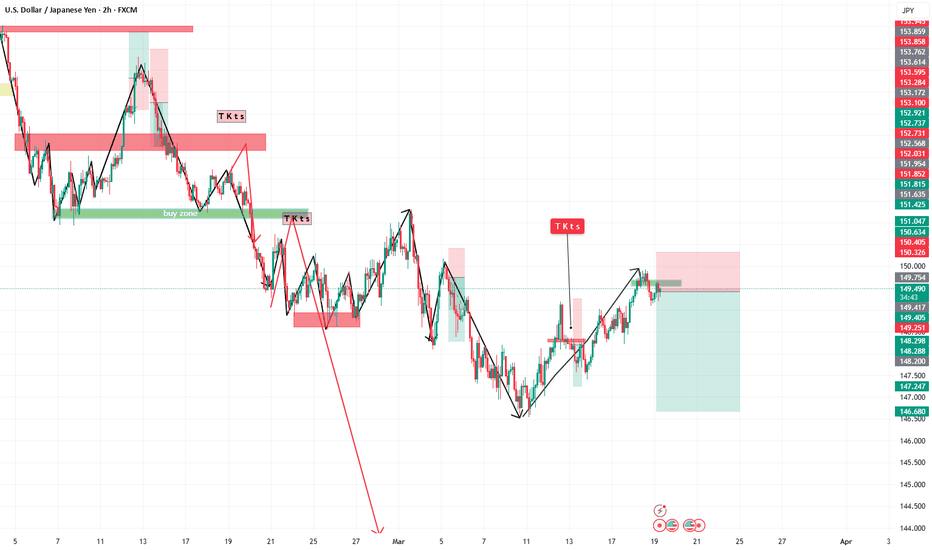
USD/JPY BEST PLACE TO SELL FROM|SHORT
USD/JPY SIGNAL
Trade Direction: short
Entry Level: 149.497
Target Level: 146.249
Stop Loss: 151.651
RISK PROFILE
Risk level: medium
Suggested risk: 1%
Timeframe: 12h
Disclosure: I am part of Trade Nation's Influencer program and receive a monthly fee for using their TradingView charts in my analysis.
✅LIKE AND COMMENT MY IDEAS✅
Analysis of USD/JPY Chart**Analysis of USD/JPY Chart**
**Chart Pattern & Market Structure**
- The chart identifies a **triangle chart pattern**, which often signals a potential breakout.
- Price has been consolidating within this structure and recently **broke above the pattern**, indicating possible bullish momentum.
**Key Technical Levels**
- **Resistance Zone (~149.8 - 150.0):** Price is testing this area, which previously acted as a supply zone. A breakout above could open doors for higher levels.
- **Support Zone (~148.5 - 149.0):** If price retraces, this area could act as a strong demand zone.
- **EMA50 (~149.2):** Currently acting as a dynamic support, maintaining the bullish structure.
**Potential Price Movement**
- The chart suggests a possible pullback toward **support** before continuing higher toward the next resistance zone (~151.5 - 152.0).
- If price breaks below the **support zone**, the uptrend could weaken, leading to a bearish scenario.
**Trading Considerations**
- A **successful breakout above resistance** (~150) could push price towards **152.0**.
- A **rejection at resistance** might bring price back to **support (~148.5 - 149.0)** before another bullish attempt.
- Traders should watch for **confirmation signals** (candlestick patterns, volume spikes) before entering trades.


