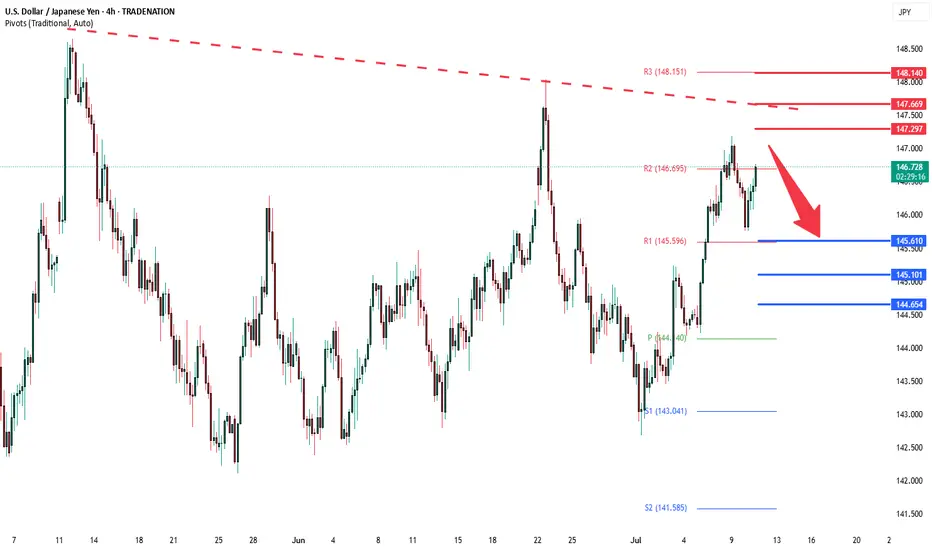
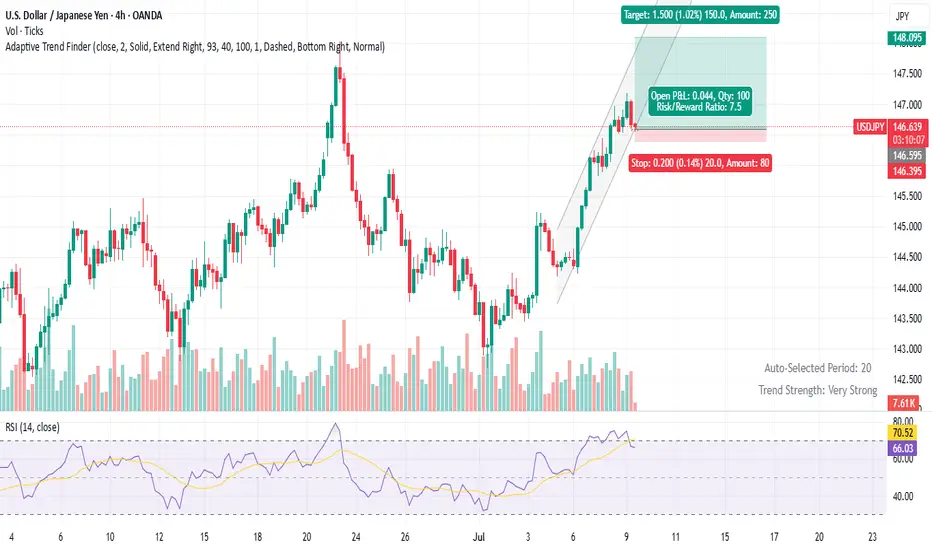
USDJPY downtrend resistance at 147.30The USDJPY pair is currently trading with a bearish bias, aligned with the broader downward trend. Recent price action shows a retest of the falling resistance, suggesting a temporary relief rally within the downtrend.
Key resistance is located at 147.30, a prior consolidation zone. This level will be critical in determining the next directional move.
A bearish rejection from 147.30 could confirm the resumption of the downtrend, targeting the next support levels at 145.60, followed by 145.10 and 144.65 over a longer timeframe.
Conversely, a decisive breakout and daily close above 147.30 would invalidate the current bearish setup, shifting sentiment to bullish and potentially triggering a move towards 147.70, then 148.14.
Conclusion:
The short-term outlook remains bearish unless the pair breaks and holds above 145.30. Traders should watch for price action signals around this key level to confirm direction. A rejection favours fresh downside continuation, while a breakout signals a potential trend reversal or deeper correction.
This communication is for informational purposes only and should not be viewed as any form of recommendation as to a particular course of action or as investment advice. It is not intended as an offer or solicitation for the purchase or sale of any financial instrument or as an official confirmation of any transaction. Opinions, estimates and assumptions expressed herein are made as of the date of this communication and are subject to change without notice. This communication has been prepared based upon information, including market prices, data and other information, believed to be reliable; however, Trade Nation does not warrant its completeness or accuracy. All market prices and market data contained in or attached to this communication are indicative and subject to change without notice.
USDJPY
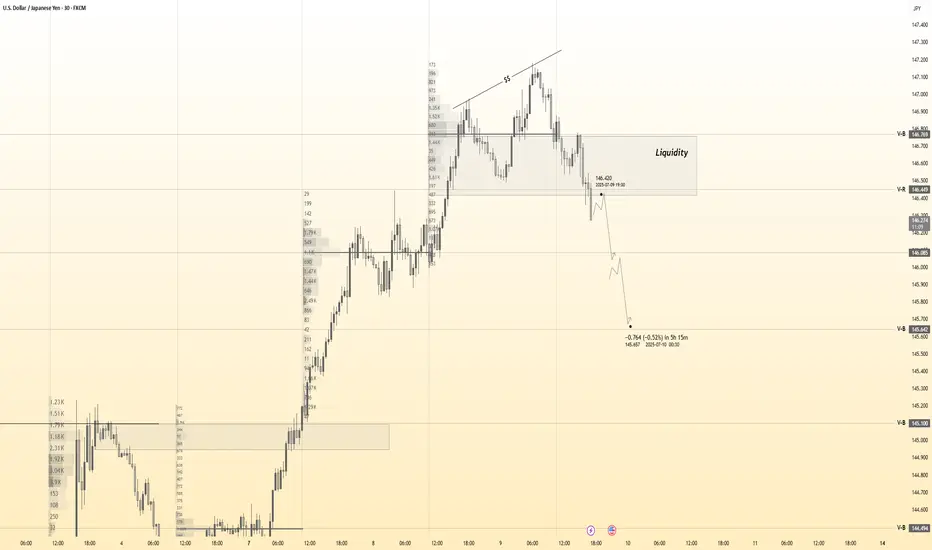
USD/JPY bears getting trapToday's main data release was the weekly jobless claims figures, which came out better than expected at 227K vs. 236K eyed, down from 232K the week before.
In response, the dollar extended its rebound, and the USD/JPY has turned positive on the day after yesterday's reversal.
In recent days the UJ has been pushing higher, thanks to a weakening JPY amid threats of tariffs from the US. But we have also seen some support for the dollar owing to expectations that the tariffs will prove inflationary and that could limit Fed rate cuts.
The UJ has been forming a few bullish price signals and now finds itself above the 21-day exponential average. Stops resting above those inverted hammer candles from yesterday and June 23 could be in trouble. Can we see price rally towards those liquidity pools?
Support at 146.00 held firm after a brief dip below it. Next support is around 145.00 then 144.25 and 144.00 thereafter.
By Fawad Razaqzada, market analyst with FOREX.com

USD/JPY Made H&S Reversal Pattern , Short Setup Valid !Here is my 15 Mins Chart on USD/JPY , We have a very clear reversal pattern , head & shoulders pattern and we have a confirmation by closure below our neckline so we can enter direct now or waiting the price to go back and retest the neckline and this is my fav scenario .

USDJPY IS THE ONLY FALLING h4Price dips below 143.000 support
Attracts breakout sellers
Sharp reversal back toward resistance at 146.500+
Target zone: 147.800 – 149.000

USDJPY Analysis : Bearish Setup from Reversal Zone + Target⚠️ Overview:
The USDJPY 4H chart reveals a smart money-driven bearish setup, unfolding precisely from a major Reversal Zone, which aligns with a key supply area. Price action is now offering high-probability short trade opportunities, supported by structural breaks, clear CHoCHs (Change of Character), and BOS (Breaks of Structure).
🔎 Detailed Technical Breakdown:
🔹 Bearish Pattern + Channel Formation:
The pair formed a bearish price pattern earlier, which initiated the previous downtrend. This move developed into a well-formed descending channel, showing controlled distribution from the institutional side. The channel break marked a liquidity grab below previous lows, trapping retail sellers before shifting structure.
🔹 Channel Insider Demand + Breakout:
After reaching the Channel Insider Demand, USDJPY made a strong bullish push, causing a Minor BOS — a sign of temporary bullish pressure. However, this move served to rebalance price into a premium zone, which is the current Reversal Zone. This zone lies near previous imbalance/fair value gaps and coincides with a supply structure, making it a high-reaction area.
🔹 Reversal Zone (Premium Area):
Price tapped the Reversal Zone and began rejecting aggressively. This reaction indicates the presence of large sellers and order blocks. The current price action now displays a Minor CHoCH, suggesting a short-term bearish shift in order flow.
This is a textbook case of premium vs. discount pricing, where price seeks liquidity above recent highs before reversing to more balanced zones.
🔹 Price Flow Expectations (Downside Targets):
The first confirmation of bearish continuation will come with a clean break below the Minor CHoCH level (~144.400). Following that, momentum is expected to carry USDJPY toward:
🥇 Target 1: 144.00 – Local support / liquidity pocket
🥈 Target 2: 143.00 – Key psychological & structural support
🥉 Target 3: 142.00–142.50 Zone – Marked as the Next Reversal Zone, which could act as demand
This setup remains valid as long as the price remains below 147.200, which is the high of the Reversal Zone. A breakout above this invalidates the bearish thesis.
🧠 MMC (Mind Market Curve) Interpretation:
The chart clearly respects Mind Curve Theory structure:
CHoCH/BOS confirms internal order flow
Reversal zone is placed at a curve top (premium)
Support base (discount zone) is yet to be revisited
The curve shape guides a possible rounded rejection scenario, pushing price down into the major support, aligning with smart money liquidity grab behavior.
📊 Strategic Insight:
This is a classic smart money trap — fake bullish breakout, quick grab of early breakout traders’ stops, followed by a decisive turn from supply.
Traders should monitor:
Candle structure at current levels
Reaction to minor CHoCH zone (~144.400)

USD/JPY: A High-Clarity Setup in a Coiling MarketFor weeks, the market has been choppy and difficult, grinding accounts down with indecisive price action. Many traders are getting stomped by the noise. This post is designed to cut through that chaos with a single, high-clarity trade idea based on a powerful fundamental story and a clean technical picture.
The focus is on the USD/JPY, where a major catalyst (US CPI) is about to meet a tightly coiling chart pattern.
The Fundamental Why 📰
Our entire thesis is now supported by both qualitative and quantitative analysis. The core driver is the profound monetary policy divergence between the U.S. and Japan, which manifests as a powerful Interest Rate Differential.
The Core Driver: The Bank of Japan maintains its ultra-easy policy while the Fed is in a "hawkish hold," creating a significant interest rate gap of over 400 basis points that fuels the carry trade.
Quantitative Validation: Our new analysis confirms this is the primary driver. We found a strong positive correlation of 0.54 between the USD/JPY exchange rate and this Interest Rate Differential. This provides a robust, data-backed reason for our long bias.
This creates a fundamental chasm between the two currencies, representing a compelling long-term tailwind for USD/JPY.
The Technical Picture 📊
The 4-hour chart perfectly visualizes the market's current state.
The Coiled Spring: Price is consolidating in a tight symmetrical triangle. This represents a balance between buyers and sellers and a build-up of energy. A breakout is imminent.
The Demand Zone: Our entry is not random. We are targeting a dip into the key demand zone between 144.50 - 144.80. This area is significant because it aligns with the 50-day moving average, a level that offers a more favorable risk/reward ratio.
The Underlying Conflict: It's important to note the long-term bearish "Death Cross" on the daily chart (50 MA below 200 MA). Our thesis is that the immense fundamental pressure—now validated by our quantitative study—will be strong enough to overwhelm this lagging technical signal.
The Plan & Setup 🎯
This is a conditional setup, and our analysis confirms the proposed levels are well-reasoned. We are waiting for the market to confirm our thesis before entering.
The Setup: 📉 Long (Buy) USD/JPY. We are looking for price to dip into our demand zone and then break out of the triangle to the upside.
Entry Zone: 👉 144.50 - 144.80. Watch for a 4H candle to show support in this area.
Stop Loss: ⛔️ 144.00. A break below this level would signal that the immediate bullish structure has failed and invalidates the trade thesis.
Take Profit: 🎯 149.50. This target is strategically set just below the major 150.00 psychological handle, a level where institutional orders are likely clustered.
This setup provides a clear, logical plan to engage with the market's next big move. It's all signal, no noise. Trade smart, and manage your risk.

USD/JPY H4 | Approaching a swing-high resistanceUSD/JPY is rising towards a swing-high resistance and could potentially reverse off this level to drop lower.
Sell entry is at 147.03 which is a swing-high resistance.
Stop loss is at 147.75 which is a level that sits above the 127.2% Fibonacci extension and a swing-high resistance.
Take profit is at 145.85 which is an overlap support that aligns closely with the 50% Fibonacci retracement.
High Risk Investment Warning
Trading Forex/CFDs on margin carries a high level of risk and may not be suitable for all investors. Leverage can work against you.
Stratos Markets Limited (tradu.com ):
CFDs are complex instruments and come with a high risk of losing money rapidly due to leverage. 63% of retail investor accounts lose money when trading CFDs with this provider. You should consider whether you understand how CFDs work and whether you can afford to take the high risk of losing your money.
Stratos Europe Ltd (tradu.com ):
CFDs are complex instruments and come with a high risk of losing money rapidly due to leverage. 63% of retail investor accounts lose money when trading CFDs with this provider. You should consider whether you understand how CFDs work and whether you can afford to take the high risk of losing your money.
Stratos Global LLC (tradu.com ):
Losses can exceed deposits.
Please be advised that the information presented on TradingView is provided to Tradu (‘Company’, ‘we’) by a third-party provider (‘TFA Global Pte Ltd’). Please be reminded that you are solely responsible for the trading decisions on your account. There is a very high degree of risk involved in trading. Any information and/or content is intended entirely for research, educational and informational purposes only and does not constitute investment or consultation advice or investment strategy. The information is not tailored to the investment needs of any specific person and therefore does not involve a consideration of any of the investment objectives, financial situation or needs of any viewer that may receive it. Kindly also note that past performance is not a reliable indicator of future results. Actual results may differ materially from those anticipated in forward-looking or past performance statements. We assume no liability as to the accuracy or completeness of any of the information and/or content provided herein and the Company cannot be held responsible for any omission, mistake nor for any loss or damage including without limitation to any loss of profit which may arise from reliance on any information supplied by TFA Global Pte Ltd.
The speaker(s) is neither an employee, agent nor representative of Tradu and is therefore acting independently. The opinions given are their own, constitute general market commentary, and do not constitute the opinion or advice of Tradu or any form of personal or investment advice. Tradu neither endorses nor guarantees offerings of third-party speakers, nor is Tradu responsible for the content, veracity or opinions of third-party speakers, presenters or participants.

USDJPY 30Min Engaged (Bearish Reversal Entry Detected )➕ Objective: Precision Volume Execution
Time Frame: 30-Minute Warfare
Entry Protocol: Only after volume-verified breakout
🩸 Bearish Reversal From : 146.400
➗ Hanzo Protocol: Volume-Tiered Entry Authority
➕ Zone Activated: Dynamic market pressure detected.
The level isn’t just price — it’s a memory of where they moved size.
Volume is rising beneath the surface — not noise, but preparation.
🔥 Tactical Note:
We wait for the energy signature — when volume betrays intention.
The trap gets set. The weak follow. We execute.
USD/JPY: Still a Safe-Haven Tug of WarUSD/JPY had surged past 147 on the back of Trump’s tariff letter to Japan—but quickly pulled back as risk appetite stabilized and Treasury yields softened. Price action now sits around the low-146s.
Technically, the 100-day SMA is providing key support just below 146.00. If bulls hold this level, we could see another push toward 147.20–148.00. On the downside, any surprise from upcoming Fed speakers or Japanese trade negotiations could send the pair testing the 144.00 zone again. Traders are watching Osaka closely, U.S. Treasury Secretary Scott Bessent is expected to meet Japanese officials at the World Expo, which could shape sentiment fast.

DeGRAM | USDJPY fixed above the descending channel📊 Technical Analysis
● Dollar-yen has punched through the 16-month descending channel top and twice retested it as support (false-break tags), carving a rising trend line that now guides price away from 144.90.
● Inside the break zone a smaller pennant is forming; a 4 h close above 147.18 completes the pattern and activates the channel-height target at 150.80 near the November swing cap.
💡 Fundamental Analysis
● US 2-yr yields pushed to a three-month high after hotter CPI core-services and Barkin’s “inflation progress has stalled”, while the BoJ July minutes flagged only “gradual” QT—widening the policy gap and reviving carry demand for yen shorts.
✨ Summary
Long 145.2-146.2; pennant break >147.18 targets 150.80. Bias void on a 4 h close below 142.80.
-------------------
Share your opinion in the comments and support the idea with like. Thanks for your support!

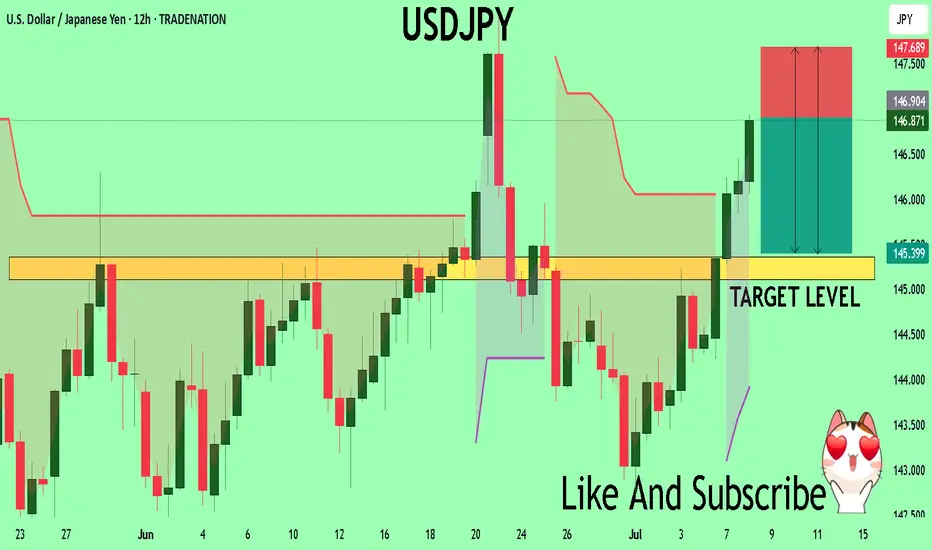
Bullish bounce off major support?USD/JPY has bounced off the pivot and could rise to the pullback resistance.
Pivot: 145.92
1st Support: 145.23
1st Resistance: 147.14
Risk Warning:
Trading Forex and CFDs carries a high level of risk to your capital and you should only trade with money you can afford to lose. Trading Forex and CFDs may not be suitable for all investors, so please ensure that you fully understand the risks involved and seek independent advice if necessary.
Disclaimer:
The above opinions given constitute general market commentary, and do not constitute the opinion or advice of IC Markets or any form of personal or investment advice.
Any opinions, news, research, analyses, prices, other information, or links to third-party sites contained on this website are provided on an "as-is" basis, are intended only to be informative, is not an advice nor a recommendation, nor research, or a record of our trading prices, or an offer of, or solicitation for a transaction in any financial instrument and thus should not be treated as such. The information provided does not involve any specific investment objectives, financial situation and needs of any specific person who may receive it. Please be aware, that past performance is not a reliable indicator of future performance and/or results. Past Performance or Forward-looking scenarios based upon the reasonable beliefs of the third-party provider are not a guarantee of future performance. Actual results may differ materially from those anticipated in forward-looking or past performance statements. IC Markets makes no representation or warranty and assumes no liability as to the accuracy or completeness of the information provided, nor any loss arising from any investment based on a recommendation, forecast or any information supplied by any third-party.
$UJ (USDJPY) 1HPrice tapped into a 4H FVG (gray zone 146.800–146.300), a high-probability reversal zone when paired with liquidity sweep and break of structure.
The bullish internal trendline was cleanly broken, signaling a short-term shift in momentum.
Prior to the drop, price ran buy-side liquidity resting above previous highs (marked $$$), fulfilling liquidity objectives before reversing.
The move into the 4H-FVG occurred in premium territory, ideal for institutional distribution.
As long as price holds below 146.300 (top of the FVG), the bearish leg remains valid.
Next liquidity target is around 145.240, where previous sell-side liquidity (lows marked $$$) is resting.

Bearish reversal off 78.6% Fibonacci resistance?USD/JPY has rejected off the resistance level that is slightly below the 78.6% Fibonacci retracement and could drop from this level to our take profit.
Entry: 146.60
Why we like it:
There is a resistance level that is slightly below the 78.6% Fibonacci retracement.
Stop loss: 147.95
Why we like it:
There is a pullback resistance level.
Take profit: 145.21
Why we like it:
There is a pullback support that is slightly below the 38.2% Fibonacci retracement.
Enjoying your TradingView experience? Review us!
Please be advised that the information presented on TradingView is provided to Vantage (‘Vantage Global Limited’, ‘we’) by a third-party provider (‘Everest Fortune Group’). Please be reminded that you are solely responsible for the trading decisions on your account. There is a very high degree of risk involved in trading. Any information and/or content is intended entirely for research, educational and informational purposes only and does not constitute investment or consultation advice or investment strategy. The information is not tailored to the investment needs of any specific person and therefore does not involve a consideration of any of the investment objectives, financial situation or needs of any viewer that may receive it. Kindly also note that past performance is not a reliable indicator of future results. Actual results may differ materially from those anticipated in forward-looking or past performance statements. We assume no liability as to the accuracy or completeness of any of the information and/or content provided herein and the Company cannot be held responsible for any omission, mistake nor for any loss or damage including without limitation to any loss of profit which may arise from reliance on any information supplied by Everest Fortune Group.

USDJPY What Next? SELL!
My dear followers,
I analysed this chart on USDJPY and concluded the following:
The market is trading on 146.88 pivot level.
Bias - Bearish
Technical Indicators: Both Super Trend & Pivot HL indicate a highly probable Bearish continuation.
Target - 145.35
Safe Stop Loss - 147.68
About Used Indicators:
A super-trend indicator is plotted on either above or below the closing price to signal a buy or sell. The indicator changes color, based on whether or not you should be buying. If the super-trend indicator moves below the closing price, the indicator turns green, and it signals an entry point or points to buy.
Disclosure: I am part of Trade Nation's Influencer program and receive a monthly fee for using their TradingView charts in my analysis.
———————————
WISH YOU ALL LUCK
GOLD - SHORT TO $2,800 (UPDATE)Gold has dropped even lower overnight during the Asian market session. We're now running 500 PIPS in profit & hopefully this is only the BEGINNING of this huge move.
Being extremely careful here, as Gold is currently at a make or break sort of area.

Bears On The Prowl, Key Supports In FocusAnalysis
USDJPY has faced downward pressure recently and is currently trading below a key resistance level around 152.250. This level acts as a significant barrier to upward movements, and the inability to decisively break above it reinforces our bearish outlook.
Key Observations
🔹 Dominant Bearish Pressure: Despite fluctuations, bulls (buyers) seem to be struggling to maintain higher levels, while bears (sellers) are asserting pressure.
🔹 Key Resistance: The 152.250 level serves as a strong resistance. As long as the price remains below this level, the bearish view will prevail.
🔹 Crucial Supports: The levels of 141.710 and 137.410 are acting as critical support zones for this pair. A break below either of these levels could pave the way for further declines.
🔹 Momentum Indicators: (Here, you can add details about specific indicators that confirm your bearish view. For example: "The RSI is moving towards oversold territory, suggesting continued downside momentum," or "The MACD is showing a bearish crossover, indicating potential for further weakness.")
Potential Scenarios
🔴 Primary Scenario (Bearish): As long as USDJPY remains below the 152.250 resistance, we anticipate continued downward pressure. The bears' initial target will be to test and break the 141.710 support.
🔻 Break of First Support: If the 141.710 support is broken decisively (with strong candles and significant volume), this would be a strong bearish signal. In this scenario, the next target for the price would be to test the lower support at 137.410. A break below this level could lead to even deeper declines.
🟢 Alternative Scenario (Bullish): Should USDJPY manage to decisively break above the 152.250 resistance and sustain itself above it, our bearish view would be temporarily invalidated, and we might see a corrective upward movement. However, until this occurs, the focus remains on the bearish scenario.
Fundamental Considerations
🔘 US-Japan Interest Rate Differential: The significant interest rate differential between the US Federal Reserve and the Bank of Japan continues to be a major factor. Any shift in market expectations regarding the monetary policies of these two central banks could impact USDJPY.
🔘 Bank of Japan (BoJ) Policy: Any signs of a change in the BoJ's ultra-loose monetary policy (e.g., an interest rate hike or a reduction in asset purchases) could strengthen the JPY and put downward pressure on USDJPY.
🔘 US Economic Data: Upcoming US economic data, particularly inflation figures and statements from Federal Reserve officials, could influence the dollar's value and, consequently, USDJPY.
🍀HAVE PROFITABLE TRADES🍻

Smart 15-Min Entry on USDJPY – Clear Plan with 2.33 R/R📢 Hey Guys;
I've placed a buy limit order on USDJPY at a key support level.
🔵 Entry: 145.956
🔴 Stop Loss: 145.743
🟢 Targets:
• TP1: 146.069
• TP2: 146.232
• TP3: 146.468
📐 Risk/Reward Ratio: 2.33
-------
Your likes and support are what keep me motivated to share these analyses consistently.
Huge thanks to everyone who shows love and appreciation! 🙏

USD/JPY Long Trade SetupBuy dips - 146.50-146.60
Stop Loss -145.80 - Below retest zone; invalidates breakout.
TP-1 148.80 - Scale 50 % Pattern target / June high cluster.
TP-2 150.00 - Round-number magnet, option strikes.
Rationale
The dollar-yen cross has snapped out of its early-summer drift and vaulted back above the 100-day simple moving average for the first time since February, reaching ¥147.19 on 9 July – a two-and-a-half-week high – as the greenback rides an upswing in U.S. yields and tariff-driven inflation fears. The technical breakout puts the familiar 148.00/150.00 band – the June swing high and the psychological round number – back in play for trend-followers over the next several sessions.
Policy divergence as wide as ever
Federal Reserve – higher-for-longer: Minutes from the June FOMC showed staff pushing inflation projections higher and flagging “upside risks” should tariff pass-through accelerate, reinforcing the market’s view that rate cuts will be pushed into Q4 at the earliest. Five straight sessions of rising Treasury yields have followed, lifting the 10-year to 4.45 % and widening the U.S.–Japan real-rate gap.
Bank of Japan – stuck on hold: Former BOJ board member Makoto Sakurai told Reuters the central bank will “wait at least until March 2026” before considering another hike, as Trump’s 25 % tariff on Japanese goods (effective 1 August) clouds the export outlook and will likely force the BOJ to cut its growth forecast at the 31 July Outlook Report. With headline CPI still only just above target and real wages contracting.
USDJPY 30Min Engaged ( Bullish Entry Detected )➕ Objective: Precision Volume Execution
Time Frame: 30-Minute Warfare
Entry Protocol: Only after volume-verified breakout
🩸 Bullish From now Price : 146.750
➗ Hanzo Protocol: Volume-Tiered Entry Authority
➕ Zone Activated: Dynamic market pressure detected.
The level isn’t just price — it’s a memory of where they moved size.
Volume is rising beneath the surface — not noise, but preparation.
🔥 Tactical Note:
We wait for the energy signature — when volume betrays intention.
The trap gets set. The weak follow. We execute.
USDJPY Will Go Down! Sell!
Here is our detailed technical review for USDJPY.
Time Frame: 1D
Current Trend: Bearish
Sentiment: Overbought (based on 7-period RSI)
Forecast: Bearish
The market is approaching a significant resistance area 146.736.
Due to the fact that we see a positive bearish reaction from the underlined area, I strongly believe that sellers will manage to push the price all the way down to 144.416 level.
P.S
We determine oversold/overbought condition with RSI indicator.
When it drops below 30 - the market is considered to be oversold.
When it bounces above 70 - the market is considered to be overbought.
Disclosure: I am part of Trade Nation's Influencer program and receive a monthly fee for using their TradingView charts in my analysis.
Like and subscribe and comment my ideas if you enjoy them!

USDJPY – Key Support Bounce with Macro TailwindsUSDJPY is bouncing off a key trendline and 61.8% Fib zone (143.25–143.60) with confluence across multiple JPY crosses (EURJPY, AUDJPY, CADJPY). This area has historically triggered strong upside momentum, and the current setup aligns with both technical structure and macro drivers.
📊 Fundamentals Supporting the Move:
✅ US Yields Stable: US10Y is holding above 4.20%, keeping USDJPY supported. If yields push back toward 4.30%, expect USDJPY to retest 145.30 and potentially 147.80.
✅ BoJ Dovish: Japan shows no shift in policy. Despite weak Tankan data, BoJ remains patient, and no meaningful rate hike or YCC change is expected soon.
✅ USD Macro Resilience: Core PCE held firm at 2.6%. Focus now shifts to ISM Services PMI (Wed) and NFP (Fri). Markets are still pricing a soft landing – supporting risk-on and a stronger USD.
✅ JPY as a Fading Safe Haven: Even with geopolitical headlines (Trump tariff tensions, Taiwan, Middle East), JPY demand remains weak. Traders are favoring USD and Gold over JPY as risk hedges.
⚠️ Risks to Watch:
Dovish US Data Surprise: Weak NFP or ISM could drag yields down and trigger USDJPY reversal.
Verbal or Actual BoJ Intervention: If we approach 148.50–150, Japan may step in again.
Geopolitical Escalation: Any sharp risk-off could trigger safe haven demand for JPY, though this has underperformed recently.
🔎 Correlation Dynamics:
📈 USDJPY is leading JPY crosses like EURJPY and AUDJPY. The recent bounce started simultaneously across the JPY complex, with USDJPY slightly ahead.
📉 If US yields drop or risk sentiment shifts, USDJPY may lag gold or bonds but eventually catch up.
🧠 Trading Plan:
📍 Entry Zone: 143.30–143.60 (trendline + Fib confluence)
🎯 Target 1: 145.30 (38.2% Fib)
🎯 Target 2: 147.80 (channel resistance)
🛑 Invalidation: Daily close below 141.50 with US yields breaking down
📅 Upcoming Events to Watch:
Wed July 3: ISM Services PMI (key for USD reaction)
Fri July 5: US Non-Farm Payrolls + Average Hourly Earnings
JPY Risk: Verbal intervention possible near 148+
🧭 Summary:
USDJPY is positioned for a bullish continuation, backed by:
Rising yields
Resilient US macro
Weak JPY fundamentals
Technical structure respecting trendline support
Short-term traders can target the 145–147.80 range ahead of NFP, with a tight eye on yield and risk sentiment.
📌 If this analysis helps, drop a like and follow for more real-time macro-technical breakdowns. Stay nimble ahead of NFP! 🧠📈

USDJPY H4 I Bearish Reversal Based on the H4 chart analysis, the price is approaching our buy entry level at 147.36, a pullback support that aligns closely with the 161.8% Fib retracement.
Our take profit is set at 145.99, a pullback support.
The stop loss is placed at 148.70, above the 161.8% Fib extension.
High Risk Investment Warning
Trading Forex/CFDs on margin carries a high level of risk and may not be suitable for all investors. Leverage can work against you.
Stratos Markets Limited (tradu.com ):
CFDs are complex instruments and come with a high risk of losing money rapidly due to leverage. 63% of retail investor accounts lose money when trading CFDs with this provider. You should consider whether you understand how CFDs work and whether you can afford to take the high risk of losing your money.
Stratos Europe Ltd (tradu.com ):
CFDs are complex instruments and come with a high risk of losing money rapidly due to leverage. 63% of retail investor accounts lose money when trading CFDs with this provider. You should consider whether you understand how CFDs work and whether you can afford to take the high risk of losing your money.
Stratos Global LLC (tradu.com ):
Losses can exceed deposits.
Please be advised that the information presented on TradingView is provided to Tradu (‘Company’, ‘we’) by a third-party provider (‘TFA Global Pte Ltd’). Please be reminded that you are solely responsible for the trading decisions on your account. There is a very high degree of risk involved in trading. Any information and/or content is intended entirely for research, educational and informational purposes only and does not constitute investment or consultation advice or investment strategy. The information is not tailored to the investment needs of any specific person and therefore does not involve a consideration of any of the investment objectives, financial situation or needs of any viewer that may receive it. Kindly also note that past performance is not a reliable indicator of future results. Actual results may differ materially from those anticipated in forward-looking or past performance statements. We assume no liability as to the accuracy or completeness of any of the information and/or content provided herein and the Company cannot be held responsible for any omission, mistake nor for any loss or damage including without limitation to any loss of profit which may arise from reliance on any information supplied by TFA Global Pte Ltd.
The speaker(s) is neither an employee, agent nor representative of Tradu and is therefore acting independently. The opinions given are their own, constitute general market commentary, and do not constitute the opinion or advice of Tradu or any form of personal or investment advice. Tradu neither endorses nor guarantees offerings of third-party speakers, nor is Tradu responsible for the content, veracity or opinions of third-party speakers, presenters or participants.

USDJPY – A Bull Trap in the Making?USDJPY has just broken above the descending trendline but stalled right at the confluence resistance near 147.100 – a former strong distribution zone. Although buyers have pushed the price higher, the current price structure is sketching a potential double top pattern, signaling a possible exhaustion of the bullish momentum.
If this pattern confirms and price breaks below the FVG support zone around 145.161, then 144.300 will likely be the next target – a level that previously halted price before the recent rally. Price action should be closely monitored here, as a breakdown below 145.161 could be an early reversal signal.
Disappointing Nonfarm data has pushed bond yields lower and weakened the USD, reinforcing expectations of an earlier Fed rate cut. If this week’s CPI also comes in lower than expected, USDJPY could sharply drop from the current top.
