DeGRAM | USDJPY correction 📊 Technical Analysis
● Monday's rebound above the 4-month falling trend line was quickly repelled, leaving a “false breakdown” candle; price has returned under the line and is now retesting it as resistance around 144.65.
● The rebound also stopped at the top of the triangle and a small bearish flag formed; the height of the pattern points to the 142.80 support band and the broader channel to 139.90 as continuation.
💡 Fundamental analysis
● Softer U.S. core GDP data drove 2-year Treasury yields to two-week lows, reducing the rate differential that favored the dollar.
Meanwhile, Japanese officials again warned that they “do not rule out any measures” against excessive yen weakening, raising the risk of intervention and discouraging new long USD/JPY positions.
Summary
Short 144.4 - 144.65; break below 143.8 targets 142.8 -> 139.9. Bearish view loses strength with a 4-hour close above 145.30.
-------------------
Share your opinion in the comments and support the idea with like. Thanks for your support!
USDJPY

Potential bullish continuation?USD/JPY has bounced off the pivot and could rise to the 1st resistance, which aligns with the 78.6% Fibonacci retracement.
Pivot: 143.37
1st Support: 142.78
1st Resistance: 144.50
Risk Warning:
Trading Forex and CFDs carries a high level of risk to your capital and you should only trade with money you can afford to lose. Trading Forex and CFDs may not be suitable for all investors, so please ensure that you fully understand the risks involved and seek independent advice if necessary.
Disclaimer:
The above opinions given constitute general market commentary, and do not constitute the opinion or advice of IC Markets or any form of personal or investment advice.
Any opinions, news, research, analyses, prices, other information, or links to third-party sites contained on this website are provided on an "as-is" basis, are intended only to be informative, is not an advice nor a recommendation, nor research, or a record of our trading prices, or an offer of, or solicitation for a transaction in any financial instrument and thus should not be treated as such. The information provided does not involve any specific investment objectives, financial situation and needs of any specific person who may receive it. Please be aware, that past performance is not a reliable indicator of future performance and/or results. Past Performance or Forward-looking scenarios based upon the reasonable beliefs of the third-party provider are not a guarantee of future performance. Actual results may differ materially from those anticipated in forward-looking or past performance statements. IC Markets makes no representation or warranty and assumes no liability as to the accuracy or completeness of the information provided, nor any loss arising from any investment based on a recommendation, forecast or any information supplied by any third-party.

USDJPY H1 I Bearish ReversalBased on the H1 chart, the price is rising toward our sell entry level at 144.15, a pullback resistance that aligns with the 78.6% Fib retracement.
Our take profit is set at 143.48, an overlap support.
The stop loss is set at 144.67, an overlap resistance.
High Risk Investment Warning
Trading Forex/CFDs on margin carries a high level of risk and may not be suitable for all investors. Leverage can work against you.
Stratos Markets Limited (tradu.com ):
CFDs are complex instruments and come with a high risk of losing money rapidly due to leverage. 63% of retail investor accounts lose money when trading CFDs with this provider. You should consider whether you understand how CFDs work and whether you can afford to take the high risk of losing your money.
Stratos Europe Ltd (tradu.com ):
CFDs are complex instruments and come with a high risk of losing money rapidly due to leverage. 63% of retail investor accounts lose money when trading CFDs with this provider. You should consider whether you understand how CFDs work and whether you can afford to take the high risk of losing your money.
Stratos Global LLC (tradu.com ):
Losses can exceed deposits.
Please be advised that the information presented on TradingView is provided to Tradu (‘Company’, ‘we’) by a third-party provider (‘TFA Global Pte Ltd’). Please be reminded that you are solely responsible for the trading decisions on your account. There is a very high degree of risk involved in trading. Any information and/or content is intended entirely for research, educational and informational purposes only and does not constitute investment or consultation advice or investment strategy. The information is not tailored to the investment needs of any specific person and therefore does not involve a consideration of any of the investment objectives, financial situation or needs of any viewer that may receive it. Kindly also note that past performance is not a reliable indicator of future results. Actual results may differ materially from those anticipated in forward-looking or past performance statements. We assume no liability as to the accuracy or completeness of any of the information and/or content provided herein and the Company cannot be held responsible for any omission, mistake nor for any loss or damage including without limitation to any loss of profit which may arise from reliance on any information supplied by TFA Global Pte Ltd.
The speaker(s) is neither an employee, agent nor representative of Tradu and is therefore acting independently. The opinions given are their own, constitute general market commentary, and do not constitute the opinion or advice of Tradu or any form of personal or investment advice. Tradu neither endorses nor guarantees offerings of third-party speakers, nor is Tradu responsible for the content, veracity or opinions of third-party speakers, presenters or participants.

Sintra Signals: Central Banks Stay Cautious The ECB Forum in Sintra brought together the heads of the world’s most influential central banks—Lagarde (ECB), Powell (Fed), Bailey (BOE), Ueda (BOJ), and Rhee (BOK).
Across the board, central banks are remaining cautious and data-driven, with no firm commitments on timing for rate changes.
Fed Chair Powell said the U.S. economy is strong, with inflation manageable despite expected summer upticks. He noted tariffs have delayed potential rate cuts and confirmed the Fed is proceeding meeting by meeting.
BOE’s Bailey highlighted signs of softening in the UK economy and said policy remains restrictive but will ease over time. He sees the path of rates continuing downward.
BOJ’s Ueda noted headline inflation is above 2%. Any hikes will depend on underlying core inflation which remains below target.

Bullish bounce off pullback support?USD/JPY has bounced off the support level which is a pullback support and could potentially rise from this level to our take profit.
Entry: 142.63
Why we like it:
There is a pullback support.
Stop loss: 141.91
Why we like it:
There is a pullback support.
Take profit: 144.68
Why we like it:
There is an overlap resistance that lines up with the 38.2% Fibonacci retracement.
Enjoying your TradingView experience? Review us!
Please be advised that the information presented on TradingView is provided to Vantage (‘Vantage Global Limited’, ‘we’) by a third-party provider (‘Everest Fortune Group’). Please be reminded that you are solely responsible for the trading decisions on your account. There is a very high degree of risk involved in trading. Any information and/or content is intended entirely for research, educational and informational purposes only and does not constitute investment or consultation advice or investment strategy. The information is not tailored to the investment needs of any specific person and therefore does not involve a consideration of any of the investment objectives, financial situation or needs of any viewer that may receive it. Kindly also note that past performance is not a reliable indicator of future results. Actual results may differ materially from those anticipated in forward-looking or past performance statements. We assume no liability as to the accuracy or completeness of any of the information and/or content provided herein and the Company cannot be held responsible for any omission, mistake nor for any loss or damage including without limitation to any loss of profit which may arise from reliance on any information supplied by Everest Fortune Group.

Dollar Index Bearish to $96The DXY has been in a downtrend for a while & that bearish pressure is not over yet. I expect more bearish downside towards the $96 zone, before we can re-analyse the market for any signs of bullish takeover.
⭕️Major Wave 3 Impulse Move Complete.
⭕️Major Wave 4 Corrective Move Complete.
⭕️Minor 4 Waves of Major Wave 5 Complete, With Minor Wave 5 Yet Pending.

USDJPY FXAN & Heikin Ashi exampleIn this video, I’ll be sharing my analysis of USDJPY, using FXAN's proprietary algo indicators with my unique Heikin Ashi strategy. I’ll walk you through the reasoning behind my trade setup and highlight key areas where I’m anticipating potential opportunities.
I’m always happy to receive any feedback.
Like, share and comment! ❤️
Thank you for watching my videos! 🙏

GBPJPY H4 XABCD Short at Market TP Below Market🔸Hello traders, let's review the 4 hour chart for GBPJPY. Strong gains off the lows recently, however price getting overextended and expecting reversal later at/near PRZ/D.
🔸Speculative XABCD structure defined by point X 199 point A 188 point B 195.20 point C 186.80 point D/PRZ 198.40/80 .
🔸Currently most points validated, point D/PRZ validated as well.
Short sell at market SL over point D/PRZ TP details see chart
🔸Recommended strategy for GJ traders: Short Sell at Market
SL over point D/PRZ TP1 193.30 TP2 191.00 TP3 188.80.
🎁Please hit the like button and
🎁Leave a comment to support our team!
RISK DISCLAIMER:
Trading Futures , Forex, CFDs and Stocks involves a risk of loss.
Please consider carefully if such trading is appropriate for you.
Past performance is not indicative of future results.
Always limit your leverage and use tight stop loss.

Critical Channel Watch Begins on the 1-Hour Chart of USDJPY.Hey everyone,
📉 My Latest USDJPY Analysis:
USDJPY is currently moving within a downtrend. If the price breaks below the lower boundary of the parallel channel, our first target level will be 142.910. The most crucial factor here is the downward breakout of that channel—don’t overlook it.
Also, keep a close eye on key economic data releases on the fundamental side, as they could significantly influence your strategy.
I meticulously prepare these analyses for you, and I sincerely appreciate your support through likes. Every like from you is my biggest motivation to continue sharing my analyses.
I’m truly grateful for each of you—love to all my followers💙💙💙

USD/JPY Bearish Flag (30.06.2025)The USD/JPY Pair on the M30 timeframe presents a Potential Selling Opportunity due to a recent Formation of a Bearish Flag Breakout Pattern. This suggests a shift in momentum towards the downside in the coming hours.
Possible Short Trade:
Entry: Consider Entering A Short Position around Trendline Of The Pattern.
Target Levels:
1st Support – 143.40
2nd Support – 142.86
🎁 Please hit the like button and
🎁 Leave a comment to support for My Post !
Your likes and comments are incredibly motivating and will encourage me to share more analysis with you.
Best Regards, KABHI_TA_TRADING
Thank you.
Disclosure: I am part of Trade Nation's Influencer program and receive a monthly fee for using their TradingView charts in my analysis.

USD/JPY at a key support level tested multiple times🔻 USDJPY Sitting at Critical Support – Decision Point Ahead
USDJPY is currently hovering around the 143.60–143.65 zone — a major support level that has held multiple times in the past.
🔍 Price just completed a clean Head & Shoulders breakdown, and this zone marks the neckline retest area. We're now at a make-or-break point:
Break Below 143.60: Confirms bearish continuation, opens downside toward 143.00 → 142.20
Hold Above 143.60: Could lead to a short squeeze back to 144.20–144.50 zone
📊 Volume is rising as we test this key level — suggesting that big players are stepping in.
Trend remains bearish overall with price trading below the EMAs and rejecting trendline resistance.
⚠️ This is not the place to guess — wait for confirmation. A strong candle close below or a fakeout rejection will show the path.
Trade smart. Wait for the market to speak. No bias, just price action. 🧠

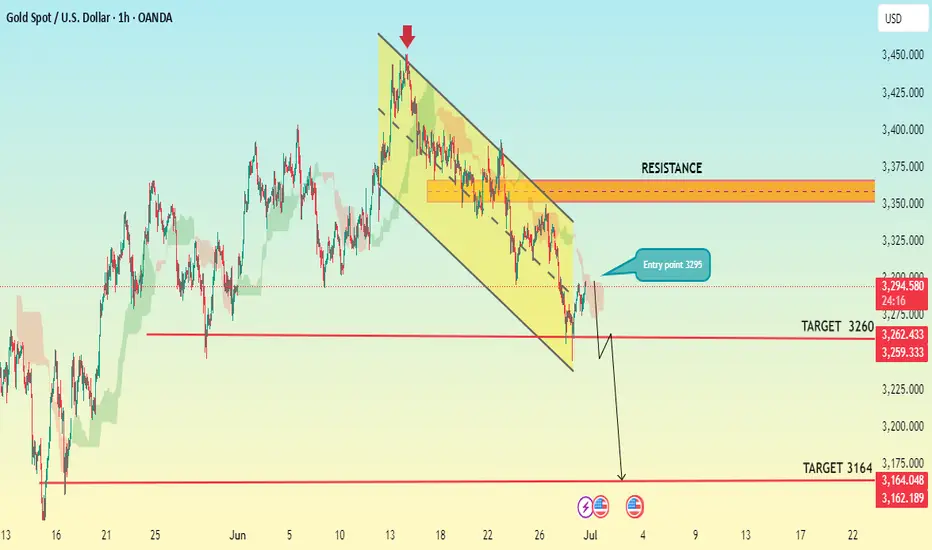
XAUUSD H-1 CHART PATTERNSell Setup (Bearish Bias)
Support: 3360
Entry Point (Sell): 3295
Target 1: 3260
Target 2: 3164
Suggested Stop Loss:
Above 3360, e.g., 3380 depending on market structure.
Summary:
Price is expected to break below the 3360 support zone.
Selling from 3295 aims to capture momentum down toward 3260 and 3164.
GOLD - SHORT TO $2,800 (UPDATE)As expected last week Gold climbed into our 'Supply Zone' of $3,347 & rejected as I said it would on our video analysis. It even managed to close below our 'BOS' zone.
The game plan this week is to keep an eye on market structure for further sells. With every pump up we should be looking at how price can sell off again & how we can join the sell trend to profit off it.

Fundamental Market Analysis for June 30, 2025 USDJPYThe USD/JPY pair is attracting some sellers towards 143.85 during the Asian session on Monday. The U.S. dollar (USD) is weakening against the Japanese yen (JPY) amid rising bets for a Federal Reserve (Fed) interest rate cut.
The United States (US) and China are close to a deal on tariffs. However, U.S. President Donald Trump abruptly ended trade talks with Canada, adding uncertainty to the market's positive outlook.
In addition, traders are betting that the U.S. central bank will cut rates more frequently and possibly sooner than previously expected. Markets estimate the probability of a quarter-point Fed rate cut at nearly 92.4%, up from 70% a week earlier.
On the data side, the personal consumption expenditure (PCE) price index rose 2.3% in May, up from 2.2% in April (revised from 2.1%), the U.S. Bureau of Economic Analysis reported Friday. This value matched market expectations. Meanwhile, the core PCE price index, which excludes volatile food and energy prices, rose 2.7% in May, following a 2.6% increase (revised from 2.5%) seen in April.
On the other hand, the Bank of Japan's (BoJ) cautious stance on interest rate hikes could put pressure on the yen and create a tailwind for the pair.
Trade recommendation: SELL 143.50, SL 144.30, TP 142.40

Potential bearish drop?USD/JPY has rejected off the resistance level which is a pullback resistance and could drop from this level to our take profit.
Entry: 144.61
Why we like it:
There is a pullback resistance level.
Stop loss: 146.11
Why we like it:
There is a pullback resistance level.
Take profit: 142.70
Why we like it:
There is a pullback support level that lines up with the 100% Fibonacci projection.
Enjoying your TradingView experience? Review us!
Please be advised that the information presented on TradingView is provided to Vantage (‘Vantage Global Limited’, ‘we’) by a third-party provider (‘Everest Fortune Group’). Please be reminded that you are solely responsible for the trading decisions on your account. There is a very high degree of risk involved in trading. Any information and/or content is intended entirely for research, educational and informational purposes only and does not constitute investment or consultation advice or investment strategy. The information is not tailored to the investment needs of any specific person and therefore does not involve a consideration of any of the investment objectives, financial situation or needs of any viewer that may receive it. Kindly also note that past performance is not a reliable indicator of future results. Actual results may differ materially from those anticipated in forward-looking or past performance statements. We assume no liability as to the accuracy or completeness of any of the information and/or content provided herein and the Company cannot be held responsible for any omission, mistake nor for any loss or damage including without limitation to any loss of profit which may arise from reliance on any information supplied by Everest Fortune Group.

Bullish bounce off pullback support?USD/JPY is falling towards the pivot and could bounce to the 1st resistance, which is a pullback resistance.
Pivot: 142.53
1st Support: 140.78
1st Resistance: 146.72
Risk Warning:
Trading Forex and CFDs carries a high level of risk to your capital and you should only trade with money you can afford to lose. Trading Forex and CFDs may not be suitable for all investors, so please ensure that you fully understand the risks involved and seek independent advice if necessary.
Disclaimer:
The above opinions given constitute general market commentary, and do not constitute the opinion or advice of IC Markets or any form of personal or investment advice.
Any opinions, news, research, analyses, prices, other information, or links to third-party sites contained on this website are provided on an "as-is" basis, are intended only to be informative, is not an advice nor a recommendation, nor research, or a record of our trading prices, or an offer of, or solicitation for a transaction in any financial instrument and thus should not be treated as such. The information provided does not involve any specific investment objectives, financial situation and needs of any specific person who may receive it. Please be aware, that past performance is not a reliable indicator of future performance and/or results. Past Performance or Forward-looking scenarios based upon the reasonable beliefs of the third-party provider are not a guarantee of future performance. Actual results may differ materially from those anticipated in forward-looking or past performance statements. IC Markets makes no representation or warranty and assumes no liability as to the accuracy or completeness of the information provided, nor any loss arising from any investment based on a recommendation, forecast or any information supplied by any third-party.

USD/JPY Consolidation Triangle – Breakout WatchThe USD/JPY pair is currently trading inside a well-formed symmetrical triangle pattern on the daily chart. This structure typically forms when the market is in a phase of consolidation, with neither buyers nor sellers able to break the range. Price is compressing between a horizontal resistance zone (~146.50) and a rising support line (~143.50), indicating that a breakout in either direction may be imminent.
This triangle has formed after a sharp downtrend, followed by a broad base formation. Such setups often precede a decisive move, especially if accompanied by volume.
🔼 Upside Breakout Scenario
If price breaks and closes above the resistance zone (above 146.50–147.00) with bullish confirmation, we can expect momentum to shift in favor of buyers. A confirmed breakout would open the path toward 150.00+, possibly even retesting the highs of 2024 near 152.00. This would be seen as a bullish reversal after a prolonged downtrend.
🔽 Downside Breakdown Scenario
Alternatively, if price fails to hold the rising trendline and breaks below the 143.00–142.50 support zone, it may confirm a bearish breakdown. This would suggest a continuation of the earlier downtrend with fresh bearish momentum targeting 140.00 and lower levels.
🧭 Trade Strategy Consideration
Bullish Plan: Buy breakout above 147.00 with SL below 145.50 and TP near 150.50–152.00
Bearish Plan: Sell breakdown below 142.50 with SL above 144.00 and TP near 140.00–138.00
Neutral Bias: Wait for breakout confirmation; no trade inside the triangle
This is a tight volatility setup where breakout traders should stay alert. The longer the consolidation, the stronger the breakout move tends to be.
=================================================================
Disclosure: I am part of Trade Nation's Influencer program and receive a monthly fee for using their TradingView charts in my analysis.
=================================================================

USDJPY H4 I Bullish Bounce Off Based on the H4 chart analysis, the price is approaching our buy entry level at 143.48, a pullback support.
Our take profit is set at 145.11 a pullback resistance.
The stop loss is placed at 142.22, a swing low support.
High Risk Investment Warning
Trading Forex/CFDs on margin carries a high level of risk and may not be suitable for all investors. Leverage can work against you.
Stratos Markets Limited (tradu.com ):
CFDs are complex instruments and come with a high risk of losing money rapidly due to leverage. 63% of retail investor accounts lose money when trading CFDs with this provider. You should consider whether you understand how CFDs work and whether you can afford to take the high risk of losing your money.
Stratos Europe Ltd (tradu.com ):
CFDs are complex instruments and come with a high risk of losing money rapidly due to leverage. 63% of retail investor accounts lose money when trading CFDs with this provider. You should consider whether you understand how CFDs work and whether you can afford to take the high risk of losing your money.
Stratos Global LLC (tradu.com ):
Losses can exceed deposits.
Please be advised that the information presented on TradingView is provided to Tradu (‘Company’, ‘we’) by a third-party provider (‘TFA Global Pte Ltd’). Please be reminded that you are solely responsible for the trading decisions on your account. There is a very high degree of risk involved in trading. Any information and/or content is intended entirely for research, educational and informational purposes only and does not constitute investment or consultation advice or investment strategy. The information is not tailored to the investment needs of any specific person and therefore does not involve a consideration of any of the investment objectives, financial situation or needs of any viewer that may receive it. Kindly also note that past performance is not a reliable indicator of future results. Actual results may differ materially from those anticipated in forward-looking or past performance statements. We assume no liability as to the accuracy or completeness of any of the information and/or content provided herein and the Company cannot be held responsible for any omission, mistake nor for any loss or damage including without limitation to any loss of profit which may arise from reliance on any information supplied by TFA Global Pte Ltd.
The speaker(s) is neither an employee, agent nor representative of Tradu and is therefore acting independently. The opinions given are their own, constitute general market commentary, and do not constitute the opinion or advice of Tradu or any form of personal or investment advice. Tradu neither endorses nor guarantees offerings of third-party speakers, nor is Tradu responsible for the content, veracity or opinions of third-party speakers, presenters or participants.

USDJPY Daily TF - June 29th, 2025USDJPY Daily Neutral Idea
Monthly - Bullish
Weekly - Bearish
Daily - Bearish
I’m looking at the Daily time frame here as this is the only clear picture for price action in terms of trends. The 4hour looks like price action can’t make a decision so we will wait for price action to get closer to some major zones.
Bearish Continuation - Ideally, we want to see price action touch 147.500 again followed by convincing bearish rejection. Look to target lower toward major support levels if this happens.
Aside from this potential setup we don’t have much to look at here on UJ.

USD/JPY "The Ninja Heist" – Bullish Loot Grab!🌟 Hey, Thieves & Market Bandits! 🌟
💰 Ready to raid the USD/JPY "The Gopher" vault? 💰
Based on 🔥Thief Trading Style🔥 (technical + fundamental heist analysis), here’s the master plan to swipe bullish profits before the market turns against us! Escape near the high-risk Yellow MA Zone—overbought, consolidation, and bear traps ahead! 💸 "Take the money and run—you’ve earned it!" 🏆🚀
🕵️♂️ Heist Strategy:
📈 Entry (Bullish Raid):
The vault’s unlocked! Buy any price—this heist is LIVE!
Pullback lovers: Set buy limits at recent/swing lows for extra loot.
🛑 Stop Loss (Escape Route):
Thief SL at recent/swing low (4H/Day trade basis).
Adjust based on your risk, lot size, and multiple orders.
🎯 Target (Profit Escape):
148.700 (or flee earlier if bears ambush!)
⚔️ Scalpers’ Quick Strike:
LONG ONLY! If rich, attack now. If not, join swing traders & rob slowly.
Trailing SL = Your bodyguard! 💰🔒
💥 Why This Heist?
USD/JPY "The Ninja" is bullish due to key factors—check:
📌 Fundamental + Macro + COT Report
📌 Quantitative + Sentiment + Intermarket Analysis
📌 Future Targets & Overall Score (Linkks In the profile!) 🔗🌍
🚨 Trading Alert (News = Danger!):
Avoid new trades during news—volatility kills!
Trailing SL saves profits on running positions.
💖 Support the Heist Team!
💥 Smash the Boost Button! 💥
Help us steal more money daily with Thief Trading Style! 🏆🚀
Stay tuned—another heist is coming soon! 🤑🎯

USDJPY Potential UpsidesHey Traders, in tomorrow's trading we are monitoring USDJPY for a buying opportunity around 144.400 zone, USDJPY is trading in an uptrend and currently is in a correction phase in which it is approaching the trend at 144.400 support and resistance area.
Trade safe, Joe.

USDJPY Potential DownsidesHey Traders, in today's trading session we are monitoring USDJPY for a selling opportunity around 146.700 zone, USDJPY is trading in a downtrend and currently is in a correction phase in which it is approaching the trend at 146.700 support and resistance area.
Trade safe, Joe.

XAUUSD : Ready for More Upside Before Another Fall ?By analyzing the gold chart on the 4-hour timeframe, we can see that price initially followed our bullish scenario, climbing 140 pips up to $3336. However, after hitting that level, gold reversed and entered the bearish scenario, dropping below $3300 and eventually finding support around $3255.
This area acted as a strong demand zone, and we’ve since seen a rebound. Currently, gold is trading around $3273, and as long as price holds above the marked demand zone (Bullish Rejection Block), we may expect another bullish move before price potentially targets the liquidity below $3245 and $3203.
Please support me with your likes and comments to motivate me to share more analysis with you and share your opinion about the possible trend of this chart with me !
Best Regards , Arman Shaban
