Usdjpy4hrs

USDJPY buy opportunity USDJPY was in consolidation and i think it's going to go this time to complete a three wave pattern.


USDJPY PROJECTIONSI see a new high has been made extending past the kneckline of double bottom
I see a possible retest of the channel support.
EMAs still show a steady upward trend.
I wouldnt call short until we see this retest has succeeded.
If it fails we could see new highs.
my Target is around 117.5 long.
Im going to wait and see for any shorts. too early to say imo

USD/JPY WedgeThe dollar and yen have both been on the rise so I expect that UJ can range some more unless we get more imbalance from the Dollar. I'm interested to see how Trump's new tax plan will effect the rate as well as the planned rate hikes this year. We could see some volatile moves. For the time being if we stay within the wedge I will be looking to go long as short term. Though I am more neutral long term.

it seem a chance for long on USDJPY with 3 Targets.........downtrend broke out and revisit has been done with bullish candles.......wait till we see the market opening and with extra bullish candles we go LONG till mentioned 3 targets.......SL to be 20 pips (or how you manage your capital) bellow last support area

USDJPY : Reversal Pattern ApprovedRefer to previous analysis :-
Now, as promised, I have checked the S.O.P of reversal pattern. It's now valid.
Pending order is placed. Wait the price to take the supply before jump down.
Good luck
@scandicfx

USDJPY : Potential Reversal ZoneI will find reversal pattern in this area.
Get you guys updated.
I wish i won't miss this time..
Good Luck for Us..happy trading.
@scandicfx

How you can trade USDJPY for this weekI'm neutral about USDJPY because I'm not sure about who will be stronger next days, dollar or yen


USDJPY SELL OPPORTUNITY !FLAG FORMATION REPEATING ITSELF SO I AM WAITING TO GO SHORT AND MY FINAL TP WILL BE 112.500

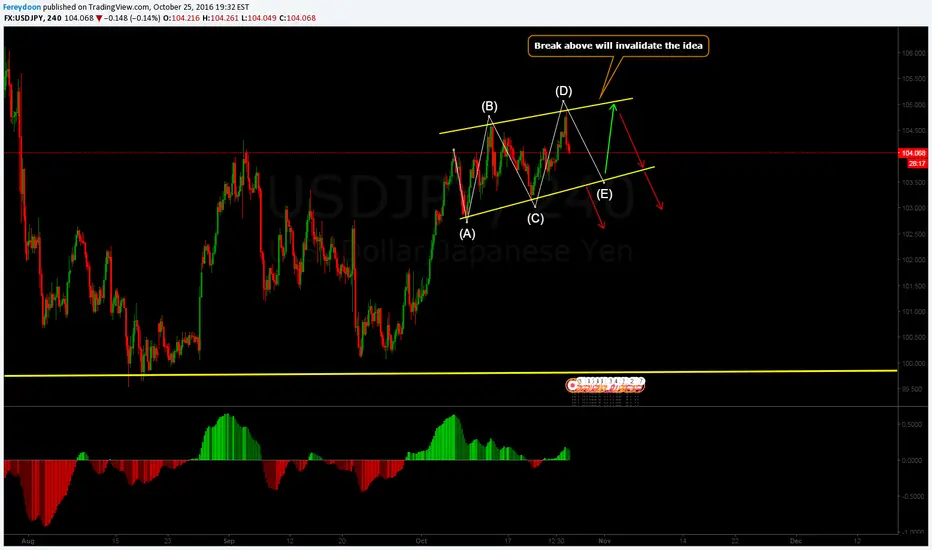
USDJPYwe have a bilateral chart pattern on ujsdjpy .. these are tricky because these signals that the price move either way


USDJPY @ 1h @ >114 (2nd upside trend since president election)Above 114 USDJPY is bullish once again !!!
114.87 USDJPY 1st support line - even buying option
114.77 USDJPY 2nd support line - even buying option
114.06 USDJPY 3rd support line - even buying option
I am excepting a exhaling at the beginning of next week - after this cross-rates run away today :)
I excepted an outbreak at weekstart on next trading day - even on monday ...
How ever, prices under 114 USDJPY would destroy this SetUp !!!
Take care
& analyzed it again
- it`s always your decission ...
(for a bigger picture zoom the chart)
Best regards
Aaron


USDJPY BEARISH FLAG TRADEAS SEEN ON PREVIOUS MARKET ACTIVITY, PRICE HAS CONSOLIDATED A IN BEARISH FORMATION.
MY IDEA IS THAT PRICE CONTINUE TO CONSOLIDATE IN THIS STRUCTURE AND WILL FALL FROM THE 102.800 PRICE LEVEL OR ON HITTING THE 103.800 LEVEL.
EITHER WAY, THERE ARE A GOOD 150 PIPS PROFIT WAITING TO BE TAKE ON THE USDJPY.


USD/JPY FIBONACCI ANALYSISDownward correction can continue for a short period. Growth tendency remains.
Price is trying to remain below the level of 102.30 (23.6% correction).
Short positions can be order after the level of 101.85, (descending 50% fan line, middle line of BB) is broken down.
Return to AUG lows 100.68.
If price rebounds from the level 102.30, it cud grow to 103.26 (38.2%)
Sell if price below 101.85, target @ AUG lows 100.68

USDJPY waiting for the reverse to go long.waiting for the decline in the resistance area to go long.

USDJPY-Short Position For 200 Pips!Based on AB=CD pattern , Time Ratio & Gann Analysis, It's a potential short position for at-least 200 pips.
I'll post a weekly chart, It has a potential to go up and then it will go for another down move.
.TP & SL are mentioned in the chart.
Adjust your Stop Loss according to your lot size,
account equity ,strategy & money management.
***If you want to get in this trade from this point or 106.200, you can still catch 100 pips till TP1 is reached, however there is still a possible move up towards my ideal entry point., It is recommended to enter with a smaller lot size if you want to go short right away & manage your stop loss accordingly.
Good Luck.!
* This is my personal view and analysis on this chart. If you follow this idea please plan your trade according to your lot size and account equity .
Don't forget to like, If you like my analysis :)

Multi timeframe analysis on YEN vs USDhere is my take on this pair on 3 different time frames :
Monthly :
We hit a major trend line dating back to 2002. Considering this pair has been a bull since 2012. what we see here is basically a pull back that took place from 1/7/15 till today. if by any chance we break the trend line, then this pair shall be officially bearish and may go back to 2012 low''s. We also just got out of RSI oversold position. I doubt we are going to visit it again. my take is bullish unless we break the trend line.
Daily :
We have a small trend line break out, which is already broken in 4hr time frame and a bigger trend line which am expecting the price go to. Based on the analysis on the monthly, we should break the bigger bigger trend line too. but till we reach there I will remain bullish and watch for price action. We are also just getting out of oversold RSI territory and MACD shows bullish signs.
4hr : Minor trend line is broken, expecting a small pull back and movement to the upside at least to 107.450
This is just a analysis and my take on this pair, please do your own research before taking any positions or even considering to do so.
