Usdjpy_long

USDJPY 15 Bullish GartleyGreetings,
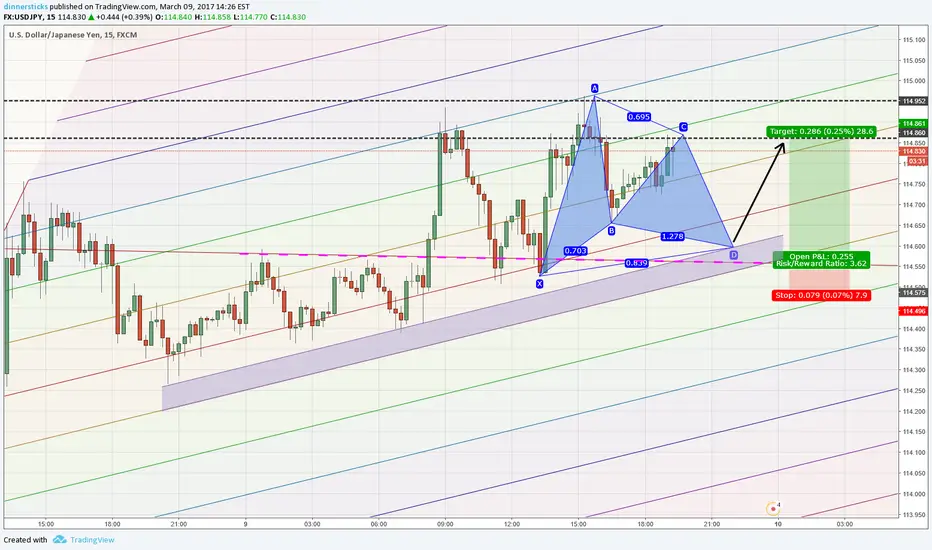
As you can see on the chart we have a possible gartley building with price respecting the pitchfork trendlines more or less. Price is currently testing resistance, should it get rejected we will await it at 114.580. The pink dashed line is a pitchfork trendline from the daily chart and should proof reliable.
If price does not go any higher we could also expect an AB=CD completion at this pink dashed trendline.
Goodluck !
Usdjpy Short On ContinuationI am expecting a drop here let me explain to your guys the reasons.
.Compression Zone
.Price too expensive to buy
.Price Holding At Certain Level
.Triangle Compression
Good Luck Regards MJ (usd/jpy)

USDJPY short term on a break of 113.20 a long position could be possible. The next major resistance is at 113.75


USDJPY short term2 different possibilites.
a test and break fail at the 113.15 zone which would send UJ bullish up to the 114.3 zone or a break below 113 with a retest from the bottom side and a bearish move down to 112. For a short position you will want to see a break of the trend line on momentum as well which would open up the bottom side for a nice 100 pip short position.

long USDJPY @ 1h @ trading capability for this 2nd week `17This is only a trading capability - no recommendation !!!
Buying/Selling or even only watching is always your own responsibility ...
more detailed stats (all 21 Major Cross-Rates) of 1st week 2017 @ my GOOGLE Drive
drive.google.com
Best regards :)
Aaron


(USDJPY) Daily - Speculation and AnalysisI posted an idea earlier speculating the end of bearish movement in this pair but after trying the bottom resistance once more, we are heading the same direction we initially predicted. Am expecting upward movement at least to the channel, then we shall observe price action, if we break the trend line we are long term buyers, if not then we might head down once again.
---------------------------------------------------------------------------------------------------------------------------------------------------------------------------------------------------------
Liability Disclaimer : All trades posted here are my personal view of the market.
If your planning to use them as signal, do your own research first and you are responsible for your own entries, exit, profit and loss management.
---------------------------------------------------------------------------------------------------------------------------------------------------------------------------------------------------------
- Improve you trade accuracy using Mongers Kit
Mongers Kit is complete traders toolbox, with all the data and news you need to have successfull trades. Mongers Kit is packed with features such as :
1) order flows in real time.
2) current open positions from 4 different brokers.
3) real time news update.
4) T.V and Radio to your favourite channels (Bloomberg, CNN, ABC, etc).
5) Dynamic sessions - see all the rises and falls in each session.
and much more, get your kit now at www.mongerskit.com
If your my follower, you get 20% discount on your purchase of Mongers Kit.
Contact me for more details.

USDJPY - 6400 Pips Trade ! Time To Make Good Money !Based on AB=CD pattern , Time Ratio & Gann Analysis. This is a potential trade for at-least 6400 Pips!
This trade has a complete structure and every single move will earn you Huge Pips. I have tried to mark the best entry points for both sides (Short & Long).
If you follow this trade properly , this single trade will be enough for a year :)
I have also posted a 4hr chart for a short position.
.TP & SL are mentioned in the chart.
Adjust your Stop Loss according to your lot size,
account equity ,strategy & money management.
***If you want to get in this trade from this point or 106.000, you can still catch 400 pips till TP1 is reached, however there may be a pullback , It is recommended to enter with a smaller lot size if you want to take a long position right away & manage your stop loss accordingly.
Good Luck.!
* This is my personal view and analysis on this chart. If you follow this idea please plan your trade according to your lot size and account equity .
Don't forget to like, If you like my analysis :)

Perspective over USDJPY for June 16'Here are some possible movements of the market in the days to come. Most likely is to bounce between the red lines on the graph.
Have fuuun!


Multi timeframe analysis on YEN vs USDhere is my take on this pair on 3 different time frames :
Monthly :
We hit a major trend line dating back to 2002. Considering this pair has been a bull since 2012. what we see here is basically a pull back that took place from 1/7/15 till today. if by any chance we break the trend line, then this pair shall be officially bearish and may go back to 2012 low''s. We also just got out of RSI oversold position. I doubt we are going to visit it again. my take is bullish unless we break the trend line.
Daily :
We have a small trend line break out, which is already broken in 4hr time frame and a bigger trend line which am expecting the price go to. Based on the analysis on the monthly, we should break the bigger bigger trend line too. but till we reach there I will remain bullish and watch for price action. We are also just getting out of oversold RSI territory and MACD shows bullish signs.
4hr : Minor trend line is broken, expecting a small pull back and movement to the upside at least to 107.450
This is just a analysis and my take on this pair, please do your own research before taking any positions or even considering to do so.

USDJPY LONG Thakns to uor amazing technical analysis we could affermate USDJPY LONG.
Our pattern shows the price will reach is 112.000 in the next 3 months.
we are long at 106.000
STAY TUNED

LONG USD JPYUSD JPY bullish views from yesterday , as technically pair trading on channel pattern, it should continue to complete channel pattern shadow.
BUY USD JPY
111.52
Target: 112.40
Stop loss: 111.04
Good Luck !


Bullish Cypher on $USDJPYBullish cypher with double bottom on $USDJPY pair with a nice retracement on 31.8 fibonacci. A possible long to the 115 level.


Daily Market Report - USD/JPY - 10th Feb 2016USD/JPY
Japanese Yen sustain advance against most counterparts on safe-haven demand after global equity drop on Global Economy growth concern
Market managed to break below 115.50 zone which add more pressure to sustain advance toward first target 113.60
As short-run sustain trades below 116.00-50 resistance zone expect farther drop toward 113.60
Mid-Run: market showing strong bearish signals after breaking below uptrend channel which may lead the mid-run toward farther drop toward 106.60
www.tradingsignalreviews.com

Forex Market Analysis - 7th Feb 2016
The primary trend of USD/JPY is bearish on charts and price is trading below the trend line in its 4 hourly chart. In 4 hourly chart the price is below 200 day SMA and 50 day SMA indicating downtrend of the pair. It is having an important level of 116.80. If it breaks its trend-line (black line) on the downside and sustains below it then we can expect it to show further bearish movement in the pair.
If the pair breaks the level of 116.81, then we can expect it to test the levels of 118.
INDICATORS:-
MACD is sustaining in its negative territory although has crossed on the daily indicating a change in trend in the pair.
RSI is leaving its selling zone indicating the upcoming bullish trend in the pair.
STRATEGY:
USD/JPY is looking bearish on charts for next few trading session. One can go for sell on higher level strategy for this pair for intra day to mid term positions in it.
Please like and comment your ideas and good luck! :)
www.tradingsignalreviews.com
