UsdJpy buy bias The previous day was bullish, and we clear previous week low 148.919 and there's a break on H4
My point of interest is 149.068 let's watch what price would do maybe it'll get to my draw on Liquidity at 150.654
Kindly boost if you find this insightful 🫴
Usdjpyanalysis

USDJPY Will Grow!
HI,Traders !
USD-JPY is already making
A local bullish rebound from
The horizontal support
Level of 149.154 so we are
Locally bullish biased and
We will be expecting a
Further move up !
Comment and subscribe to help us grow !

USDJPY: remains below 150.00Furthermore, any significant retracement could find immediate support near the 149.50 level, which is followed closely by the 149.00 round number. A break below the latter might expose the USD/JPY pair to a retest of the 148.50 region, a level seen as the next strong support. Sustained weakness below this area could pave the way for a deeper corrective decline, with the next target around the 148.00 level. Traders will likely keep a close eye on these levels, as they could provide fresh directional impetus for the pair.

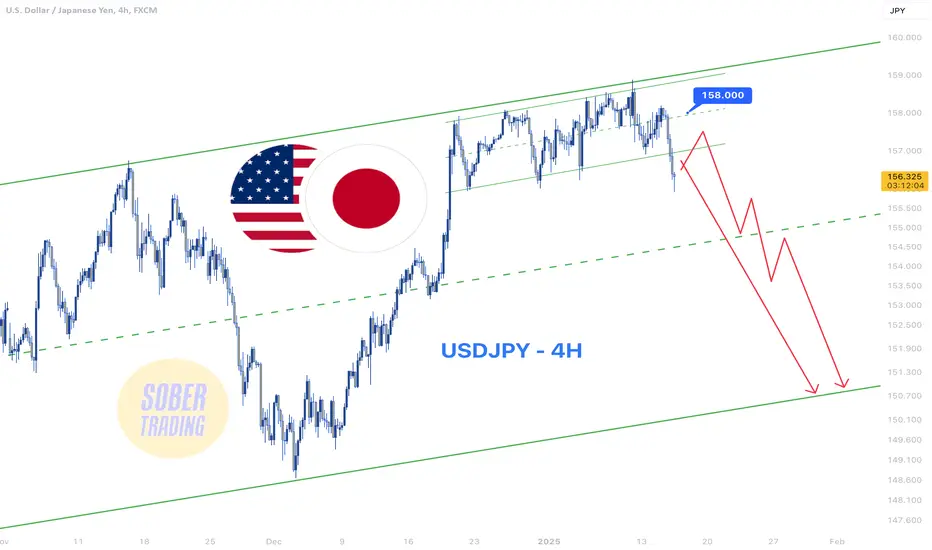
USDJPY - 4H Short Opportunities Amid DowntrendFollowing the sharp fall in FX:USDJPY after PPI and CPI news, we expect further downside, potentially reaching the middle or bottom of the channel. 📉
Each push-up could be a short entry opportunity. Even a strong rise below 158 might be a dead cat bounce and a better short entry point. Stay cautious and strategic! 🔻
USDJPY Weekly BiasThis pair has been on a bearish momentum for the past few weeks and I do anticipate that it will continue.
My targets are;
1. 148.68 - Towards the Sellside Liquidity
2. 147.4 - Towards the Weekly FVG
The daily and hourly timeframe will give us our entry price.

USD/JPY Recovers After Dropping Below 150 Yen per DollarUSD/JPY Recovers After Dropping Below 150 Yen per Dollar
As the USD/JPY chart shows:
→ Yesterday, the pair fell below the psychological level of 150 yen per dollar.
→ However, today it staged a strong recovery, rising back above this level.
The yen weakened following the release of Japan's inflation data. According to Forex Factory, the National Core CPI increased by 3.2% year-over-year (forecast: 3.1%, previous: 3.0%).
According to Reuters:
→ The 19-month high in CPI strengthens expectations of further interest rate hikes in Japan.
→ The yen is weakening as Bank of Japan Governor Kazuo Ueda stated that the central bank may step up government bond purchases if long-term interest rates rise.
Can USD/JPY Continue to Rise?
USD/JPY Technical Analysis
On 12th February, we noted that key highs and lows over the past three months formed an ascending channel, with the 154 yen per dollar level acting as a resistance barrier.
Indeed, since then, bulls have failed to sustain levels above 154 yen per dollar (as indicated by the arrow), leading to a decline below the lower boundary of the blue channel after a brief rebound on 18th February.
As a result, the former support at the lower boundary of the blue channel may now act as resistance around 151.3 yen per dollar, reinforcing the relevance of the descending channel (marked in red).
The trajectory of USD/JPY today could be significantly influenced by the release of the US Flash Manufacturing PMI and Flash Services PMI indices at 16:45 GMT+2.
Trade on TradingView with FXOpen. Consider opening an account and access over 700 markets with tight spreads from 0.0 pips and low commissions from $1.50 per lot.
This article represents the opinion of the Companies operating under the FXOpen brand only. It is not to be construed as an offer, solicitation, or recommendation with respect to products and services provided by the Companies operating under the FXOpen brand, nor is it to be considered financial advice.

USDJPY Top-down analysis Hello traders, this is a complete multiple timeframe analysis of this pair. We see could find significant trading opportunities as per analysis upon price action confirmation we may take this trade. Smash the like button if you find value in this analysis and drop a comment if you have any questions or let me know which pair to cover in my next analysis.

USDJPY SHORT SETUP USDJPY overall 4 hour trend is Bullish (Major Trend) the current trend is a retracement and could still push lower to maybe the equal, we have a 4hour break with a 30 min confirmation that we could continue selling.

USDJPY SellAccording to the daily bias ~ bearish (based on the previous analysis), I do anticipate that this price will continue with the bearish momentum.
The price has retracted towards the Volume Based Inefficiency and the price might target 151.2 and 150.93 Levels.

DeGRAM | USDJPY continued growth in the channelUSDJPY is in an ascending channel between the trend lines.
The price is moving from the lower boundary of the channel and a strong support level.
The chart is maintaining a harmonic pattern.
We expect the growth to continue.
-------------------
Share your opinion in the comments and support the idea with like. Thanks for your support!

Market Analysis: USD/JPY Turns RedMarket Analysis: USD/JPY Turns Red
USD/JPY declined below 153.00 and is currently consolidating losses.
Important Takeaways for USD/JPY Analysis Today
- USD/JPY is trading in a bearish zone below the 153.00 and 152.50 levels.
- There is a short-term rising channel forming with support near 151.60 on the hourly chart at FXOpen.
USD/JPY Technical Analysis
On the hourly chart of USD/JPY at FXOpen, the pair started a steady decline from well above the 154.00 zone. The US Dollar gained bearish momentum below the 153.00 support against the Japanese Yen.
The pair even settled below the 152.50 level and the 50-hour simple moving average. There was a spike below 151.50 and the pair traded as low as 151.23. It is now correcting losses and trading above the 50-hour simple moving average.
Immediate resistance on the USD/JPY chart is near the 23.6% Fib retracement level of the recent decline from the 154.80 swing high to the 151.23 low at 152.05.
The first major resistance is near the 153.00 zone and the 50% Fib retracement level of the recent decline from the 154.80 swing high to the 151.23 low. If there is a close above the 153.00 level and the hourly RSI moves above 60, the pair could rise toward 153.95.
The next major resistance is near 154.80, above which the pair could test 155.50 in the coming days. On the downside, the first major support is near 151.60. There is also a short-term rising channel forming with support near 151.60.
The next major support is near the 151.20 level. If there is a close below 151.20, the pair could decline steadily. In the stated case, the pair might drop toward the 150.00 support.
Trade on TradingView with FXOpen. Consider opening an account and access over 700 markets with tight spreads from 0.0 pips and low commissions from $1.50 per lot.
This article represents the opinion of the Companies operating under the FXOpen brand only. It is not to be construed as an offer, solicitation, or recommendation with respect to products and services provided by the Companies operating under the FXOpen brand, nor is it to be considered financial advice.

USDJPY set for 50 pip drop?USDJPY after 2nd liquidity grab from daily resistance has got a strong rejection. As of long term trend is down, the price may continue to drop daily support or lower. Upon pullback on 1hour chart, upon liquidity grab, A possible sell trade in USDJPY.

USDJPY top-down analysis Hello traders, this is a complete multiple timeframe analysis of this pair. We see could find significant trading opportunities as per analysis upon price action confirmation we may take this trade. Smash the like button if you find value in this analysis and drop a comment if you have any questions or let me know which pair to cover in my next analysis.

USDJPY Daily BiasThe price has been on a bearish momentum for the past few days and I do anticipate that the momentum will continue.
The price had retracted towards the Volume Based Inefficiency formed around 152.2 and my sell entry position will be determined in a smaller TF (15 Minutes) in a follow up analysis on the same.

USDJPY BearishConsidering that my bias is bearish for this pair (Based on Weekly and Daily Timeframes), I was waiting for the market to pullback to the 151.93 Zone, which is my OTE for the sell entry.
My target is towards the Sellside Liquidity at 151.

USDJPY and GBPJPY Top-down analysisHello traders, this is a complete multiple timeframe analysis of this pair. We see could find significant trading opportunities as per analysis upon price action confirmation we may take this trade. Smash the like button if you find value in this analysis and drop a comment if you have any questions or let me know which pair to cover in my next analysis

USDJPY Top-down analysis Hello traders, this is a complete multiple timeframe analysis of this pair. We see could find significant trading opportunities as per analysis upon price action confirmation we may take this trade. Smash the like button if you find value in this analysis and drop a comment if you have any questions or let me know which pair to cover in my next analysis.

USD/JPY Falls from 154.80 – Is 146 the Next Target?In my post last week about USD/JPY, I mentioned that the pair could resume its decline and draw attention to the 154+ sell zone.
Indeed, USD/JPY started falling after reaching 154.80 and is now trading at 151.72, which is very close to a key horizontal support level.
Looking ahead, I expect this support to break, pushing the pair below 150 and potentially down to the next horizontal support around 146.
In conclusion, my strategy remains unchanged: I will continue looking to sell rallies, with invalidation above last week’s high.
Disclosure: I am part of Trade Nation's Influencer program and receive a monthly fee for using their TradingView charts in my analyses and educational articles.

USDJPY selling pressure continues, The Week Ahead 17th Feb 25The USDJPY currency pair price action sentiment appears bearish, supported by the longer-term prevailing downtrend.
The key trading level is at 155.50, which is the current swing high. An oversold rally from the current levels and a bearish rejection from the 155.50 level could target the downside support at 152.76 followed by 151.50 and 150.90 levels over the longer timeframe.
Alternatively, a confirmed breakout above 155.50 resistance and a daily close above that level would negate the bearish outlook opening the way for further rallies higher and a retest of 156.00 resistance level followed by 156.74 and 157.70.
This communication is for informational purposes only and should not be viewed as any form of recommendation as to a particular course of action or as investment advice. It is not intended as an offer or solicitation for the purchase or sale of any financial instrument or as an official confirmation of any transaction. Opinions, estimates and assumptions expressed herein are made as of the date of this communication and are subject to change without notice. This communication has been prepared based upon information, including market prices, data and other information, believed to be reliable; however, Trade Nation does not warrant its completeness or accuracy. All market prices and market data contained in or attached to this communication are indicative and subject to change without notice.

USDJPY Resistance Cluster!
HI,Traders !
USD-JPY made a bullish
Rebound But has now hit a resistance
Cluster of the horizontal and
Falling resistance lines
Around 154.180 area
From where we will be
Expecting a bearish move down !
Comment and subscribe to help us grow !

USDJPY downtrend continues capped by resistance at 155.50 The USDJPY currency pair price action sentiment appears bearish, supported by the longer-term prevailing downtrend.
The key trading level is at 155.50, which is the current swing high. An oversold rally from the current levels and a bearish rejection from the 155.50 level could target the downside support at 152.76 followed by 151.50 and 150.90 levels over the longer timeframe.
Alternatively, a confirmed breakout above 155.50 resistance and a daily close above that level would negate the bearish outlook opening the way for further rallies higher and a retest of 156.00 resistance level followed by 156.74 and 157.70.
This communication is for informational purposes only and should not be viewed as any form of recommendation as to a particular course of action or as investment advice. It is not intended as an offer or solicitation for the purchase or sale of any financial instrument or as an official confirmation of any transaction. Opinions, estimates and assumptions expressed herein are made as of the date of this communication and are subject to change without notice. This communication has been prepared based upon information, including market prices, data and other information, believed to be reliable; however, Trade Nation does not warrant its completeness or accuracy. All market prices and market data contained in or attached to this communication are indicative and subject to change without notice.

USDJPY US CPI triggered spikeThe USDJPY currency pair price action sentiment appears bearish, supported by the longer-term prevailing downtrend.
The key trading level is at 155.50, which is the current swing high. An oversold rally from the current levels and a bearish rejection from the 155.50 level could target the downside support at 152.76 followed by 151.50 and 150.90 levels over the longer timeframe.
Alternatively, a confirmed breakout above 155.50 resistance and a daily close above that level would negate the bearish outlook opening the way for further rallies higher and a retest of 156.00 resistance level followed by 156.74 and 157.70.
This communication is for informational purposes only and should not be viewed as any form of recommendation as to a particular course of action or as investment advice. It is not intended as an offer or solicitation for the purchase or sale of any financial instrument or as an official confirmation of any transaction. Opinions, estimates and assumptions expressed herein are made as of the date of this communication and are subject to change without notice. This communication has been prepared based upon information, including market prices, data and other information, believed to be reliable; however, Trade Nation does not warrant its completeness or accuracy. All market prices and market data contained in or attached to this communication are indicative and subject to change without notice.

USDJPY - Demand Ready for Lift-Off (Technical Analysis)As it stands we're currently holding short positions on USDJPY since last week.
The current short term still suggests that this pair is bearish -
We have seen lower lows and institutional manipulation to the upside as well, so we will continue holding our shorts until we see a reversal on the lower time frames.
Previous Analysis:
We traded down to the Daily demand levels (which price has now reached).
The current price cycle indicates it's still distributing but now is the time to watch for potential bullish reversals - more-so when we combine this with our DXY analysis as well as current Geopolitical moves, we could definitely see a bullish surge in the next few days.
Trading Considerations:
All signs point to a pending bullish reversal, don't engage without considering the LTF trend, we would ideally like to see it reverse first.
Trade what you see, not what you think you might.
Disclaimer: This analysis is for informational purposes only and does not constitute financial advice. Trading involves substantial risk and may not be suitable for all investors. Conduct your own research and consult with a financial advisor before making any investment decisions.
OANDA:USDJPY TVC:DXY
