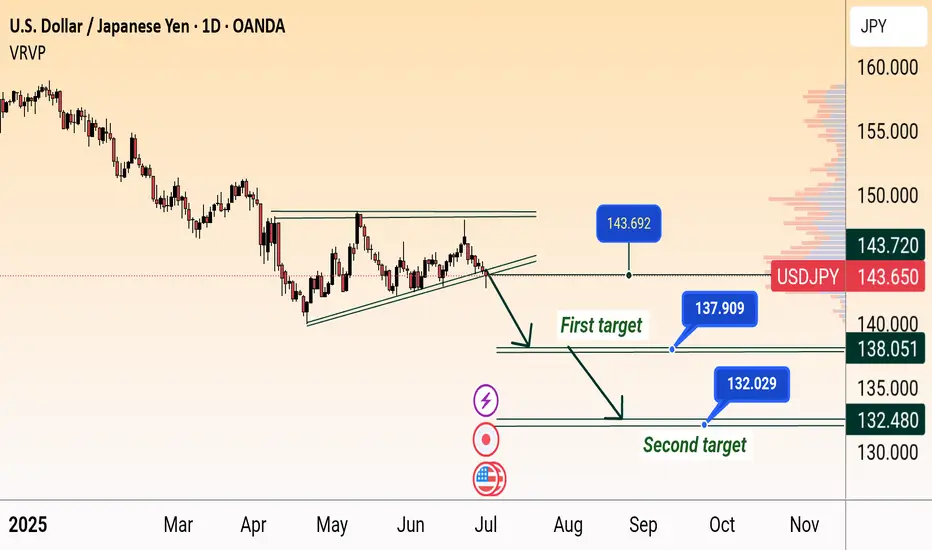
USD/JPY Bearish Breakdown Targets 138 & 132USD/JPY Bearish Breakdown Setup (Daily Chart)
USD/JPY breaks below rising wedge support near 144, signaling potential downside. Price targets are marked at 138.051 (first target) and 132.480 (second target), indicating possible continued weakness if the bearish momentum holds.
Usdjpyanalysis
DeGRAM | USDJPY correction 📊 Technical Analysis
● Monday's rebound above the 4-month falling trend line was quickly repelled, leaving a “false breakdown” candle; price has returned under the line and is now retesting it as resistance around 144.65.
● The rebound also stopped at the top of the triangle and a small bearish flag formed; the height of the pattern points to the 142.80 support band and the broader channel to 139.90 as continuation.
💡 Fundamental analysis
● Softer U.S. core GDP data drove 2-year Treasury yields to two-week lows, reducing the rate differential that favored the dollar.
Meanwhile, Japanese officials again warned that they “do not rule out any measures” against excessive yen weakening, raising the risk of intervention and discouraging new long USD/JPY positions.
Summary
Short 144.4 - 144.65; break below 143.8 targets 142.8 -> 139.9. Bearish view loses strength with a 4-hour close above 145.30.
-------------------
Share your opinion in the comments and support the idea with like. Thanks for your support!

USDJPY FXAN & Heikin Ashi exampleIn this video, I’ll be sharing my analysis of USDJPY, using FXAN's proprietary algo indicators with my unique Heikin Ashi strategy. I’ll walk you through the reasoning behind my trade setup and highlight key areas where I’m anticipating potential opportunities.
I’m always happy to receive any feedback.
Like, share and comment! ❤️
Thank you for watching my videos! 🙏

USD/JPY "The Ninja Heist" – Bullish Loot Grab!🌟 Hey, Thieves & Market Bandits! 🌟
💰 Ready to raid the USD/JPY "The Gopher" vault? 💰
Based on 🔥Thief Trading Style🔥 (technical + fundamental heist analysis), here’s the master plan to swipe bullish profits before the market turns against us! Escape near the high-risk Yellow MA Zone—overbought, consolidation, and bear traps ahead! 💸 "Take the money and run—you’ve earned it!" 🏆🚀
🕵️♂️ Heist Strategy:
📈 Entry (Bullish Raid):
The vault’s unlocked! Buy any price—this heist is LIVE!
Pullback lovers: Set buy limits at recent/swing lows for extra loot.
🛑 Stop Loss (Escape Route):
Thief SL at recent/swing low (4H/Day trade basis).
Adjust based on your risk, lot size, and multiple orders.
🎯 Target (Profit Escape):
148.700 (or flee earlier if bears ambush!)
⚔️ Scalpers’ Quick Strike:
LONG ONLY! If rich, attack now. If not, join swing traders & rob slowly.
Trailing SL = Your bodyguard! 💰🔒
💥 Why This Heist?
USD/JPY "The Ninja" is bullish due to key factors—check:
📌 Fundamental + Macro + COT Report
📌 Quantitative + Sentiment + Intermarket Analysis
📌 Future Targets & Overall Score (Linkks In the profile!) 🔗🌍
🚨 Trading Alert (News = Danger!):
Avoid new trades during news—volatility kills!
Trailing SL saves profits on running positions.
💖 Support the Heist Team!
💥 Smash the Boost Button! 💥
Help us steal more money daily with Thief Trading Style! 🏆🚀
Stay tuned—another heist is coming soon! 🤑🎯

USDJPY and USDCAD Analysis todayHello traders, this is a complete multiple timeframe analysis of this pair. We see could find significant trading opportunities as per analysis upon price action confirmation we may take this trade. Smash the like button if you find value in this analysis and drop a comment if you have any questions or let me know which pair to cover in my next analysis.

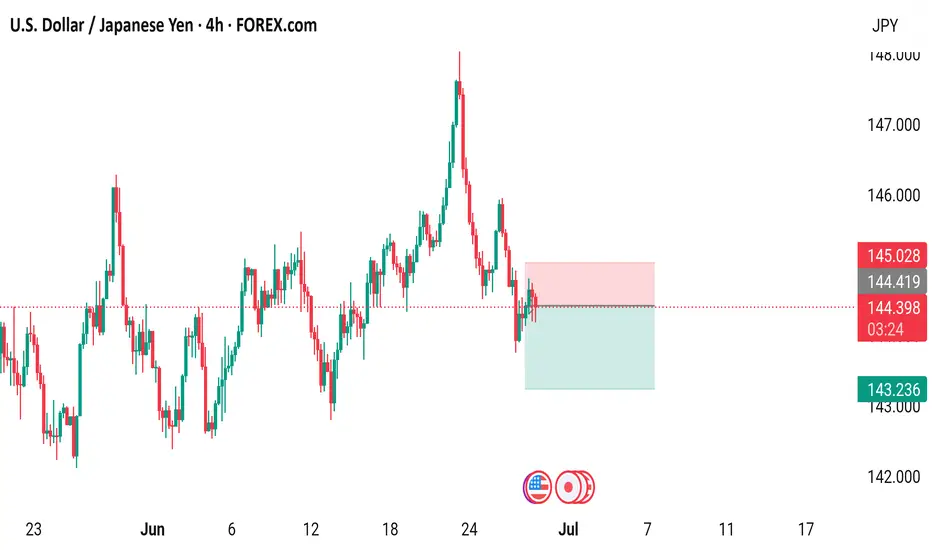
USD/JPY 4-Hour Forex Chart4-hour performance of the U.S. Dollar (USD) against the Japanese Yen (JPY) from FOREX.com, showing a current exchange rate of 144.351 with a slight decrease of 0.063 (-0.04%). The chart highlights a recent sharp upward movement followed by a decline, with key support and resistance levels marked around 144.419 and 145.028, respectively. The time frame spans from late June to early July 2025.
Is USDJPY in a Downtrend?USDJPY is supported by the trendline and the price is facing the resistance zone of 144.500. If the candle cannot close above this resistance zone, the sellers can push the price to break the trendline and head towards the support zone of 142.700. This support zone plays an important role in shaping the trend if broken the downtrend can be extended and no support zone can be strong enough to push the price of the pair until 140.300.
There is still a high possibility of a reaction so the BUY strategy at the support zone of 142.700 is still ready
On the other hand, if the candle closes above the resistance zone of 144.500, the uptrend is still maintained and heading towards this week's peak around 147.500. Pay attention to the price reaction at 146.000.

USD/JPY) bearish Trand analysis Read The captionSMC trading point update
Technical analysis of USD/JPY on the 3-hour timeframe, highlighting a breakdown from trendline resistance and projecting a move toward a significant downside target.
---
Technical Breakdown
1. Trendline Rejection
Price sharply rejected from the descending resistance trendline near 148.00 (red arrow), forming a potential lower high.
This suggests continuation of the broader downtrend structure.
2. Break Below EMA 200
Price has broken below the 200 EMA (144.752), signaling a shift in momentum from bullish to bearish.
EMA is likely to act as dynamic resistance if price attempts a pullback.
3. Bearish Projection
The chart outlines a measured move downward toward the target point at 139.955, implying a drop of over 5.36% (approximately 770 pips).
The projected path shows lower highs and lower lows, confirming bearish structure.
4. RSI Confirmation
RSI (14) is currently at 29.98, indicating oversold conditions, but this often supports strong momentum in trending markets—suggesting a possible continuation lower after minor retracements.
Mr SMC Trading point
---
Conclusion / Idea Summary
Bias: Bearish
Entry: After trendline rejection and EMA 200 break (~144.75)
Target: 139.955
Invalidation: Break above 148.00 resistance trendline
---
Please support boost 🚀 this analysis)

USD/JPY Bullish Reversal AnalysisUSD/JPY Bullish Reversal Analysis 📈💹
🔍 Technical Overview:
The chart illustrates a strong bullish reversal pattern forming on USD/JPY after price reacted from a key support zone at 144.600. This level has held firm multiple times, marked by green arrows, signaling strong buying interest.
📐 Chart Patterns & Structure:
✅ A bullish harmonic pattern (possibly a bullish Bat or Gartley) is completing near the 144.600 zone.
🔄 Multiple rejection wicks and bullish engulfing patterns indicate a potential upside reversal.
🔵 Descending trendlines have been broken, confirming momentum shift.
🔁 Previous resistance turned support (near 145.000) is acting as a possible launchpad for the next move.
🎯 Upside Target:
The projected move targets the resistance zone at 147.698, aligning with previous highs and a significant supply area.
If price breaks above 145.900 convincingly, continuation toward this resistance is expected.
🔻 Downside Risk:
A break below 144.600 would invalidate the bullish setup and expose price to the lower support range near 142.000–143.000.
📊 Conclusion:
USD/JPY is showing signs of bullish reversal from a strong demand zone. If price sustains above 145.000 and breaks the minor consolidation, the pair could rally toward 147.698 🎯.
Bias: Bullish ✅
Support: 144.600
Resistance: 147.698

USD/JPY 4-Hour Forex Chart4-hour chart from FOREX.com displays the exchange rate between the U.S. Dollar (USD) and the Japanese Yen (JPY) as of June 25, 2025. The current rate is 145.156, reflecting a 0.16% increase (+0.226). The chart highlights a recent sharp upward movement followed by a decline, with key support and resistance levels marked around 144.484 and 145.731, respectively. The shaded areas indicate potential trading ranges, with the current price hovering near the upper boundary.

USDJPY Analysis🚀 We entered the buy trade from the bottom level (check the pinned idea)
Thanks to our trailing stop strategy, we locked in full profits ✅
For those who missed it — a new buy zone is now marked on the chart!
Be patient and don’t trade emotionally ✋

DeGRAM | USDJPY retesting the resistance level📊 Technical Analysis
● Four consecutive higher-lows off 140.9 have carved a rising flag that presses the channel roof (144.8); flag depth projects to the April swing-top/ Fib cluster at 147.8 once 145 is cleared.
● Daily RSI holds above 50 and price is now trading back above the broken wedge-cap (142.9), confirming it as demand and tilting risk toward the 150.9 macro ceiling.
💡 Fundamental Analysis
● US 2-yr yields stay >4.70 % after solid ISM-services prices, while BoJ minutes show members preferring “patient” normalisation; the widening policy gap keeps yen funding pressure intact.
✨ Summary
Long 142.9-144.0; break of 145 targets 147.8, stretch 150.9. Bull view invalidated on a daily close below 140.9.
-------------------
Share your opinion in the comments and support the idea with like. Thanks for your support!

USD/JPY Bullish Reversal Trade Setup – Key Support Test at 145.2Entry Point: 145.273 (highlighted in blue)
Stop Loss: ~144.817–145.260 (purple zone)
Target Point (TP): 148.133 (upper resistance zone)
📉 Recent Price Action:
Price peaked near 148.05 before reversing sharply and breaking the trendline.
The market is currently testing the support zone (near the 145.273 entry level).
Moving averages (red = short-term, blue = long-term) show a crossover to the downside, suggesting short-term bearish momentum.
📈 Trade Setup:
Strategy Type: Long (Buy) Setup
Risk/Reward: Favorable, approximately 1:2+
Entry Zone: The current price is close to the entry level at 145.273, making this a timely area to watch for a bounce or confirmation.
⚠️ Risk Factors:
If price breaks below 144.817, the setup becomes invalid.
Short-term momentum is still bearish; confirmation (like a bullish engulfing candle or support hold) is important before entering.
✅ Confirmation Triggers for Entry:
Strong bullish candlestick pattern near entry zone.
RSI or MACD bullish divergence (not shown but useful to check).
Volume spike on bounce from support.

USDJPY Trading StrategyUSDJPY is looking to break the resistance zone of 147,000. The current bullish force of USDJPY is too strong, so jumping in to catch the top at the present time will be quite risky. If you want a SELL signal, you must wait for the confirmation of the sellers jumping into the market by the confirmation of the red closing m30 candle.
There will be a beautiful SELL signal if the h4 candle shrinks its wick below 147,000. If it closes above the SELL point, you must wait for 148,100, or if you want to BUY, wait for the retest and create a beautiful bullish wave in the small time frame.
On the other hand, if the currency pair declines back to the support zone of 146,000 and 145,200, it will give us a long-term BUY signal.
Support 146,000-145,200
Resistance 117,100-148,100

USD/JPY Long Trade Setup – Key Support Rebound Targeting 148.674Entry Point:
Price: 143.373
The chart suggests initiating a long (buy) position at this level, which is just slightly below the current market price.
Stop Loss:
Price: 141.707
Positioned below a strong support zone. This level protects the trade from excessive downside risk if the price breaks down.
Target Point:
Price: 148.674
The target is clearly defined, indicating a potential gain of approximately 5.991 points, or 4.20% from the entry.
🟪 Support/Resistance Zones
The purple boxes indicate demand (support) and supply (resistance) zones.
The lower zone (entry/stop area) shows a historically significant support range that has been tested multiple times (indicated with orange circles).
The upper purple zone marks the take-profit area, which coincides with previous resistance.
📊 Moving Averages
Blue Line: 200 EMA (Exponential Moving Average) – acting as dynamic resistance.
Red Line: 50 EMA – price is currently trading below it, indicating bearish short-term pressure but potential for reversal.
🧠 Trade Idea Summary
Bias: Bullish (long position)
Risk-Reward Ratio: Favorable
Risk: ~1.67 points (from 143.373 to 141.707)
Reward: ~5.3 points (from 143.373 to 148.674)
Approx. R:R = 1:3.17
Validation: The setup relies on the price holding the key support zone and bouncing higher, targeting the next major resistance.
⚠️ Considerations
Monitor for bullish candlestick patterns near the entry zone.
Keep an eye on macroeconomic news (like BoJ or Fed updates) that could cause volatility in USD/JPY.
Confirm momentum shift with RSI or MACD if using indicators.

GBPJPY and USDJPY Analysis todayHello traders, this is a complete multiple timeframe analysis of this pair. We see could find significant trading opportunities as per analysis upon price action confirmation we may take this trade. Smash the like button if you find value in this analysis and drop a comment if you have any questions or let me know which pair to cover in my next analysis.

USD/JPY Breaks Higher – Bullish Momentum Targets 148.40FX:USDJPY CMCMARKETS:USDJPY USD/JPY continues to climb, extending gains above the key 146.00 breakout level, supported by Fed–BoJ policy divergence and rising geopolitical tensions. Despite Japan’s strong CPI and PMI prints, the BoJ maintains a dovish tone, while tariff concerns continue to cap yen sentiment. The Middle East conflict further fuels demand for the USD as a safe haven.
Technically, the pair confirmed a bullish breakout, with price hugging the upper Bollinger Band – a sign of sustained upside pressure. As long as 146.00 holds, bulls may aim for the 148.40 monthly resistance.
Key Levels :
Resistance : 146.75 / 148.40
Support : 146.00 / 145.25
⚠️ Momentum favours the upside while above 146.00. Break below may trigger short-term pullback toward 145.25.

Long - the final move up before moving to the downsideMy macro bias for USDJPY is bearish. However, I opened a long position today.
Reasons for a long trade:
Weekly chart:
1) Both MACD and RSI are in the bear territory, however, both MACD and RSI lines are starting to cross and move to the upside.
2) The price has been moving sideways for weeks, however, weekly candle has been forming higher low since late April (subtle move).
3) There is a major support line at 140.50 area and weekly EMA200 is also sitting right below it.
Although the price has been moving to the downside, it will require strong momentum to pierce through the major support zone that has been holding since July 2023.
Daily chart:
1) EMA9 > EMA14 > EMA 21 - bullish trend
2) Yesterday's daily candle retested EMA 9/14/21 and closed above all of them.
3) MACD has entered the bull zone.
4) RSI has entered the bull zone.
5) There is an unmitigated fair value gap in the Fib 0.618-0.786 area. (see blue rectangular box in the chart).
As I said above, it will take strong momentum for the price to break below the major support line. It makes sense for the price to retrace to the unmitigated fair value gap area to take out all the liquidity to fuel the momentum to the downside.
My trade setup is below:
Entry: 145 Stop/Loss: 144.25 (just under yesterday's candle wick)Target: 147.12
Risk:Rewards 1:1.78

USDJPY H4 AnalysisUSDJPY Showing a Bearish Flag. If it breaks this zone above, Most probably can fly up to 148.668 and higher to 150.538. If no, Can rally between 143.981 or even lower to 142.410. Trading Analysis from 23-06-25 to 27-06-25. Take your risk under control and wait for market to break support or resistance on smaller time frame. Best of luck everyone and happy trading.🤗

buy is coming on USDJPYThe USD/JPY pair recently experienced a bearish movement, which is largely influenced by heightened concerns surrounding the ongoing trade and tariff tensions between the U.S. and its global counterparts. This risk-off sentiment triggered a flight to safe-haven assets, weighing on the pair.
However, price action has now approached a key trendline support zone, which has held firmly in previous sessions. Technical indicators like RSI are also beginning to show signs of bullish divergence, suggesting a potential reversal. If this trendline continues to act as strong support, we may see a bullish bounce from the current level, aligning with the overall ascending trend structure but if the trade break these support zones, then the bearish movement might continues
for now we will be watching for confirmation signals such as bullish candlestick patterns or a break above near-term resistance levels to validate the upward movement.

USD/JPY 4-Hour Forex Chart (June 20, 2025)4-hour candlestick chart from FOREX.com displays the USD/JPY currency pair's performance, showing a current value of 145.328 with a slight decrease of 0.112 (-0.08%). The chart highlights a recent downward trend following a peak near 145.950, with a shaded area indicating a potential resistance zone around 145.500-145.950. The time frame spans from early June to the present date, with key levels marked at 145.000, 144.478, and higher resistance points.

USD/JPY 2-Hour Forex Chart2-hour candlestick chart from FOREX.com displays the exchange rate between the U.S. Dollar (USD) and the Japanese Yen (JPY). The current rate is 145.513, with a slight increase of +0.074 (+0.05%). The chart shows price movements over the past 2-hour period, with a notable upward trend followed by a recent decline, as highlighted by the shaded area indicating a potential resistance or reversal zone. Key levels such as 145.701 and 145.106 are marked, along with the current time of 04:00.

USD/JPY) Bearish reversal analysis Read The captionSMC trading point update
Technical analysis of USD/JPY 3-hour chart suggests a bearish reversal setup, based on smart money concepts (SMC), resistance rejection, and price action structure. Here's a full breakdown:
Technical Breakdown – USD/JPY
Big Resistance Zone (~145.800–146.300):
Price has tapped into a major resistance zone (yellow box) twice (highlighted with red arrows).
Both rejections indicate strong seller interest.
The latest candle structure shows clear rejection wick, signaling weakness at resistance.
---
Bearish Bias Confirmation:
Bearish structure forming after the second rejection.
Break of the rising trendline could accelerate selling pressure.
A measured move projection (-2.58%) aligns the downside target with the support level at ~142.144.
---
Support Zone (~141.800–142.400):
Marked as the likely target zone.
Historically acted as a strong bounce area (visible from late May to early June).
Completion of ABC bearish structure aligns here.
---
Indicators & Tools:
200 EMA (144.419): Price currently slightly above it — watching for a close below to strengthen bearish view.
RSI (14): Shows signs of bearish divergence and cooling off from overbought (was above 70 previously).
Volume spike during the rejection suggests institutional selling.
Mr SMC Trading point
---
Forecast Summary:
Bias: Bearish toward 142.144
Entry Idea: Look for confirmation of breakdown below trendline (~145.00)
Invalidation: Strong bullish close above 146.300 would break this idea.
---
Please support boost 🚀 this analysis)
