USDJPY M15 Support & Resistance Levels🚀 Here are some key zones I've identified on the 15m timeframe.
These zones are based on real-time data analysis performed by a custom software I personally developed.
The tool is designed to scan the market continuously and highlight potential areas of interest based on price action behavior and volume dynamics.
Your feedback is welcome!
Usdjpyanalysis

usdjpy 1 hour BUYPEPPERSTONE:USDJPY As we can see on 1 hour chart price came to another level. And after some consolidation price rejected from level. I'm looking for sell from this level and probably price push down.

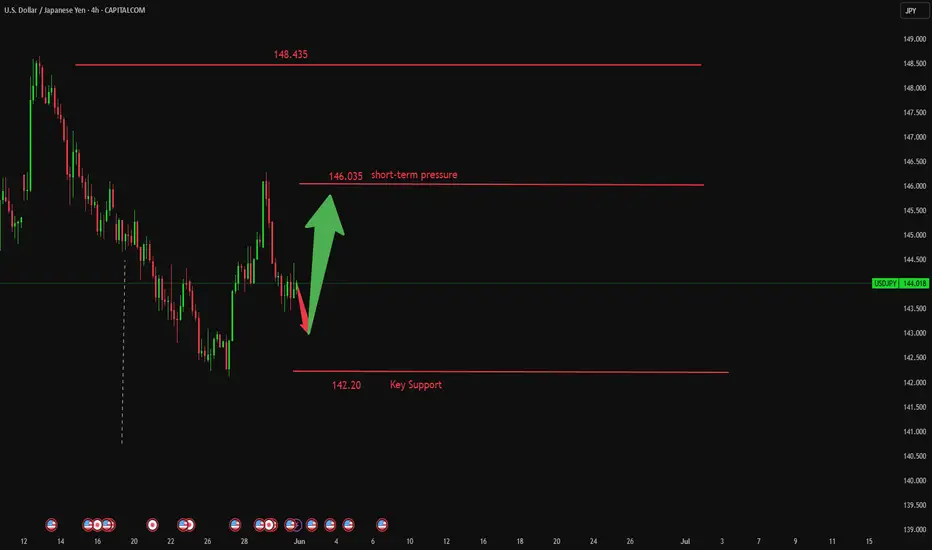
UsdJpy could break 142 and fall 500 pipsSince early May, I’ve been highlighting the 142 support zone on USDJPY as a potential reversal area — with a suggested upside target at 146.
The market respected this level twice, reversing from 142 and rallying past 146 both times.
However, last week’s move into 146 was sharply rejected, forming a strong daily Pin Bar exactly at resistance — a classic sign of exhaustion.
Now, price is rolling back toward support, and after multiple tests of the 142 zone, we may be very close to a downside break.
🧩 Add to this the fact that DXY also looks ready to break lower, and the probability of a USDJPY fall increases even more.
📉 Trading Plan:
Sell rallies, with invalidation above 146, and a target at 137, aiming for a 1:2 risk-reward setup.
Disclosure: I am part of TradeNation's Influencer program and receive a monthly fee for using their TradingView charts in my analyses and educational articles.

Prices are testing the 142.55 support level.Bank of Japan (BOJ) Governor Kazuo Ueda stated on Tuesday that the central bank would raise interest rates if the economy re-accelerates, adding that wage growth must regain momentum. Currently, Trump's tariff policies have dimmed the economic outlook, making it potentially not the optimal time for a rate hike. However, policymakers stand ready to raise rates if the economy rebounds after a brief pullback. The remarks bolstered the Japanese yen, with prices now testing the 142.55 support level. A decisive break below this level would form a lower low, confirming the continuation of the downtrend and shifting bearish targets toward the 140.01 support level.
Humans need to breathe, and perfect trading is like breathing—maintaining flexibility without needing to trade every market swing. The secret to profitable trading lies in implementing simple rules: repeating simple tasks consistently and enforcing them strictly over the long term.
Trading Strategy:
sell@144.50-145.00
TP:143.00-142.50

USD/JPY M15 Support & Resistance Levels🚀 Here are some key zones I've identified on the 15m timeframe.
These zones are based on real-time data analysis performed by a custom software I personally developed.
The tool is designed to scan the market continuously and highlight potential areas of interest based on price action behavior and volume dynamics.
Your feedback is welcome!

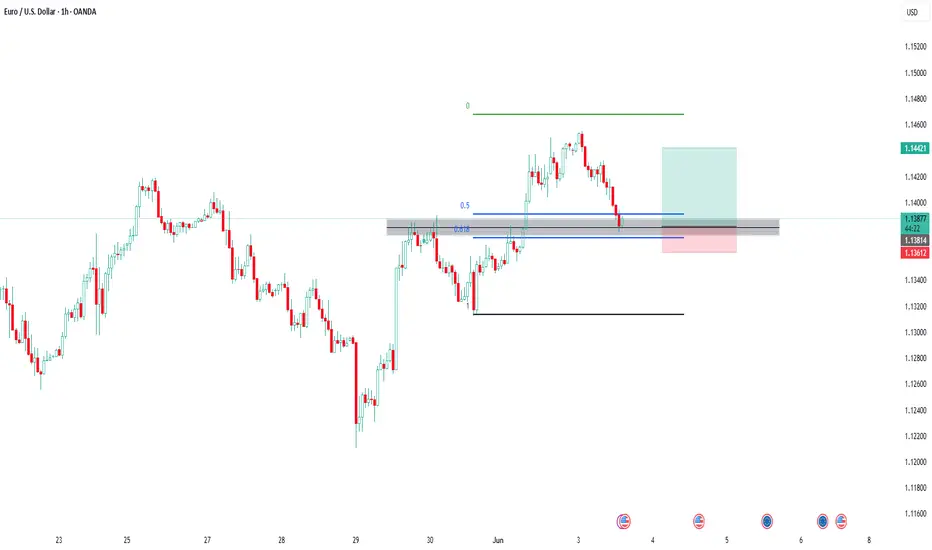
EUR USD Trade Setup 1 hour timeframe EUR USD Trade Setup 1 hour timeframe
EUR USD has formed a Bullish Break and Retest pattern on the 1 hour timeframe and the price is currently at the retest level.
USDJPY Analysis todayHello traders, this is a complete multiple timeframe analysis of this pair. We see could find significant trading opportunities as per analysis upon price action confirmation we may take this trade. Smash the like button if you find value in this analysis and drop a comment if you have any questions or let me know which pair to cover in my next analysis.

Risk, Rates, and Reversals: What’s Next for USD/JPY?CMCMARKETS:USDJPY FX:USDJPY USD/JPY rebounded slightly to 143.10 but remains under pressure after slipping from the 144.50 on BoJ-Fed divergence and rising geopolitical tensions. While the BoJ appears cautious about accelerating its balance sheet tapering beyond FY2026, it still signals further rate hikes amid persistent domestic inflation, offering the yen structural support.
Technically, price is reacting off the lower trendline TL2, aligned with the 142.30–142.40 significant support zone. This area has held multiple times in the past and may offer a bullish pullback toward the 143.80 or even 146.15 resistance zones. However, failure to break above these levels could expose USD/JPY to renewed downside toward the 140.89 demand base.
Short-term recovery depends on Friday’s NFP and risk sentiment around trade tensions. A break below 142.30 would invalidate the bullish rebound and open downside to support near 140.89.
Resistance : 143.87 , 146.14
Support : 142.36 , 140.89

Short I opened a short position yesterday at the price of 147.50.
Currently the price is 146.18. The price has dropped quite a bit but I think it still has a good short entry opportunity with a reasonable risk reward.
Reasons for short trade:
The price has reached the major support level around 149 on the 22nd April. Since then, the price has moved up to the fair value gap area between 149.2 and 148.2 (blue rectangular box), and also the order block.
That area is also the Fib 0786 area. I look at Fib 0.786 as the last line of defence and it is usually a hard line to break.
The price hit the area and started to move to the downside. Momentum indicators are still in the bull territory but the lines have crossed and clearly moving to the downside.
My macro bias for USD is bearish and the current price set up support my bias. The risk reward is good enough for me to enter.
My trade set up:
Entry: 147.51Stop: 148.95Target: 142.478 (Fib 0.236)
Risk:Reward= 1:3.5
Currently the price is 146.17. It just broked below Fib 0.618. Entry now can give you 1:1.5 risk reward.

USDJPY I Trading Plan and Forecast Welcome back! Let me know your thoughts in the comments!
** USDJPY Analysis - Listen to video!
We recommend that you keep this pair on your watchlist and enter when the entry criteria of your strategy is met.
Please support this idea with a LIKE and COMMENT if you find it useful and Click "Follow" on our profile if you'd like these trade ideas delivered straight to your email in the future.
Thanks for your continued support!Welcome back! Let me know your thoughts in the comments!

A rebound is inevitable. Execute!During the European session, the USD/JPY price trended lower overall, with prices gradually declining from higher levels, indicating that bearish forces remained dominant. The pair started its downward movement from near 144.049 and continued to move lower. Notably, the USD/JPY exchange rate faced resistance at the 146.00 psychological level and is currently moving toward the support zone at 142.35. If prices reach this area, buyers are expected to enter the market after setting clear risk parameters below the support level, preparing for a potential rebound toward the 148.00 resistance level. On the flip side, sellers will look for prices to break below this level to increase bearish bets, with a further downside target set at the 140.00 threshold.
Humans need to breathe, and perfect trading is like breathing—maintaining flexibility without needing to trade every market swing. The secret to profitable trading lies in implementing simple rules: repeating simple tasks consistently and enforcing them strictly over the long term.
Trading Strategy:
buy@142.20-142.50
TP:145.50-146.00

USD/JPY) bullish choch Analysis Read The ChaptianSMC trading point update
Technical analysis of USD/JPY presents a bullish outlook with Smart Money Concepts (SMC)-based logic. Here's a breakdown of the idea and key elements:
---
Chart Summary
Current Market Context
Price: ~144.05
EMA 200: Acting as dynamic resistance at 144.19
Trendline: Broken, signaling a potential shift in market structure
Change of Character (ChoCh): Confirmed around 143.3, marking a bullish transition
---
Key Zones Identified
1. Support Level (Strong Demand Zone)
Around 141.8–142.5
Marked by historical rejections
Possible mitigation of unfilled orders here
2. Fair Value Gap (FVG)
Between 143.0–143.8
Price may return to fill this imbalance before rising
---
Projected Move
Price is expected to:
1. Dip into the FVG or Support Zone to mitigate imbalance
2. Reverse and make a bullish rally
3. Reach the target point near 148.68 (approx. +4.55%)
---
RSI Analysis (14-period)
Current RSI: ~49 (neutral)
No overbought/oversold condition
Room for upside momentum
---
Notable Features
Break of structure (ChoCh) → Bullish signal
EMA crossover potential → Bullish confluence
Multiple FVG fills + support reaction → Entry confirmation opportunities
Economic events marked → Be cautious of volatility spikes
Mr SMC Trading point
---
Trading Idea Summary
Buy Entry Zone: 141.8–143.0 (support or FVG)
Stop Loss: Below 141.5
Target: 148.68
Risk/Reward: Favorable (approx. 1:3+)
Pales support boost 🚀 analysis follow)

USD/JPY) Bullish reversal analysis Read The ChaptianMr SMC Trading point update
Technical analysis for the USD/JPY (U.S. Dollar / Japanese Yen) on the 4-hour timeframe. Here's a detailed breakdown of the idea and strategy:
---
Key Components of the Chart:
1. Strong Support Zone:
The yellow zone is labeled as a “big support level of pullback”, around the 142.00 – 141.20 range.
Price has historically bounced from this zone, suggesting demand and buyer interest.
2. Bullish Structure Setup:
Price is forming a double bottom or potential reversal pattern in the support zone.
A downtrend line is clearly marked, and a break above this trendline would signal bullish continuation.
3. EMA 200 (at 145.020):
The EMA is currently acting as dynamic resistance.
A breakout above the EMA would confirm further bullish momentum.
4. RSI Indicator:
RSI is currently below 30, indicating the market is oversold – a common precursor to a bullish reversal.
5. Target Levels:
Target 1: 145.803 – likely the first resistance level or EMA retest.
Target 2: 148.587 – a prior high and strong resistance area.
6. Projection:
Price is expected to bounce from support, break the trendline, retest, and then rally to higher levels.
---
Trade Idea Summary:
Bias: Bullish
Entry Zone: Near 142.00 – 141.20 (support zone)
Confirmation: Break above the descending trendline + bullish RSI divergence
Targets:
TP1: 145.803
TP2: 148.587
Invalidation: Break and close below 141.00 (support zone broken)
Mr SMC Trading point
---
Risk Management Suggestion:
Use a tight stop-loss below the support zone, considering it's the key reversal area. Also, keep an eye on fundamental factors such as U.S. and Japan interest rate decisions or key economic events (indicated by the icons on the chart).
Pales support boost 🚀 analysis follow)

Is a new round of decline impending?
The latest prices of USD/JPY are fluctuating around the range of 1.43922 to 1.44275, with an average price of 1.43917. The earlier pullback from higher levels indicates some downward pressure. On the upside, the pair may encounter resistance near the 144.20 level, with the next key resistance at around 144.50 and the first major resistance at 145.00. A close above the 145.00 level could lay the foundation for further gains.
Under the above scenario, the pair may even break through the 146.00 resistance level, with the next major target for bulls near the 147.80 resistance level.
Humans need to breathe, and perfect trading is like breathing—maintaining flexibility without needing to trade every market swing. The secret to profitable trading lies in implementing simple rules: repeating simple tasks consistently and enforcing them strictly over the long term.
USDJPY starting bullish move?Hello traders, this is a complete multiple timeframe analysis of this pair. We see could find significant trading opportunities as per analysis upon price action confirmation we may take this trade. Smash the like button if you find value in this analysis and drop a comment if you have any questions or let me know which pair to cover in my next analysis.

Was This Week's Move in USD/JPY Just a Correction?This week’s bounce in USD/JPY may have caught some traders off guard—but when viewed through the lens of the Elliott Wave Principle, the price action appears to be corrective rather than impulsive.
🧩 The Evidence: A 3-Wave Move
According to the wave structure:
The recent move up unfolded in 3 waves, labeled as an ABC correction.
Wave C terminated near the 100% Fibonacci extension of Wave A (~146.189), which is a classic ZigZag ratio.
Additionally, there was a clear MACD divergence between price and momentum as Wave C completed—a common sign that the move is running out of steam and that the wave is likely terminal.
These clues all point to the idea that the rally was corrective, not the start of a new impulsive trend.
📉 What Comes Next?
If this count is correct:
USD/JPY may have completed Wave (ii) of a new downward impulse.
The next move could be the start of Wave (iii)—typically the most aggressive and directional wave in a 5-wave decline.
✅ Trigger Level: A break below the B wave low would act as a technical confirmation of the downtrend resuming.
This would be a green light to look for short setups, depending on the strategy each trader follows—whether that’s pattern-based, indicator-confirmed, or structure-driven.
🔁 Alternate Scenario:
If this isn't the start of Wave (iii), the alternate count would suggest a more complex corrective combination (such as a double three).
However, even in that scenario, the short-term direction is still likely downward.
🧠 For Beginners:
Elliott Wave theory breaks price into 5-wave trends and 3-wave corrections.
A ZigZag correction (ABC) is made up of a sharp Wave A, a pullback in Wave B, and a final move up in Wave C.
Wave C often shows momentum divergence (MACD diverging from price), signaling that the move may be exhausting.
When C = A, especially with divergence, it’s often a sign the correction is ending.
📌 Summary:
USD/JPY’s rally appears to be a corrective ABC structure.
Wave C rejected at the 100% extension of A, with MACD divergence confirming weakening momentum.
A break of the B wave low could confirm that Wave (iii) down is underway.
Even in the alternate count, near-term downside is still favored.
💬 Got a Favorite Chart You’d Like Analyzed?
If there’s a forex pair, crypto, or stock you’d like me to break down using Elliott Waves,
leave a comment below and I’ll feature it in an upcoming post from Real Wave Trader.

USD/JPY 1H Analysis – Channel Breakout and Buy SignalOverview:**
The USD/JPY chart shows a **bullish breakout from a descending channel**, supported by technical indicators like the Ichimoku Cloud and a strong demand zone. This setup suggests a potential bullish reversal and upward momentum.
*Key Technical Points:**
* **Descending Channel Breakout:**
Price action has broken out of a falling channel, indicating a shift in market sentiment from bearish to bullish.
* **Strong Support Zone:**
Around 143.28 – 143.73, the price found significant support, which aligns with a previous demand zone. This area held firm, helping trigger the breakout.
* **Ichimoku Cloud:**
Price is emerging above the Ichimoku Cloud, signaling a potential start of an uptrend. If the price maintains above the cloud, bullish momentum may strengthen.
* **Resistance Levels:**
* **First Resistance:** Near 146.00 – a critical area to watch for short-term profit-taking.
* **Second Resistance:** Around 148.00 – a more extended target if bullish continuation holds.
---
### **Trading Idea:**
**BUY USD/JPY** on successful retest of the breakout or sustained move above the Ichimoku Cloud.
* **Entry:** 144.30–144.40 zone
* **Target 1:** 146.00
* **Target 2:** 148.00
* **Stop Loss:** Below 143.20 (under the support zone)
---
Conclusion:**
The chart presents a classic **bullish channel breakout** supported by the Ichimoku indicator and price action at a strong support zone. As long as the price holds above the breakout level and Ichimoku Cloud, the upside targets at 146 and 148 remain valid.
Let me know if you want this formatted as a trade plan or journal entry.
To ensure you do not miss the upcoming analysis, be sure to follow me!
Please leave a remark and a like!

USDJPY Returns to Key Support – Another Bounce Ahead?At the end of April and beginning of May, I pointed out the importance of the 142 support zone and argued that USDJPY could reverse to the upside, targeting the 146 resistance.
The pair did exactly that — not only hitting the 146 target, but also spiking as high as 148, reaching the next major resistance.
🔁 Now We're Back towards 142
Since mid-May, USDJPY has pulled back again and is now retesting the 142 area — the same zone that previously triggered a strong bounce.
📌 Outlook and Trading Plan
I still consider the 142 level a solid support, and this recent drop could offer a new buying opportunity.
Any dips under 142 that quickly reverse can be used to build long positions, with a target once more around 146.
That offers a clear trade setup with a good risk-to-reward ratio.
Disclosure: I am part of Trade Nation's Influencer program and receive a monthly fee for using their TradingView charts in my analyses and educational articles.

Bullish Reversal on Risk-On Shift and Channel BreakoutCMCMARKETS:USDJPY USD/JPY surged as risk appetite returned after a U.S. federal court blocked President Trump's "Liberation Day" tariffs, undermining demand for safe-haven assets like the yen. Meanwhile, weak demand in Japan’s 40-year bond auction raised concerns over fiscal stability, adding further downside pressure to JPY. Technically, the pair broke above a downward channel and formed a bullish engulfing pattern near the 144.90 demand zone. If price consolidates above 145.00, a test of the 148.15 resistance zone is possible. Traders now eye upcoming U.S. GDP and PCE inflation data for direction on Fed policy.
Resistance : 148.14 , 148.67
Support : 144.90 , 144.42

USDJPY: Neutral View! One of The Hardest Forex Pair To TradeUSDJPY has not yet shown a clear move, ranging between 141 and 144. We are currently neutral as the price could go in either direction. Trade cautiously and manage risk according to your trade plan.
Thanks for your support! 😊
If you’d like to help us out, here are a few things you can do:
- Like our ideas
- Comment on our ideas
- Share our ideas
Team Setupsfx_
❤️

USDJPY: 300+ Pips From Previous Idea, What Hold Next? Hey Everyone
USDJPY is on a roll! It’s rebounded a whopping 300+ pips and is now on the positive side. We reckon it’s going to keep climbing in the coming days as DXY is starting to regain its strength.
And here’s the cherry on top: there’s some exciting news coming up, including the NFP tomorrow. This could really boost the USDJPY to a new record high.
But remember, when trading, it’s crucial to manage your risk carefully.
Now, let’s talk about the potential for a significant market movement. We’ve spotted a chance for a substantial bullish swing that could reach around 2050 pips. We’ve also identified three potential targets, so you can choose the one that best fits your analysis.
The main driver behind this move is the reversal of the Japanese Yen (JPY) from a bullish trend to a bearish one. So, let’s be cautious and use precise risk management techniques during this period.
Good luck and happy trading! 😊
Oh, and if you’d like to help us out, here are a few things you can do:
- Like our ideas
- Comment on our ideas
- Share our ideas
Thanks a bunch for your support! 😊
Cheers,
The Setupsfx_ Team

Analysing the Volatility Spike on the USD/JPY ChartAnalysing the Volatility Spike on the USD/JPY Chart
The USD/JPY chart offers plenty of noteworthy insights for analysis:
→ A one-month low was recorded today (marked by the arrow);
→ This was followed by a sharp upward reversal, with a series of large bullish candlesticks forming on the intraday chart.
Why Is USD/JPY Moving Sharply Today?
The primary driver appears to be recent statements from Bank of Japan Governor Kazuo Ueda.
According to Trading Economics, this morning Ueda:
→ warned of rising core inflation risks linked to increasing food prices;
→ indicated that the Bank of Japan is prepared to adjust its monetary policy in order to achieve a stable inflation target.
Latest data show that Japan’s core inflation unexpectedly rose to 3.5% — the highest level in two years — reinforcing the case for further rate hikes. However, what's particularly striking is that despite Ueda’s hawkish tone, the yen is weakening.
Technical Analysis of the USD/JPY Chart
Yen fluctuations formed a downward trajectory (marked in orange) in the second half of May, partly driven by US dollar weakness. Following a period of relative calm, the market has shifted into high gear — the ATR indicator is climbing sharply from multi-month lows, breaking through resistance at the 143.0 level.
This aggressive price action on the USD/JPY chart today suggests we may be witnessing an attempted bullish breakout from the channel. In light of this, it is possible that the surge in volatility reflects a fundamental shift in market sentiment — one that could potentially lead to the development of an upward trend.
This article represents the opinion of the Companies operating under the FXOpen brand only. It is not to be construed as an offer, solicitation, or recommendation with respect to products and services provided by the Companies operating under the FXOpen brand, nor is it to be considered financial advice.

USDJPY Analysis – Yield Support Signals Potential UpsideUSDJPY is currently sitting at a key support zone around 142.80–143.00, showing signs of a potential bullish reversal. This support area has previously acted as a strong launchpad for price rallies.
🟢 Technical Setup:
Price action has formed a clean higher low structure, bouncing off horizontal support.
The US10Y Treasury Yield (pink line) has rebounded sharply and is diverging to the upside — a leading indicator for USDJPY strength.
The Fib retracement from the last swing move aligns well with the 0% zone, suggesting the dip might be complete.
A bullish reaction from here targets the 148.50 zone, with intermediate resistance around 145.00–146.00.
🟠 Risk Levels:
Invalidated below 141.40 (structure break).
Stops could be placed below 142.00, targeting a 2:1 or better risk-reward ratio.
🔍 Macro-Fundamental Insight:
U.S. Yields are firming despite mixed Fed signals — this gives strength to USD, especially against low-yielders like the JPY.
BOJ remains dovish with no urgency to normalize rates, keeping the yen weak.
With risk appetite improving and bond yields lifting, carry trade dynamics favor USDJPY upside.
✅ Conclusion:
As long as US10Y yields remain firm and USD holds above 142.00, USDJPY has a strong probability of rallying toward 148.50. Look for confirmation with higher highs on the 4H chart and continued divergence between yield and price.
