USDJPY Bearish Continuation Setup Trend Analysis
The market is in a clear downtrend, evidenced by the sequence of lower highs and lower lows.
The descending trendline has been respected multiple times, acting as dynamic resistance.
🧠 Key Technical Factors
Rejection Zone (Supply Area):
The marked “Rejection Point” aligns with the confluence of the trendline resistance, 50 EMA (red), and historical supply.
Price attempted to break above but faced a strong rejection—signaling institutional sell interest.
EMA Confluence:
50 EMA (142.993) and 200 EMA (144.063) are both sloping downward.
Price is trading below both EMAs, confirming bearish momentum and trend continuation bias.
BOS (Break of Structure):
Multiple BOS levels marked, showing a consistent pattern of structure breaks to the downside.
Each rally is met with selling pressure, failing to create new highs.
🧩 Projected Price Action
Current retracement could retest the trendline/50 EMA before a potential continuation move downward.
Expectation is a lower high formation near the descending trendline followed by a bearish impulse.
🏹 Bias: Bearish
Traders might consider short opportunities around the 142.90–143.00 zone, targeting 142.00 and below, with stops just above the trendline/supply zone.
⚠️ Risk Note
A clean break and close above the trendline and 50 EMA would invalidate this setup and could lead to a shift in structure.
Usdjpyanalysis

USD/JPY "The Gopher" Forex Bank Bullish Heist Plan (Swing Trade)🌟Hi! Hola! Ola! Bonjour! Hallo! Marhaba!🌟
Dear Money Makers & Robbers, 🤑 💰💸✈️
Based on 🔥Thief Trading style technical and fundamental analysis🔥, here is our master plan to heist the USD/JPY "The Gopher" Forex Market. Please adhere to the strategy I've outlined in the chart, which emphasizes long entry. Our aim is to escape near the high-risk Yellow MA Zone. Risky level, overbought market, consolidation, trend reversal, trap at the level where traders and bearish robbers are stronger. 🏆💸"Take profit and treat yourself, traders. You deserve it!💪🏆🎉
Entry 📈 : The vault is wide open! Swipe the Bullish loot at any price - the heist is on!
Place buy limit orders most recent or swing, low level for Pullback entries.
Stop Loss 🛑:
📍 Thief SL placed at the recent/swing low level Using the 4H timeframe (138.500) Day/Swing trade basis.
📍 SL is based on your risk of the trade, lot size and how many multiple orders you have to take.
🏴☠️Target 🎯: 147.500 (or) Escape Before the Target
🧲Scalpers, take note 👀 : only scalp on the Long side. If you have a lot of money, you can go straight away; if not, you can join swing traders and carry out the robbery plan. Use trailing SL to safeguard your money 💰.
💰💵💸USD/JPY "The Ninja" Forex Money Heist Plan is currently experiencing a bullishness,., driven by several key factors. .☝☝☝
📰🗞️Get & Read the Fundamental, Macro, COT Report, Quantitative Analysis, Sentimental Outlook, Intermarket Analysis, Future trend targets & Overall Score... go ahead to check 👉👉👉🔗🔗🌎🌏🗺
⚠️Trading Alert : News Releases and Position Management 📰 🗞️ 🚫🚏
As a reminder, news releases can have a significant impact on market prices and volatility. To minimize potential losses and protect your running positions,
we recommend the following:
Avoid taking new trades during news releases
Use trailing stop-loss orders to protect your running positions and lock in profits
💖Supporting our robbery plan 💥Hit the Boost Button💥 will enable us to effortlessly make and steal money 💰💵. Boost the strength of our robbery team. Every day in this market make money with ease by using the Thief Trading Style.🏆💪🤝❤️🎉🚀
I'll see you soon with another heist plan, so stay tuned 🤑🐱👤🤗🤩

USD/JPY "The Ninja" Forex Bank Money Heist (Bullish)🌟Hi! Hola! Ola! Bonjour! Hallo! Marhaba!🌟
Dear Money Makers & Robbers, 🤑 💰💸✈️
Based on 🔥Thief Trading style technical and fundamental analysis🔥, here is our master plan to heist the USD/JPY "The Ninja" Forex Market Heist. Please adhere to the strategy I've outlined in the chart, which emphasizes long entry. Our aim is to escape near the high-risk YELLOW MA Zone. It's a Risky level, overbought market, consolidation, trend reversal, trap at the level where traders and bearish robbers are stronger. 🏆💸"Take profit and treat yourself, traders. You deserve it!💪🏆🎉
Entry 📈 : "The vault is wide open! Swipe the Bullish loot at any price - the heist is on!
however I advise to Place buy limit orders within a 15 or 30 minute timeframe most recent or swing, low or high level. I Highly recommended you to put alert in your chart.
Stop Loss 🛑:
Thief SL placed at the Nearest / Swing low level Using the 1H timeframe (143.000) Day trade basis.
SL is based on your risk of the trade, lot size and how many multiple orders you have to take.
🏴☠️Target 🎯: 147.000
💰💵💸USD/JPY "The Ninja" Forex Money Heist Plan is currently experiencing a bullishness,., driven by several key factors. .☝☝☝
📰🗞️Get & Read the Fundamental, Macro, COT Report, Quantitative Analysis, Sentimental Outlook, Intermarket Analysis, Future trend targets.... go ahead to check 👉👉👉🔗🔗🌎🌏🗺
⚠️Trading Alert : News Releases and Position Management 📰🗞️🚫🚏
As a reminder, news releases can have a significant impact on market prices and volatility. To minimize potential losses and protect your running positions,
we recommend the following:
Avoid taking new trades during news releases
Use trailing stop-loss orders to protect your running positions and lock in profits
💖Supporting our robbery plan 💥Hit the Boost Button💥 will enable us to effortlessly make and steal money 💰💵. Boost the strength of our robbery team. Every day in this market make money with ease by using the Thief Trading Style.🏆💪🤝❤️🎉🚀
I'll see you soon with another heist plan, so stay tuned 🤑🐱👤🤗🤩

USDJPY Analysis todayHello traders, this is a complete multiple timeframe analysis of this pair. We see could find significant trading opportunities as per analysis upon price action confirmation we may take this trade. Smash the like button if you find value in this analysis and drop a comment if you have any questions or let me know which pair to cover in my next analysis.

USD/JPY Analysis: Bearish Bias with Multi-Market Confluence!📉 USDJPY Technical Breakdown – Yen Strength in Focus 📉
In this video, we take a close look at the USD/JPY, which is currently under pressure and trending to the downside 🔽. The bearish momentum is clear, but there are several key factors to consider before positioning ourselves for a potential short 📊.
🔍 First, it’s important to monitor the equity markets. If we start to see a pullback or sell-off in the stock indices 🏦📉, that could translate into further yen strength, adding weight to a USD/JPY short bias 💴💪.
Another key piece of confluence is comparing the DXY (Dollar Index) 📈 with the JXY (Japanese Yen Index) 📉. This gives us deeper insight into the relative strength of each currency and helps confirm our directional bias before entering a trade ⚖️.
🔁 Coming back to the USD/JPY chart, we’re watching for a retracement into a Fibonacci point of interest, which could provide a high-probability area to enter a sell setup. If price reacts from that level and confirms with structure, we could have a clean opportunity for continuation 🔂🎯.
⚠️ This is not financial advice — always conduct your own analysis and manage risk accordingly.

(BTC/USD) Short Trade Setup – Bearish Reversal from Resistance 1. Entry Point: 111,516.84
2. Stop Loss: 112,858.08
3. EA Target Point (Take Profit): 106,068.04
4. Resistance Point: ~110,563 (currently being tested)
Trade Setup Summary:
Type: Short position
Risk (Stop LOss - Entry): 112,858.08 - 111,516.84 = 1,341.24
Reward (Entry - Target): 111,516.84 - 106,068.04 = 5,448.80
Risk/Reward Ratio: Roughly 1:4, which is favorable.
Technical Indicators:
The chart shows:
Moving Averages: A red (shorter) and blue (longer) MA, suggesting recent bullish momentum.
Price Action: Consolidation near the resistance after an uptrend; current candle appears bearish and breaking the support.
Interpretation:
This is a bearish reversal setup.
If the price breaks the support around 110,563 convincingly, it may confirm a move downward.
The stop loss is placed safely above recent highs to avoid getting caught in short-term volatility.
The target is significantly lower, around previous support levels, implying a strong move down is anticipated.
Risk:
This strategy banks on a clear breakdown. If the support holds, price may reverse upward, hitting the stop loss.

Analysis of USD/JPYDuring the European session, USD/JPY recovered its early losses and traded flat near 143.50. After three consecutive days of declines, the US dollar attracted buying interest on Thursday, pushing the pair higher. Against the backdrop of rising safe-haven demand for the Japanese yen and a generally weak US dollar, USD/JPY had fallen to a two-week low. The yen also benefited from upbeat machinery order data, which overshadowed recession concerns and boosted hopes for an economic recovery. This provided support for the Bank of Japan (BOJ) to further raise interest rates. Combined with sustained safe-haven buying, this has kept the yen strong.
In the market, there are no absolutes, and neither upward nor downward trends are set in stone. Therefore, the ability to judge the balance between market gains and losses is your key to success. Let money become our loyal servant.

USDJPY Bearish in the short term.The USD/JPY exchange rate extended its recent downward trend during the European session, falling for the third consecutive trading day and marking the sixth decline in the past seven trading days. It hit a two-week low in the 143.45 area during the European morning session. Multiple factors have jointly driven the exchange rate lower, indicating that the sharp pullback from the monthly high of 148.65 reached last Monday may continue to extend. The Japanese yen is supported by market expectations that the Bank of Japan (BOJ) will raise interest rates again and has gained additional momentum from the rebound in risk-aversion demand. In the short term, USD/JPY maintains a downward trend, with technical indicators showing that bears are in control. 142.210 will be a key support level; a break below this level could accelerate the decline toward the 139.887 area.
In the market, there are no absolutes, and neither upward nor downward trends are set in stone. Therefore, the ability to judge the balance between market gains and losses is your key to success. Let money become our loyal servant.

USD/JPY Dips FurtherUSD/JPY Dips Further
USD/JPY declined below 144.50 and is currently consolidating losses.
Important Takeaways for USD/JPY Analysis Today
- USD/JPY is trading in a bearish zone below the 146.10 and 144.90 levels.
- There is a short-term bearish trend line forming with resistance at 144.25 on the hourly chart at FXOpen.
USD/JPY Technical Analysis
On the hourly chart of USD/JPY at FXOpen, the pair started a steady decline from well above the 146.00 zone. The US Dollar gained bearish momentum below the 145.00 support against the Japanese Yen.
The pair even settled below the 144.50 level and the 50-hour simple moving average. There was a spike below 144.00 and the pair traded as low as 143.72. It is now consolidating losses with a bearish angle. Immediate resistance on the USD/JPY chart is near the 23.6% Fib retracement level of the recent decline from the 146.10 swing high to the 143.42 low at 144.25.
There is also a short-term bearish trend line forming with resistance at 144.25. The first major resistance is near the 144.90 zone and the 50% Fib retracement level of the recent decline from the 146.10 swing high to the 143.42 low.
If there is a close above the 144.90 level and the hourly RSI moves above 50, the pair could rise toward 145.50. The next major resistance is near 146.10, above which the pair could test 147.50 in the coming days.
On the downside, the first major support is near 143.70. The next major support is near the 143.20 level. If there is a close below 143.20, the pair could decline steadily. In the stated case, the pair might drop toward the 142.00 support.
This article represents the opinion of the Companies operating under the FXOpen brand only. It is not to be construed as an offer, solicitation, or recommendation with respect to products and services provided by the Companies operating under the FXOpen brand, nor is it to be considered financial advice.

There is too much uncertainty.The USD/JPY exchange rate lingered near 144.50 during the European session, remaining under pressure. Although the U.S. Dollar Index (DXY) found temporary support near 100.10, its overall trend remains uncertain following Moody’s downgrade of the U.S. sovereign credit rating. Market sentiment is currently tilted toward cautious bearishness, with traders concerned about U.S. debt issues and uncertainties in trade policies—sentiments reflected in the dollar’s weakness. Meanwhile, the progress of U.S.-Japan trade negotiations has added to market uncertainty.
Technical Outlook:
Short-Term: If the pair stabilizes above the 143.74 support level and rebounds above 145, it may challenge the 146.19 resistance level in the near term. A decisive breakout above 146.19 could trigger a new upward trend, targeting 147.95 and 148.64.
Long-Term: A genuine confirmation of a bullish regime would require breaking above the 150 psychological level, which hinges on fundamental catalysts such as the Federal Reserve delaying rate cuts or the Bank of Japan shifting to a more accommodative stance.
Key Drivers to Monitor:
U.S. Treasury yield dynamics and Fed policy expectations.
Developments in U.S.-Japan trade talks and risk sentiment shifts.
Volatility in global equity markets and safe-haven flows.
Market participants are advised to exercise caution amid heightened uncertainty, with tight stop-losses recommended for directional trades.
In the market, there are no absolutes, and neither upward nor downward trends are set in stone. Therefore, the ability to judge the balance between market gains and losses is your key to success. Let money become our loyal servant.

USDJPY Outlook: Weekly Bearish Bias Despite Temporary RebalanceGreetings Traders,
It's the start of a new trading week, and our focus is on the Gopher — CAPITALCOM:USDJPY .
Weekly Overview: Temporary Rebalance, Bearish Tone Intact
On the weekly chart, USDJPY pushed higher to rebalance a Fair Value Gap (FVG) between 149.30 and 148.26. Following this, price was swiftly rejected, forming a shooting star candlestick — a classic sign of potential bearish continuation.
However, for this bearish outlook to remain valid, 146.250 must hold as resistance. A sustained break above this level could invalidate the current bias and signal the possibility of further upside.
Daily Chart: Downside Pressure Builds
Looking at the daily timeframe, we see a sequence of down-close candles, indicating consistent selling pressure. I expect price to continue pushing lower, targeting the FVG below, with a potential sweep of sell-side liquidity resting under recent lows.
Trading Plan: Bearish Setup
Unless disrupted by high-impact fundamentals, I’ll be favouring short positions this week. My planned setup is as follows:
Entry: On confirmation within the 145.63 zone
Stop Loss: Above 145.97
Target Zones: Around 144.430
I’ll monitor price reaction closely at key levels to manage the trade accordingly.

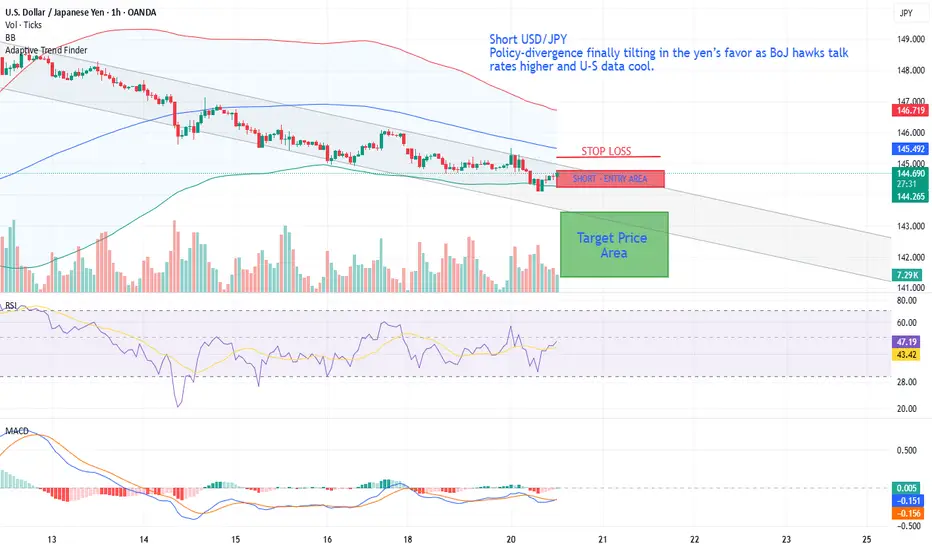
Short USD/JPYShort USD/JPY – policy-divergence finally tilting in the yen’s favor as BoJ hawks talk rates higher and U-S data cool.
• BoJ hawks signaling further 2025 hikes while Fed easing bets build → policy-divergence flips JPY-positive.
• Break & close below 38.2 % retracement and 200-SMA (H4) turns momentum south; hourly / daily RSI roll-over.
• Geopolitics easing removes safe-haven bid for USD, but not for JPY (BoJ still seen hiking).
• Bearish trigger deepens if 144.30 confluence (200-SMA H4 + 50 % Fib) gives way → air-pocket into 141s.
USDJPY:Is it a beginning of major bullish trend? Read CaptionThe price of USDJPY has shown a mixed volume, making it difficult to determine the trend. However, if we analyse the data, we can see that USD is gaining strength in the coming time. This could be due to the strong news coming in this week, which may divert the USDJPY towards the 150 price region. There are four potential targets that price could hit and surpass. Please use this analysis solely for educational purposes, as it does not provide any guarantees.
Good luck and trade safely.
Thanks for your support! 😊
If you’d like to help us out, here are a few things you can do:
- Like our ideas
- Comment on our ideas
- Share our ideas
Team Setupsfx_
❤️

USD/ JPY) bullish trend analysis Read The ChaptianSMC trading point update
Technical analysis of 4-hour for USD/JPY (U.S. Dollar vs Japanese Yen). Here's the breakdown of the idea
---
1. Bullish Structure
The market is moving within a rising channel, indicating a bullish trend.
Higher highs and higher lows support the uptrend.
---
2. Key Zones
Support Zone (Demand Area): Around the 144.500–145.000 level, price has reacted positively here multiple times — it's marked as a strong support level.
Resistance Zone: Around 148.000 — this level is marked as an obstacle before reaching the final target point.
---
3. Indicators & Confluence
EMA 200: Price is currently testing just above/below the EMA 200 — a key dynamic support/resistance level.
RSI: Showing a bullish divergence or a potential recovery from oversold zone (both RSI lines are turning upward).
MACD-style Oscillator (Custom): Showing signs of a bullish crossover, confirming upward momentum.
---
4. Projection & Target
The expected move is a bounce from support, followed by:
A retest of resistance around 148.
A continuation to the target zone at 150.864 — marked as the final target point.
The potential move is approximately +592 pips (4.19%).
Mr SMC Trading point
---
Conclusion
This is a bullish continuation setup, expecting price to maintain above the support zone and ride the trendline and channel toward 150.864. The confluence of RSI, structure, and EMA adds strength to the idea.
Pales support boost 🚀 analysis follow)

USD/JPY Breakdown: Sell the Rallies, Ride the TrendUSD/JPY has decisively shifted bearish across all key timeframes. On the daily chart, the pair broke below the 50-, 100-, and 200-day EMAs with consistent lower highs and lows. The hourly chart confirms this trend, with bearish EMA stacking and failed attempts to reclaim the 200-hour EMA. RSI remains under 50 across timeframes, signaling persistent bearish momentum without exhaustion.
The 15-minute chart highlights ideal short-entry setups on pullbacks to the 20- or 50-EMA, especially when RSI fails to breach 50. The 200-EMA on this timeframe acts as dynamic resistance near 145.30. Short entries are favorable on rallies to the 145.10–145.35 zone, with downside targets at 144.80, 144.50, and potentially 144.20.
For the week ahead, the strategy is clear: fade rallies into EMA resistance and use RSI confirmation for timing. Avoid chasing lows—wait for price to come to you. Tight stops just above the EMAs minimize risk, and partial profit-taking at swing lows allows for trend-riding flexibility.
As long as USD/JPY remains below the 200-hour EMA, bearish momentum dominates. Trade with the trend, manage risk with precision, and stay alert for breakdowns below key support levels.

USD/JPY) support level back up Read The ChaptianSMC Trading point update
Technical analysis of USD/JPY on the 4-hour timeframe suggests a bullish setup with the following key insights:
Analysis Overview:
1. Current Price: 147.492
2. Support Zone: Around 145.263 to 146.000
Marked as "Support Level / FVG" (Fair Value Gap), this is the potential demand zone where the price may retrace before bouncing.
3. Trendline: An ascending trendline is supporting the bullish structure.
4. EMA 200: Price is trading above the 200 EMA (145.263), which is generally a bullish signal.
5. RSI Indicator:
RSI is near overbought levels (currently at 63.46 and 70.56), suggesting strong bullish momentum but a potential pullback.
6. Target Zone: 151.360
Highlighted as the "Target Point" – this is the resistance area where price might face selling pressure.
Mr SMC Trading point
Trade Idea:
Entry: Buy on retracement into the support zone (around 145.5–146.0).
Stop Loss: Below the support zone or EMA (around 144.800 or as per risk tolerance).
Take Profit: Near the target zone around 151.360.
Risk-to-Reward: Favorable, approximately 1:2.5 to 1:3 depending on the entry.
Conclusion:
The idea is based on price respecting support, fair value gap (FVG), bullish structure, and a target based on recent price projections. If the price respects the support and bullish trendline, the bullish continuation towards 151.360 is a valid expectation.
Pales support boost 🚀 analysis follow)

USD/JPY Poised for Breakout: Watch the 145.60 TriggerUSD/JPY remains in a broader uptrend, with buyers defending the 141.00–144.50 support zone on the daily chart. While price has recently pulled back from the 148.50 high, the overall structure remains bullish. On the hourly timeframe, the pair has been moving within a descending channel since May 13. However, a double bottom near 141.80 and a push back toward 145.50 suggest buyers are regaining control. A breakout above the channel resistance at 145.60 could signal the end of the correction and a new leg higher toward 147.00–148.00.
The 15-minute chart supports this setup, showing a bull-flag consolidation above 145.20 and rising trendline support near 145.10. Volume has thinned during the flag formation, indicating a potential surge on breakout. Traders should look to buy above 145.60, targeting 146.20 and 146.80, with stops just below 145.00. A break under 145.00 flips the short-term bias bearish, with downside targets at 144.60 and 144.20.
Overall, the technicals favor a bullish breakout scenario into the week, provided 145.00 holds. Intraday traders should closely monitor the 145.00–145.60 zone for momentum confirmation.

USDJPY and GBPJPY Analysis todayHello traders, this is a complete multiple timeframe analysis of this pair. We see could find significant trading opportunities as per analysis upon price action confirmation we may take this trade. Smash the like button if you find value in this analysis and drop a comment if you have any questions or let me know which pair to cover in my next analysis.

Bearish USD/JPY — Yen Strength FavoredCMCMARKETS:USDJPY Bearish Factors (USD Negative / JPY Positive):
Hawkish BoJ Expectations:
Despite Japan’s weaker Q1 GDP, BoJ officials—particularly Deputy Governor Uchida—have signalled openness to resuming rate hikes in 2025. A Reuters survey suggests a potential 25bps hike before year-end. This divergence from the Fed’s stance supports JPY strength.
Dovish Fed Outlook Intensifies:
Weak U.S. April PPI and retail sales figures reinforce expectations for multiple rate cuts this year. Falling Treasury yields and soft inflation readings weigh heavily on the dollar.
Resistance : 146.75 , 145.87
Support : 144.91 , 143.52

USDJPY: FVG Then Bullish Overflow?It has been a significant week for USD/JPY. Following a break of structure (BOS) on the 4-hour timeframe, price moved away from equilibrium, leaving behind a Fair Value Gap (FVG). As the new week begins, we may observe a false move designed to induce traders into premature short positions before a potential bullish reversal—or vice versa. Additionally, given the recent BOS, price may temporarily stall to facilitate order accumulation. Next week will be pivotal in determining the pair’s next direction.
Watch out for the key levels

USOIL Temporary Drop seems inevitableYesterday's analysis perfectly predicted today's market movement. The USD/JPY rebounded from the low of 140.00, recovered from the downtrend channel, and then encountered resistance and pulled back at 148.65. Sellers are currently testing the support level of 146. If this level is broken, it may decline further to the round - number levels of 145.00 and 143.50. If 146 holds, buyers will attempt to break through the resistance level of 148.65 and further aim for the 200 - day moving average at 149.60.
Today, the released U.S. retail sales and PPI inflation data will provide clues about the consumer situation and the wholesale inflation landscape. The market expects that after a 1.5% increase in March, U.S. retail sales will be flat at 0% in April. Meanwhile, the PPI is projected to rise 0.2% after a 0.4% decline in March. The USD/JPY rebounded from the low of 140.00, recovered from the downtrend channel, and then encountered resistance and pulled back at 148.65. Sellers are currently testing the support level of 146. If this level is broken, it may decline further to the round - number levels of 145.00 and 143.50.
Federal Reserve Chair Powell will also give a speech, likely reiterating the Fed's stance that it will not be hasty to cut interest rates again until the impact of Trump's tariffs on the economy becomes clearer.
you are currently struggling with losses, or are unsure which of the numerous trading strategies to follow, at this moment, you can choose to observe the operations within our channel.

USD/JPY Multi-Timeframe Trading Plan – Week AheadUSD/JPY is trending higher short-term but remains below key resistance on the daily chart. The daily timeframe shows an inverted head-and-shoulders forming, with a neckline at 152. Until that breaks, rallies into 148–150 are likely to fade. The 1-hour chart shows a rising wedge from 142 to 148.5 with support around 145.0. Momentum is slowing, warning of potential exhaustion near 148.
On the 15-minute chart, recent price action shows a bull flag and a double bottom, offering buy zones at 146.10–146.30. The plan for early week is to long dips to this zone, targeting 146.80–147.20 with stops below 145.90. Watch for fades around 147.50–148.00 mid-week. A break above 148.00 opens room to 150.00; below 145.00, momentum shifts bearish.
Strategy: Buy pullbacks early in the week; fade rallies near 148 mid-week. Flip long above 148.00 or short below 145.00. Use tight stops and manage risk per trade.

USDJPY SHORT📉 TRADE IDEA – SHORT USD/JPY
🗓️ May 14, 2025
🔻 Position: Short
📍 Entry: 148.164
🎯 Target: 145.414
🛑 Stop Loss: [Set based on your risk — e.g., 148.189
Reasoning:
Rejection from resistance zone above 148
Bearish structure forming on the 4H and daily charts
Possible shift in sentiment around JPY with BoJ pressure mounting
USD weakening as Fed rate expectations tilt dovish
📉 Targeting a drop toward key support at 145.414 — a clean level on the daily chart.
This is a short- to medium-term swing trade based on technicals + macro shifts.
Risk managed, watching upcoming Fed & BoJ commentary closely.
📊 Let the trade play out.
