Usdjpybullish

USDJPY BuyJapanese Yen is still weak and I don't believe that in coming days it will show strength till US will not start to decrease its interest rate. Every dip in USDJPY is an opportunity to buy it.

USDJPY is ready to flyLast week JAPANE has not increased its interest rate and by this JPY come again in weakness after some strength but from last Thursday USD took strength against the JPY. Better to watch buying opportunity on it.

The usdjpy week's rally is expected to startHello guys
The @USDJPY will be expected to rise this week, the first target we can make it simple 152, you can set your goals as follows:
@USDJPY
TP ✅ : 152
TP 2 ✅ : 154
TP 2 ✅ : up up up ....
If there is negative news on the dollar, it can fall back and return to a rise... That's why let the stop loss be flexible, and I am confident in my analyzes that it is bullish
GOOD LUCK

USDJPY BuyOn Friday night USD fell badly just due to the speak from Federal Member. I believe it will rise again and will make new HIGH of this year. Better to buy on DIP as I already mentioned in the chart.

USDJPY Bull Run ContinuesUSDJPY leaped from price 140.200 to almost 143.000 this morning continuing the long-term bull trend. After the pairing reaches price 143.000 I am expecting the bull run to continue. I have based my analysis off charts from June 1998, the last time USDJPY saw these price points.
Buy Entry: 143.000
Broad Targets: 143.900 | 144.500
Resistance: 145.000
Be sure to like this post and let me know what you think in the comments below.

USDJPY smart money concepts MatrixVIt was easy predictible that USDJPY is bullish again, but you have to get a good risk managment. SMC has the best concepts with Risk Managment, where you have a 2-20 RR. The most important thing is to protect your money from the banks by your stopploss and takeprofit.
If you have a profitable 10 RR you can lose 10 trades and regain it with 1 trade.
Explanation= Yellow SMC Traders, Red Retail/Patterntraders. NOTICE!! Patterns are useful, but you have to know how every marketparticipant is trading: Patterntraders, Indicatortraders, SMC Traders, Orderflow Traders, Volume Traders, Banks
1. € = Liquidty in SMC Trading, Trend in Retailtrading, shows where price is going
2. CHOC (Change of Character): Market change its direction and brokes last supportzone = Sign of Market Reversal
3. Yellow Fibonacci: SMC Traders take the last candle of Support/Resistance and take the 0.5 Zone as their TP/ENTRY/STOPPLOSS
They try to knock out Retail Traders, who wait for breakout in 1minute Chart = Fakeout = Entry of SMC Traders
SMC Trading is based on risk managment, its the most important thing.
4. Entry Pattern Traders: Pattern Traders see a bullflag, they take the bearish trend, copy it, and wait for trendhit. Their stopploss is mostly the golden 1.618 Zone, Takeprofit, is close to the other trendline. They often have a 1:2 RR;
5. Entry SMC Traders: 0.5 or 0.618 FIB Zone of last resistance or support zone (ITS A "LAW"), which they take to draw their stopploss/entry
We have a bearish CHOC, so there are still short positions, which push the price down.
You have to practice your style of entry/stopploss/takeprofit. Your goal with SMC is to place trades with a high RR (5+)
Combine it with other retail strategys like patterns or indicators. the more confirmations the better
6. TP of SMC Traders: The last bull consolidation zone (CZ), before the the price did the bigger bullcandle.
SMC Traders take the 0.5 FIB Zone of the low and high of the CZ as their takeprofit. There is also the CHOC Zone, which is also a confirmation
This TP can also be an entry for a longposition.
7. BOS (Break of structure): Market broke through last resistance, closed the body of the candle above the zone. retest, BOS
8. 2nd SMC Entry: Retail Traders will go long instantly, but your goal is to buy as low as possible to take your RR high.
2nd SMC Entry is the BOS Zone, Stopploss the 1st supportline, Takeprofit is your choice
Follow for more. Normally my posts are very short, but this time I thought I have to explain my TrAdInGvIeW
GG Ez MatrixV Ruler Of The Market

USDJPY BuyThe USDJPY is forming Simple Bullish Flag Pattern and the indicators are already giving bullish sign.

USDJPY Buy and then SellAs Dollar Currency Index seems bullish so by this we can assume that USDJPY will go more up to it's Resistance zone.

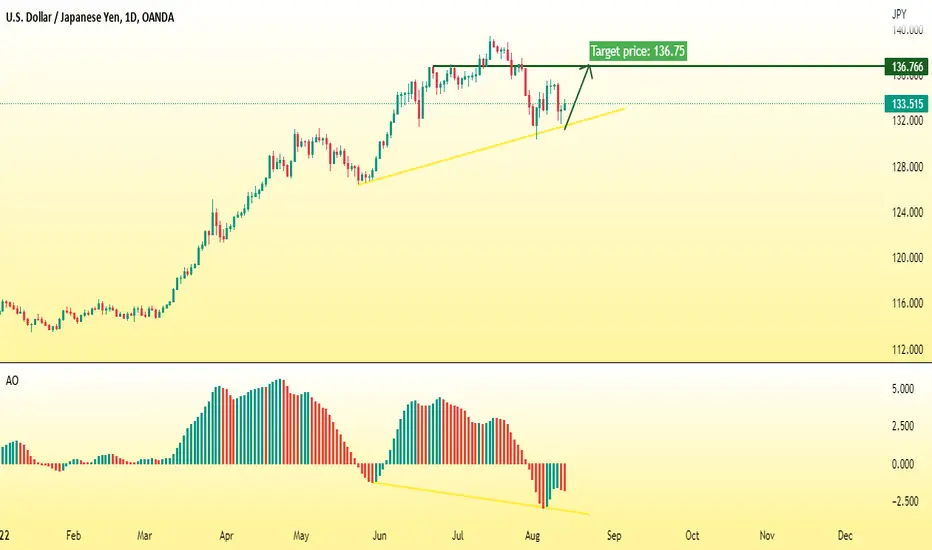
USDJPY BuyThe market of USDJPY is in Bullish Divergence and also it taking support on Trend line which is giving strong indication of further bullish momentum.
USDJPY H1: Bullish outlook seen, further upside above 134.500On the H1 time frame, prices are holding above an ascending channel and approaching the support zone at 134.500, in line with the 38.2% Fibonacci retracement and ascending channel’s support. This presents an opportunity to play the bounce to the next resistance target at 136.20. Prices are holding above the 50 EMA as well, supporting the bullish bias. Failure to hold above the 134.50 support zone could see prices push lower to the next support zone at 133.50.

USDJPY seems BullishAs we can see that USDJY taking support on it's previous support zone. I believe from the current market price it can be bullish.

USDJPY seems BullishJapanese yen is weaker against the USD. I believe that this bullish journey will remain continue in next week. Better to look buy opportunity on every support taken on trend line.

USDJPY seems BullishJapanese yen is still weak and I believe that this pair will continue grow to make new high.

USDJPY seems Bullish on Trend lineIt is better to look buying opportunity on it till it is above the trend line.

USDJPY Bull Continues Until 130.000+We have seen a nice leap in price since my last update, blowing past the resistance of 127.330 .
I am still bullish on USDJPY, but the price of 130.000 will be a big deciding factor. If the pairing continues past this price it will more than likely go onto to 134.000 . If not we may see some drops.
Current Trading Range based on April 2002 day chart
Entry: 128.650
TP: 129.000 | 129.200 | 129.600 | 129.800 | 130.000
For more frequent updates be sure to like this post and let me know what you think in the comments.

USDJPY seems BullishUSDJPY is obeying it's ascending trendline. The market will remain bullish till the USDJPY is remain above the trend line. Yen is weak against all currencies. Better to look buy setup on it.


USDJPY BREAKING THROUGHT HUGE LEVELIll be keeping my eyes on this one but it does look like we are breaking through a huge area of resistance and continuing on the bullish momentum. For now Ill wait and see if we can get a pull back and possible entry's for long trades around 114.250.

How I look at fast bullish runs USDJPYJust a bit of a look at how I trade these pairs when price is on a huge upside move. It can be very rewarding when you get entry's and straight into risk free but remember anything can happen and just cause price is looking so strong, we can get sell offs whenever... its better to be safe then lose.. risk amounts stay the same ALWAYS no matter how good a setup looks.

USDJPY - Long Trade Idea 112.060 targetUSDJPY, 1h Buy
Entry - 111.500
Stop Loss - 111.250 (25 pips)
Take Profit - 112.100 (60 pips)
usdjpy chart looks like a flag on 1h chart ..its posible to continue rising.. lets see what happens

USDJPY looks bullishIn the chart, USDJPY has breakout its descending trend line which indicates the more uptrend. Follow Monday bullish candle if occurred.

USDJPY is in Bullish ModeIn the chart, the market has strongly breakout its previous sell candle strongly for a further upside level.
