USD/JPY) Bullish reversal analysis Read The ChaptianSMC Trading point update
This chart is for USD/JPY on the 1-hour timeframe, and it presents a bullish trade setup. Let’s break down the idea
---
Key Observations:
1. Current Price:
USD/JPY is trading around 146.281.
2. Overall Bias:
Bullish setup expecting a bounce from demand into a higher target zone.
3. EMA 200:
Price is currently below the 200 EMA (147.942), which usually suggests a bearish trend — but this setup is aiming for a short-term bullish retracement.
4. Demand Zone (Buy Area):
Marked in yellow between 145.822 and slightly above.
Labeled as "FVG orders" (Fair Value Gap), suggesting institutional interest or imbalance fill.
5. Trendline Support:
The price is approaching a rising trendline, adding confluence for a potential bounce.
6. Expected Move:
Price is expected to bounce from the demand zone, form a higher low, and then move up toward the target zone at 148.221.
Two upside targets are drawn:
First Move: ~1.12% (30.6 pips)
Full Target: ~1.76% (256.1 pips)
Mr SMC Trading point
7. RSI (Relative Strength Index):
RSI is around 37.66, nearing oversold territory, supporting a bullish reversal idea.
---
Trade Idea Summary:
Bias: Bullish
Entry Zone: Around 145.822 (fair value gap & trendline support)
Target Zone: 148.221
Stop Loss: Likely just below the demand zone or trendline
Confluence Factors:
Trendline support
RSI nearing oversold
Fair value gap zone
EMA 200 overhead (target acts as resistance)
---
Pelas support boost 🚀 analysis follow
Usdjpybuy

USD/JPY 4H Chart Analysis:Trend Break & Support-Based Long Setup1. Previous Uptrend Channel
📈
Price moved in a rising channel
Lower trendline acted as support ✅
Then came the trend line break ⚠️ — signal of trend reversal
2. Major Drop
🔻💥
After breaking support, the price fell sharply
Strong bearish momentum took over
Sellers dominated the market
3. Support Zone Identified
🟦 Support Box (146.110 - 145.156)
Buyers stepped in at this level
Possible bounce or consolidation
Price currently at 147.014 — just above support
4. Trade Setup Idea
🛒 Buy Opportunity (if price holds support)
📌 Entry Zone: Around 146.110
🎯 Target: 150.260
🛑 Stop Loss: 145.156
📊 Risk:Reward = ~1:2 — solid R:R setup!
5. Indicators & Confirmations
🟠 DEMA (9): Sitting at 146.110 — aligns with support!
✅ Extra confluence for the bounce!
Summary
If price holds above support:
Buyers might push toward 150.260
If it breaks below 145.156:
Sellers may regain control

USD/JPY Bullish Reversal Setup with 2.30% Upside PotentialThis is a USD/JPY 1-hour chart analysis, and it looks like a bullish setup is being anticipated. Here's a breakdown:
Key Observations:
1. Support Zone (Purple Box - Around 146.411 - 146.429):
Multiple bullish rejections (green arrows) indicate a strong support level.
Price bounced off this support recently, forming a potential double bottom.
2. EMA Levels:
50 EMA (Red Line) is currently at 146.411.
200 EMA (Blue Line) is at 148.499, acting as dynamic resistance.
Price has crossed above the 50 EMA, a bullish sign, and might aim for the 200 EMA next.
3. Projected Bullish Path:
The path drawn suggests a pullback to the support zone around 146.429, followed by a bullish continuation.
Target zone is marked around 150.032, showing a projected gain of 2.30% (337.2 pips).
4. Resistance Levels:
Minor resistance at the 200 EMA (~148.5).

USDJPY Reversal: Bearish Momentum Builds Below Key ResistanceUSDJPY pair is showing signs of a bearish reversal after rejecting a key resistance zone near 151.241. The price has failed to sustain bullish momentum and has formed a potential double-top/wedge structure, indicating a shift in trend.
Key Resistance: 151.241 - 152.097 (Strong supply zone)
Bearish Confirmation: Break below 149.592 confirms downside continuation.
Key Downside Targets: 148.195, 146.990, and 145.855 as major support zones.
If sellers maintain pressure, a deeper pullback toward the 145.855 - 145.824 region could be expected. However, a break above 152.097 would invalidate the bearish setup and could push the price toward 154.090.

USD/JPY 30-Minute Trade Setup: Bullish Reversal from Key SupportEMA (30, close) - Red Line: 149.488 (shorter-term trend)
EMA (200, close) - Blue Line: 149.862 (longer-term trend)
Trade Setup:
Entry Zone: Around 149.000 (marked by the purple support area)
Stop Loss: 148.698 (below the key support level)
Target Point: 150.275 (potential profit level)
Analysis:
Price is currently testing a strong support zone (purple area), suggesting a possible bullish reversal.
The 30 EMA (red) is acting as local resistance.
The 200 EMA (blue) is positioned above, which may act as further resistance if price moves up.
The price action suggests a potential bounce from support, leading to a target around 150.275.
Risk-to-Reward Consideration:
Stop loss is placed slightly below the support zone for risk management.
Target price provides a favorable risk-to-reward ratio of approximately 1:3.
Conclusion:
A long (buy) trade is expected if price holds above the support zone.
If price breaks below 148.698, the bullish setup could be invalidated.
A break above 149.862 (200 EMA) would confirm a stronger bullish continuation.

USD/JPY(20250328)Today's AnalysisToday's buying and selling boundaries:
150.74
Support and resistance levels
151.83
151.42
151.16
150.32
150.06
149.66
Trading strategy:
If the price breaks through 151.16, consider buying, the first target price is 151.42
If the price breaks through 150.74, consider selling, the first target price is 150.32

151.00 Cracks: Is USD/JPY’s Rally Over? Key Levels AheadFrom a fundamental perspective, the USD/JPY exchange rate retreated from around the 151.00 level. Despite the poor Japanese PMI data on Monday, investors bought the Japanese yen influenced by the hawkish outlook of the Bank of Japan (BoJ). The minutes of the January meeting showed that policymakers tend to tighten policies when appropriate. The BoJ governor also stated that the degree of monetary easing will be adjusted once the 2% inflation target is achieved.
Technically, the overnight breakout above the 150.00 psychological mark and the 200 - period Simple Moving Average (SMA) on the 4 - hour chart is a bullish signal. Indicators on the daily chart also support appreciation, and pullbacks may present buying opportunities. If the rate breaks below 150.00, it may accelerate its decline to support levels such as 149.30 - 149.25. Failure to hold these levels indicates that the rebound momentum has been exhausted and the trend may turn bearish. Conversely, if it stabilizes above 151.00, the upward resistance levels are successively 151.30, 151.75 (the 200 - day SMA), and it may even rise to 153.00.
I will share trading signals every day. All the signals have been accurate for a whole month in a row. If you also need them, please click on the link below the article to obtain them.

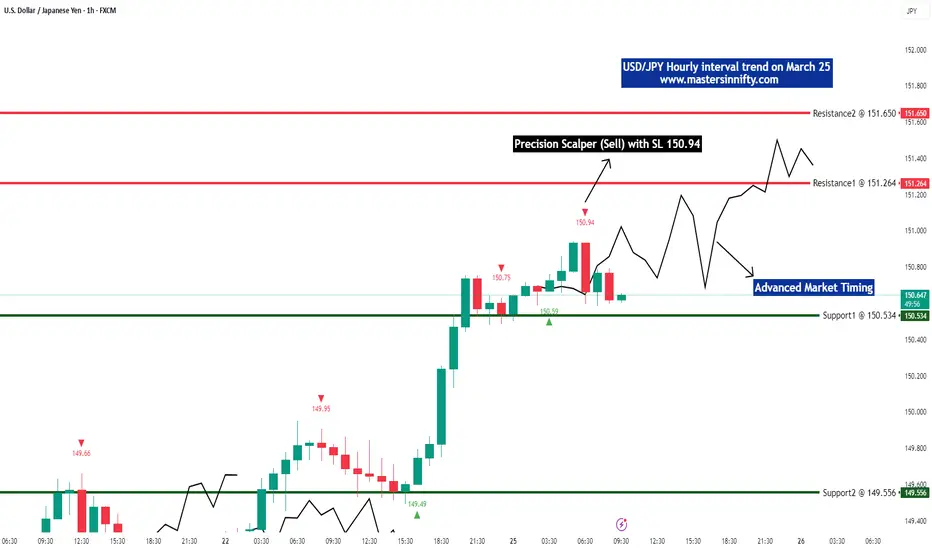
USD/JPY hourly trend on March 25thThis Forex pair is still bullish. Support at 150.534 and 149.556 and Resistance at 151.264 and 151.650. Our "Precision Scalper" indicator has confirmed Sell with a SL @ 150.94.
USDJPY Bullish Breakout!
HI,Traders !
USD-JPY was trading
Beneath the falling resistance
Line but now we are seeing a
Bullish breakout so we are
Now locally bullish biased
And we will be expecting a
Further bullish move up !
Comment and subscribe to help us grow !

USDJPY 1.2850 Long in Profit: Next Week's Take - Profit GuideThis week, the long position signal on USDJPY at the 1.28500 level has already started yielding profits. As we look ahead to next week, it is advisable to commence position closing once the price reaches the pre - determined target levels. Rest assured, I will persist in furnishing precise trading signals.
I will share trading signals every day. All the signals have been accurate for a whole month in a row. If you also need them, please click on the link below the article to obtain them.

USDJPY: Volatility and Key LevelsThe recent trend of the USD/JPY has been highly volatile. On the economic data front, the rise in Japan's unemployment rate and the decline in corporate capital expenditure have triggered selling pressure on the Japanese yen. However, factors such as corporate wage growth provide grounds for the Bank of Japan to consider raising interest rates.
From a technical perspective, key support levels are situated around 147.7 and 146.5, whilst the resistance levels are now between 150 and 151. Amid the ongoing battle between bulls and bears, the pair is likely to continue trading within the range of 147.00-149.00. That said, given the current upward momentum, a technical pullback followed by further gains in the short term cannot be ruled out.
USDJPY
buy@148.000-149.000
tp:150.000-151.000
I will share trading signals every day. All the signals have been accurate for a whole month in a row. If you also need them, please click on the link below the article to obtain them.

USDJPY Trading strategyThe USDJPY is currently at a critical level, with the price fluctuating around 149.00. The resistance level above is at 150.00, and if broken through, it may further test 151.00. The support level below is at 148.50, and if it falls below, it may drop to 148.00. Recently, the market has been focusing on the monetary policy trends of the Federal Reserve and the Bank of Japan. The strengthening of the US dollar and the weakness of the Japanese yen may push USDJPY higher.
USDJPY Trading strategy:
buy@148.50-149.00
tp:150.00-150.50-151.00
Traders, if this concept fits your style or you have insights, comment! I'm keen to hear.
For those who are seeking professional guidance in trading trend analysis, strategy formulation, and risk management, please click below to get the daily strategy updates.

USDJPY analysis todayHello traders, this is a complete multiple timeframe analysis of this pair. We see could find significant trading opportunities as per analysis upon price action confirmation we may take this trade. Smash the like button if you find value in this analysis and drop a comment if you have any questions or let me know which pair to cover in my next analysis.

USDJPY lonIn a positive trend, we are approaching the bottom of the range, which I expect to reverse, and we have a good position, and at the bottom of this range we have the sacred 86 line.

USDJPY TRADE IDEA : LONG | BUY (12/03)Price has been ever so bullish. Taking advantage of that opportunity.
RR: 5
N.B.: This is not financial advice. Trade safely and with caution.
USDJPY Counter Trend Opportunities - Fxdollars - {11/03/2025}Educational Analysis says USDJPY may give countertrend opportunities from this range, according to my technical.
Broker - FXCM
So my analysis is based on a top-down approach from weekly to trend range to internal trend range.
The weekly trend range is long up to 170.000
Trading Range Approach is a long counter trend opportunity or pushback up to 155.000
The internal Trend Range Approach is a Long counter trend opportunity or pushback up to 150.000
or continue going down with an internal trading range or trading range up to 135.000
Let's see what this pair brings to the table for us in the future.
Please check the comment section to see how this turned out.
DISCLAIMER:-
This is not an entry signal. THIS IS ONLY EDUCATIONAL PURPOSE ANALYSIS.
I have no concerns with your profit and loss from this analysis.
I HAVE NO CONCERNS WITH YOUR PROFIT OR LOSS,
Happy Trading, Fx Dollars .

USDJPY BuyUSDJPY Trade Signal
📉 Pullback & Potential Reversal
Price Level: 150.41
Support Zone: 148.37 - 149.98
Resistance Targets: 152.06 / 154.00
📌 Trade Plan:
Wait for a pullback confirmation before entering long.
Stop Loss: Below 148.37
Targets: 152.06 → 154.00
⚠️ Risk Management: Control risk and wait for a clear breakout.

USDJPY Buy TradeUSDJPY buy trade can be taken below the mentioned area as it's break higher high on 4hrs to target mentioned in the chart.
Manage your risk according to your account size!

USDJPY Will Grow!
HI,Traders !
USD-JPY is already making
A local bullish rebound from
The horizontal support
Level of 149.154 so we are
Locally bullish biased and
We will be expecting a
Further move up !
Comment and subscribe to help us grow !

USDJPY: remains below 150.00Furthermore, any significant retracement could find immediate support near the 149.50 level, which is followed closely by the 149.00 round number. A break below the latter might expose the USD/JPY pair to a retest of the 148.50 region, a level seen as the next strong support. Sustained weakness below this area could pave the way for a deeper corrective decline, with the next target around the 148.00 level. Traders will likely keep a close eye on these levels, as they could provide fresh directional impetus for the pair.

USD/JPY "The Gopher" Forex Market Bullish Heist Plan🌟Hi! Hola! Ola! Bonjour! Hallo!🌟
Dear Money Makers & Robbers, 🤑 💰
Based on 🔥Thief Trading style technical and fundamental analysis🔥, here is our master plan to heist the USD/JPY "The Gopher" Forex market. Please adhere to the strategy I've outlined in the chart, which emphasizes long entry. Our aim is the high-risk Red Zone. Risky level, overbought market, consolidation, trend reversal, trap at the level where traders and bearish robbers are stronger. 🏆💸Be wealthy and safe trade.💪🏆🎉
Entry 📈 : "The heist is on! Wait for the breakout (156.500) then make your move - Bullish profits await!"
however I advise placing Buy limit orders within a 15 or 30 minute timeframe. Entry from the most recent or closest low or high level should be in retest.
Stop Loss 🛑: Thief SL placed at 154.700 (swing Trade) Using the 2H period, the recent / nearest low or high level.
SL is based on your risk of the trade, lot size and how many orders you have to take.
Goal 🎯: 160.000 (or) Escape Before the Target
Scalpers, take note 👀 : only scalp on the Long side. If you have a lot of money, you can go straight away; if not, you can join swing traders and carry out the robbery plan. Use trailing SL to safeguard your money 💰.
📰🗞️Fundamental, Macro, COT, Sentimental Outlook:
USD/JPY "The Gopher" Forex Market market is currently experiencing a bullish trend,., driven by several key factors.
🔰 Fundamental Analysis
The USD/JPY pair is currently extending gains above 155.50, driven by resurgent US dollar demand due to global trade war concerns. The Bank of Japan's (BoJ) Summary of Opinions has had little impact on the pair.
🔰 Macroeconomics
The US economy is expected to slow down, with the Gross Domestic Product (GDP) growing at an annual rate of 2.3% in the fourth quarter, below market expectations. In Japan, consumer prices in Tokyo rose in January, keeping hopes alive for further BoJ policy tightening.
🔰 COT Report
The latest CoT report shows that speculative traders are net long on the USD/JPY pair, indicating a bullish sentiment. However, it's essential to note that the CoT report is a lagging indicator and may not reflect current market conditions.
🔰 Market Sentiment
Market sentiment is currently bearish, with 55% of traders expecting a decline in the USD/JPY pair. However, this sentiment can change rapidly, and it's essential to monitor market news and events.
🔰 Institutional and Retail Banks Positioning
Institutional traders are net long on the USD/JPY pair, while retail traders are net short. This divergence in positioning can lead to a potential bullish move in the pair.
🔰 Overall Outlook
Based on the analysis, the USD/JPY pair is expected to move in a bullish trend, with a 60% chance of an uptrend and a 40% chance of a downtrend. However, it's essential to monitor market news and events, as they can impact the pair's direction.
⚠️Trading Alert : News Releases and Position Management 📰 🗞️ 🚫🚏
As a reminder, news releases can have a significant impact on market prices and volatility. To minimize potential losses and protect your running positions,
we recommend the following:
Avoid taking new trades during news releases
Use trailing stop-loss orders to protect your running positions and lock in profits
📌Please note that this is a general analysis and not personalized investment advice. It's essential to consider your own risk tolerance and market analysis before making any investment decisions.
📌Keep in mind that these factors can change rapidly, and it's essential to stay up-to-date with market developments and adjust your analysis accordingly.
💖Supporting our robbery plan will enable us to effortlessly make and steal money 💰💵 Tell your friends, Colleagues and family to follow, like, and share. Boost the strength of our robbery team. Every day in this market make money with ease by using the Thief Trading Style.🏆💪🤝❤️🎉🚀
I'll see you soon with another heist plan, so stay tuned 🫂

USDJPY R2🔍 Technical Analysis of USD/JPY
📌 Overall Trend:
After a downward correction, the price has reached the 154.250 support zone.
A positive reaction at this level suggests a potential upward move.
A price gap is visible in the 156.000 - 156.400 range, which may lead to a price increase to fill the gap.
📈 Buy Trade Signal (Long Position)
🔹 Entry Conditions:
If the price holds the 154.250 - 154.400 support zone and bullish reversal candlesticks appear, a long trade is recommended.
The ideal entry range is 154.600 - 154.860.
🔹 Stop Loss (SL):
Below 154.250
🔹 Take Profit (TP):
First target: 155.860
Second target: 156.110
Third target: 156.400 (if the bullish momentum continues)
🔹 Risk Management:
If the price stabilizes below 154.250, reconsider the trade.
Breaking above 156.110 increases the likelihood of further bullish movement to fill the price gap.
✅ Final Conclusion:
If the price finds support at 154.250 - 154.400, a buy trade is favorable.
A breakout above 156.110 could lead to a further target of 156.400.
📌 Ensure confirmation through price action and candlestick patterns before entering the trade.

USDJPY TRADE IDEA: LONG | BUY - W/B: 19/01/25UJ is going to be bearish for the next day or so, therefore taking opportunities as it goes up makes most sense. This is the entry I have found as the reversal has been made official.
RR: 3.64
N.B.: This is not financial advice. Trade safely and with caution.
