USDJPY - LITTLE BUY IDEA FOR TODAYWaiting for price to break resistance before buying to previous rejected level
Usdjpybuy

USDJPY reversed from resistance, potential drop!
USDJPY reversed off its resistance at 107.404 where it could potentially drop further to 106.684.
Trading CFDs on margin carries high risk.
Losses can exceed the initial investment so please ensure you fully
understand the risks.

USDJPY - BUY AFTER RETRACEMENTPreviously before price rose it came back to test the greyed out area, it looks as though the same thing is happening again
Once price reaches this zone we will look for more buy opportunities

USDJPY reversed from resistance, potential drop!
USDJPY reversed off its resistance at 107.404 where it could potentially drop further to 106.684.
Trading CFDs on margin carries high risk.
Losses can exceed the initial investment so please ensure you fully
understand the risks.

USDJPY reversed from resistance, potential drop!
USDJPY reversed off its resistance at 107.031 where it could potentially drop further to 106.227.
Trading CFDs on margin carries high risk.
Losses can exceed the initial investment so please ensure you fully
understand the risks.

USDJPY - 700+ PIPSPrice has reached a key level of support and broken above it, based on divergence and previous price action this will head to the resistance zone
Already in the buy ;)

USD/JPY Wave Analysis
The counter is been in an ABC correction format for the last 2 months.
It completed its waves A and B and is now constructing its wave C.
Further, the w and x leg of the wave C has been completed and it has kickstarted its y leg.
Hence, we expect the pair to be bearish in the short-term.

USDJPY reversed from resistance, potential drop!
USDJPY reversed off its resistance at 107.330 where it could potentially drop further to 106.947.
Trading CFDs on margin carries high risk.
Losses can exceed the initial investment so please ensure you fully
understand the risks.

USDJPY reversed from resistance, potential drop!
USDJPY reversed off its resistance at 107.674 where it could potentially drop further to 106.830.
Trading CFDs on margin carries high risk.
Losses can exceed the initial investment so please ensure you fully
understand the risks.

USDJPY reversed from resistance, potential drop!
USDJPY reversed off its resistance at 107.674 where it could potentially drop further to 106.830.
Trading CFDs on margin carries high risk.
Losses can exceed the initial investment so please ensure you fully
understand the risks.

USDJPY LONGGOOD LUCK
-----------------------
Disclaimer: Forex trading and trading in other leveraged products involves a significant level of risk and is not suitable for all investors.

USD/JPY WEEKLY FORECASTHello Traders, here is the full analysis for this pair, let me know in the comment section below if you have any questions, the entry will be taken only if all rules of the strategies will be satisfied. I suggest you keep this pair on your watchlist and see if the rules of your strategy are satisfied

USDJPY and Buy Area (1/7/2020)Buy limit
107.560
SL at 107.300
TP1 at 107.790
TP2 at 108.050
Always NOTE!
Pending the plan few minutes before News..!
Feel free to share my setup..

Bullish Bias: Market StructureMarket showing great movement for bullish momentum. Cup and Handle formation, together with wave analysis.


USDJPY bounced from support, potential for a further rise!
USDJPY bounced off 107.299 where it could potentially rise further to 108.097.
*Disclaimer.*
Trading leveraged products carries a high level of risk and may result in you losing substantially more than your initial investment. Pepperstone Group Limited is licensed and regulated by the Australian Securities and Investments Commission (AFSL 414530). Pepperstone Limited is authorised and regulated by the United Kingdom Financial Conduct Authority (FRN 684312). This information is not intended for distribution to, or use by, any person in any country or jurisdiction where such distribution or use would be contrary to local law or regulation.

USDJPY - BUYWaiting for price to break above resistance and we will buy to the next area of resistance

USDJPY reversed from intermediate resistance, potential drop!
USDJPY reversed off its intermediate resistance at 107.325 where it could potentially drop further to 106.426.
Trading CFDs on margin carries high risk.
Losses can exceed the initial investment so please ensure you fully
understand the risks.

USDJPY ad Buy Area (26/6/2020)Pending order
BUY Limit
SL at 106.655
TP1 at 107.005 (RR 1:1)
TP2 at 107.180
Safe trade, bro..!

USDJPY BUY/LONG 4HR Divergence + Huge WickIn this trade there are multiple confirmations for the USDJPY BUY/LONG:
USDJPY:
Divergence on 4hr
Huge Wick On 4hr
Bullish Engulfing on Daily
Reversal Pattern Near Previous Reversal Spot On Daily(Bullish Engulfing)
Indexes:
DXY(US DOLLAR INDEX): Showing Signs of Strength
JXY(JAPANESE YEN INDEX): Showing Signs Of Weakness
Use proper risk management
ALL GLORY BE TO THE MOST HIGH!!!

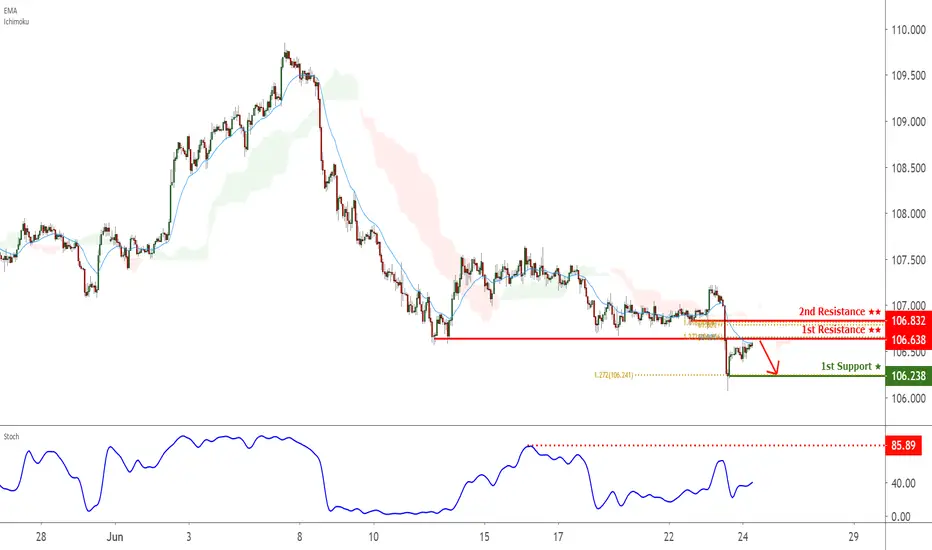
USDJPY - BUYWaiting on price to break through resistance before placing another buy to the green area


USDJPY approaching resistance, look out for potential reversal!
USDJPY is approaching its resistance at 106.638 where it is could reverse down to its support at 106.238.
Trading CFDs on margin carries high risk.
Losses can exceed the initial investment so please ensure you fully
understand the risks.