USDJPY top-down analysisHello traders, this is the full breakdown of this pair. We will take this trade if all the conditions are satisfied as discussed in the analysis. Smash the like button if you find value in this analysis and drop a comment if you have any questions or let me know which pair to cover in my next analysis.
Usdjpyforecast

Wave 5 completed for USDJPY. Downside only!I think the wave 5 is completed for the USDJPY and we should see more downside to come in the following weeks. In the short term, I'm expecting to see some consolidation at these levels before the break down farther comes.

USDJPY is in possible buy zone!!Hello traders, this is the full breakdown of this pair. We will take this trade if all the conditions are satisfied as discussed in the analysis. Smash the like button if you find value in this analysis and drop a comment if you have any questions or let me know which pair to cover in my next analysis.


USDJPY is gonna fall bigHi there
USDJPY is completing last bullish wave for a hard fall
Watch lower timeframes to add shorts, wait corrections and watch sharp breakout to the downside to add more shorts positions
Good luck

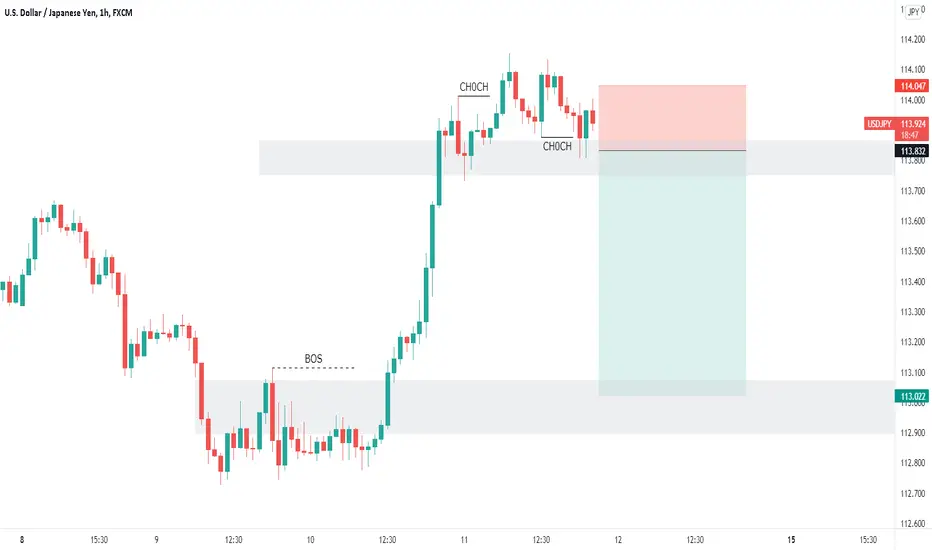
USDJPY Wait For The Trigger 🔥🔥Hello Traders , Welcome to this analysis, we are looking at the USDJPY, the 1-hour timeframe.
My trading strategy is based on the simplicity .
Please don't forget to FOLLOW , LIKE and COMMENT .
If you like my analysis.
Thank you and Good Luck!

USD/JPY 4HR CHART HEAD AND SHOULDERS SET UPHi everyone this is my trade set up for the USD/JPY for the new week ahead
USD/JPY i think will push lower as it formed head and shoulders last week and closed below the neck line, so I expect a nice sell set up
look for sell activity in the order block lined off on chart then if it meets your criteria for a trade then execute
This is my analysis only please trade with caution and risk management in place
good luck for this weeks trading
please like and comment both are welcome

USDJPY top-down analysisHello traders, this is the full breakdown of this pair. We will take this trade if all the conditions are satisfied as discussed in the analysis. Smash the like button if you find value in this analysis and drop a comment if you have any questions or let me know which pair to cover in my next analysis.

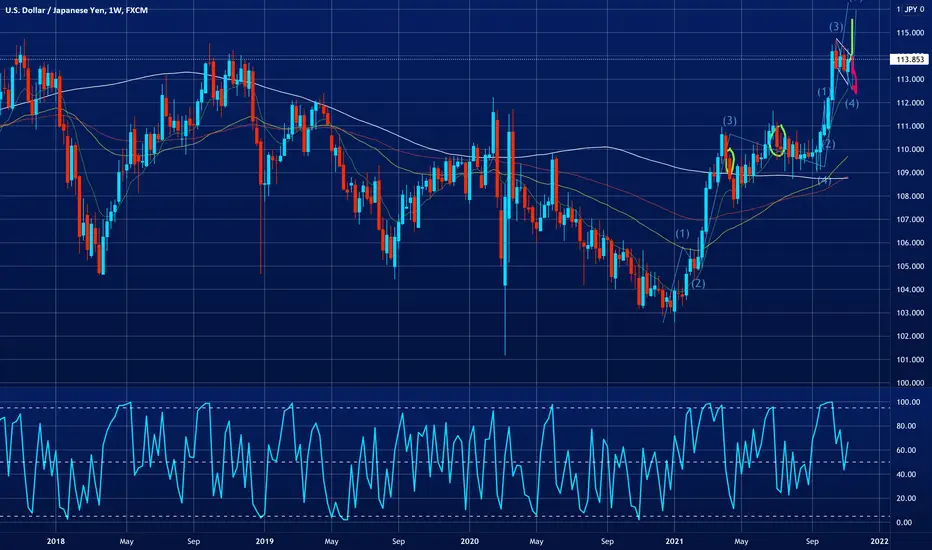
Is the wave 5 completed for USDJPY?Is the wave five impulse completed for the USDJPY or will we see one more fake out to the upside to catch traders the wrong side? We're neutral about the price action at this point
BULL CASE
Price could break 115 again and this may bring price up to even the 116 levels before a major correction. If this happens the downside target will be larger at around 111.
BEAR CASE
Price could be ready to move down from here, If this happens, we're looking at the 112.7 levels before some support is met.

USDJPY BUY SOONHi fellow traders, USDJPY is completing the correction, look for buy in the blue box area. Goodluck!

USDJPY BREAKING THROUGHT HUGE LEVELIll be keeping my eyes on this one but it does look like we are breaking through a huge area of resistance and continuing on the bullish momentum. For now Ill wait and see if we can get a pull back and possible entry's for long trades around 114.250.

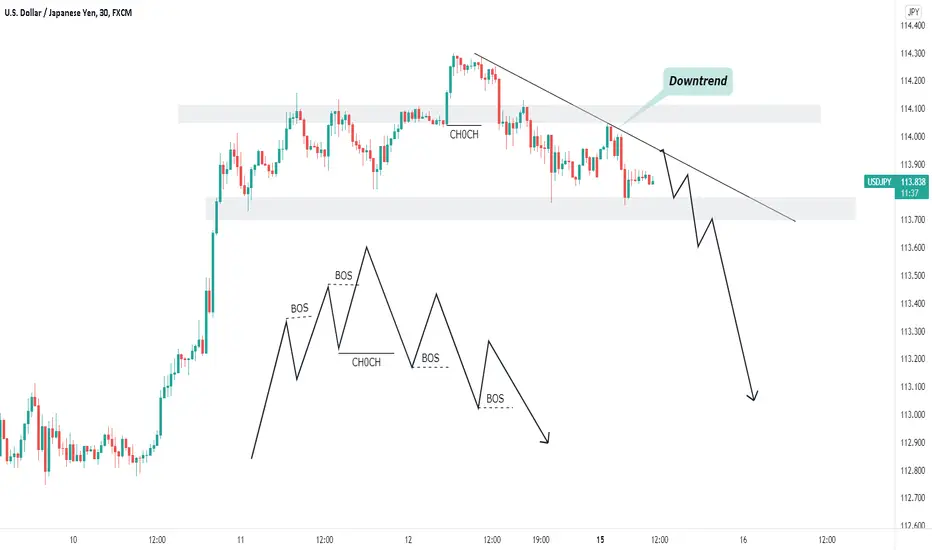
USDJPY Wait For The Trigger 🔥🔥Hello Traders , Welcome to this analysis, we are looking at the USDJPY, the 30M timeframe.
My trading strategy is based on the simplicity .
Please don't forget to FOLLOW , LIKE and COMMENT .
If you like my analysis.
Thank you and Good Luck!
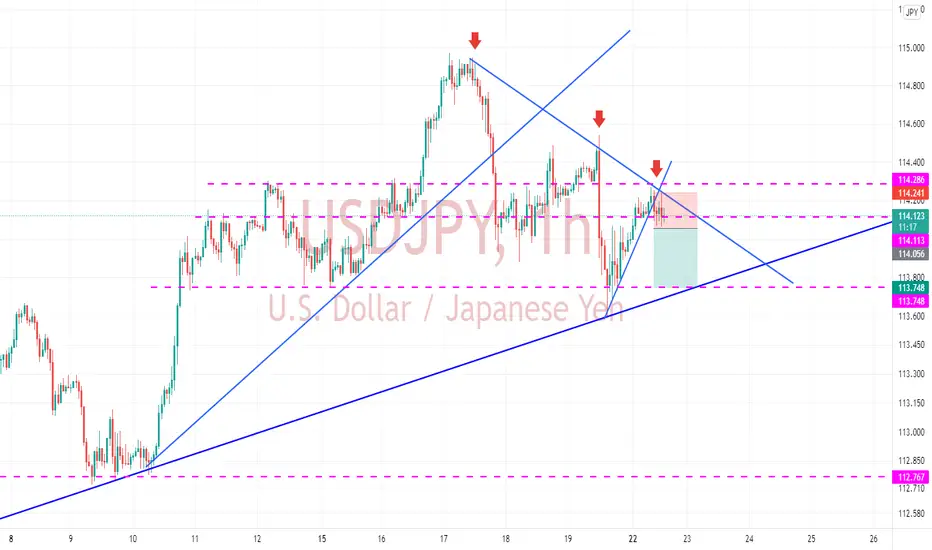
USDJPY KEY LEVELS WHAT TO LOOK FOR!So USDJPY back to the consolidation range, REMEMBER this consolidation range is a long term daily resistance also, so shorts from 114.200 is what I'm hoping for but will still look at taking buys off the support of 113.500. Either way wait for price to show the signs from the levels and always take some profits, good luck!

USDJPY H4After the formation of negative Hayden divergence in the 4-hour time frame and that the ceilings are still lower I expect the price to fall again to the lowest floor

Sell UJAs #UJ is following a Long Term Bullish Trend , It seems it wants to retest some of its levels. Take a #short from here and then #long when it continue with the long trend.

Indecision for the USDJPYThis chart looks indecisive, the bias is to the upside. If it is going down, there's going to be a long struggle where price trades sideways for an extended period of time. From an elliot wave perspective, looks like it is due for a wave 5.
BULL CASE
Price to break farther up from here, retest the top of the channel and find a higher high. This could be a rather short wave and we may find rejection as soon as 115.
BEAR CASE
The downside should be rather capped for this pair and if there's a big one coming, it will need to trade sideways for a bit.
USDJPY at an inflection point.Is Biden going to drop Powel? That's the million dollar question. Inflation is on the verge of bursting out in the US, if that happens, we will see price break out of the channel to reach higher heights. Otherwise, a rejection at the top of the channel to remain status quo is set to play out.
BEAR CASE
Until proven otherwise, our bias is status quo, we are expecting a price rejection at around 95.5.
BULL CASE
If price breaks out convincingly, we will wait for a pull back to make sure it's not a fake out and go for a long. The retest at 95.5 after a break out is in our sights.

USDJPY , Its time to sellHello guys
According to last analysis about USDJPY we shown resistance zone and now the price is in it and it seems that is making a triangle and its ready to fall down
We can be in position short with nice R/r and take profit until the 1st target and if the price can break the first target powerfully we can use our strategy for the second target
And we check the chart in multi-time frame and in 1h time frame we took another acceptance for taking short position
Dont Forget use stop loss and money management
Previous analysis :
Good Luck
Abtin

USDJPY top-down analysisHello traders, this is the full breakdown of this pair. We will take this trade if all the conditions are satisfied as discussed in the analysis. Smash the like button if you find value in this analysis and drop a comment if you have any questions or let me know which pair to cover in my next analysis.

UsdJpy- Rise to 118.50?There is no doubt that the overall trend for UsdJpy is strongly bullish and after reaching a recent high above 114, the pair corrected some of the gains.
The spike under 113.30 support was short-lived and quickly reversed giving us a signal that bulls are here and are very strong
Now UsdJpy is trading just under local resistance and a break looks imminent.
Once we have this break we can expect continuation to the upside and 118.50 is my target for this rise

USDJPY Wait For The Trigger 🔥🔥Hello Traders , Welcome to this analysis, we are looking at the USDJPY, the 1-hour timeframe.
My trading strategy is based on the simplicity .
Please don't forget to FOLLOW , LIKE and COMMENT .
If you like my analysis.
Thank you and Good Luck!
USDJPY Short Analysis Hey traders, here is the analysis for the USDJPY. Let me know if you guys have any questions in the comment section. If you guys like my analysis please hit like. Thanks. NOTE - Please do your own analysis before taking the trade.
