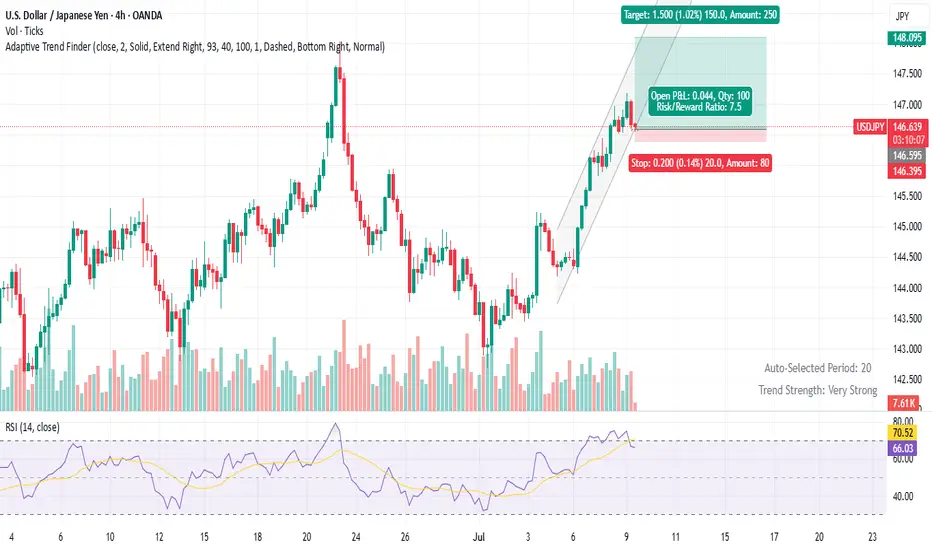
USD/JPY Long Trade SetupBuy dips - 146.50-146.60
Stop Loss -145.80 - Below retest zone; invalidates breakout.
TP-1 148.80 - Scale 50 % Pattern target / June high cluster.
TP-2 150.00 - Round-number magnet, option strikes.
Rationale
The dollar-yen cross has snapped out of its early-summer drift and vaulted back above the 100-day simple moving average for the first time since February, reaching ¥147.19 on 9 July – a two-and-a-half-week high – as the greenback rides an upswing in U.S. yields and tariff-driven inflation fears. The technical breakout puts the familiar 148.00/150.00 band – the June swing high and the psychological round number – back in play for trend-followers over the next several sessions.
Policy divergence as wide as ever
Federal Reserve – higher-for-longer: Minutes from the June FOMC showed staff pushing inflation projections higher and flagging “upside risks” should tariff pass-through accelerate, reinforcing the market’s view that rate cuts will be pushed into Q4 at the earliest. Five straight sessions of rising Treasury yields have followed, lifting the 10-year to 4.45 % and widening the U.S.–Japan real-rate gap.
Bank of Japan – stuck on hold: Former BOJ board member Makoto Sakurai told Reuters the central bank will “wait at least until March 2026” before considering another hike, as Trump’s 25 % tariff on Japanese goods (effective 1 August) clouds the export outlook and will likely force the BOJ to cut its growth forecast at the 31 July Outlook Report. With headline CPI still only just above target and real wages contracting.
Usdjpylong
USDJPY – Key Support Bounce with Macro TailwindsUSDJPY is bouncing off a key trendline and 61.8% Fib zone (143.25–143.60) with confluence across multiple JPY crosses (EURJPY, AUDJPY, CADJPY). This area has historically triggered strong upside momentum, and the current setup aligns with both technical structure and macro drivers.
📊 Fundamentals Supporting the Move:
✅ US Yields Stable: US10Y is holding above 4.20%, keeping USDJPY supported. If yields push back toward 4.30%, expect USDJPY to retest 145.30 and potentially 147.80.
✅ BoJ Dovish: Japan shows no shift in policy. Despite weak Tankan data, BoJ remains patient, and no meaningful rate hike or YCC change is expected soon.
✅ USD Macro Resilience: Core PCE held firm at 2.6%. Focus now shifts to ISM Services PMI (Wed) and NFP (Fri). Markets are still pricing a soft landing – supporting risk-on and a stronger USD.
✅ JPY as a Fading Safe Haven: Even with geopolitical headlines (Trump tariff tensions, Taiwan, Middle East), JPY demand remains weak. Traders are favoring USD and Gold over JPY as risk hedges.
⚠️ Risks to Watch:
Dovish US Data Surprise: Weak NFP or ISM could drag yields down and trigger USDJPY reversal.
Verbal or Actual BoJ Intervention: If we approach 148.50–150, Japan may step in again.
Geopolitical Escalation: Any sharp risk-off could trigger safe haven demand for JPY, though this has underperformed recently.
🔎 Correlation Dynamics:
📈 USDJPY is leading JPY crosses like EURJPY and AUDJPY. The recent bounce started simultaneously across the JPY complex, with USDJPY slightly ahead.
📉 If US yields drop or risk sentiment shifts, USDJPY may lag gold or bonds but eventually catch up.
🧠 Trading Plan:
📍 Entry Zone: 143.30–143.60 (trendline + Fib confluence)
🎯 Target 1: 145.30 (38.2% Fib)
🎯 Target 2: 147.80 (channel resistance)
🛑 Invalidation: Daily close below 141.50 with US yields breaking down
📅 Upcoming Events to Watch:
Wed July 3: ISM Services PMI (key for USD reaction)
Fri July 5: US Non-Farm Payrolls + Average Hourly Earnings
JPY Risk: Verbal intervention possible near 148+
🧭 Summary:
USDJPY is positioned for a bullish continuation, backed by:
Rising yields
Resilient US macro
Weak JPY fundamentals
Technical structure respecting trendline support
Short-term traders can target the 145–147.80 range ahead of NFP, with a tight eye on yield and risk sentiment.
📌 If this analysis helps, drop a like and follow for more real-time macro-technical breakdowns. Stay nimble ahead of NFP! 🧠📈

USDJPY Price Accumulated|Time For Bullish Distribution|Setupsfx|The price has accumulated nicely and is now distributing. We have three targets in mind, but set your own based on your analysis. Our approach is purely technical, but also includes a basic fundamental approach. This analysis concludes over 1500 pips and is a swing move. Please use this analysis as educational purposes only, as it does not guarantee that price will move exactly as predicted.
If you like our idea, please consider liking and commenting on it.
Good luck and trade safely!
Team Setupsfx_

USD/JPY Range- weekly chart setupUSD/JPY abhi ek strong range-bound structure mein trade kar raha hai jisme clearly defined support aur resistance zones dikhai de rahe hain. Chart par price 144.50 ke aas paas consolidate kar raha hai, jahan se dono directions mein breakout ka potential bana hua hai.
📉 Resistance Zone: 145.80 – 146.20
📈 Support Zone: 142.30 – 142.70
🔍 Current Price: 144.50 (As of July 6, 2025)
🧠 Trading Scenarios:
🔽 Bearish Scenario:
Agar price 145.80 zone se reject hota hai, to short-term selling pressure dekhne ko mil sakta hai, jisme target 1: 143.50 aur target 2: 142.50 ka ho sakta hai.
🔼 Bullish Scenario:
Agar price support zone (142.50) se strong bounce karta hai, to range ke upper bound (145.80) tak ka upside move expected hai. Breakout ke baad extended target 147.00+ tak ho sakta hai.
📊 Timeframe: 4H
📍 Setup Type: Range Trade | Mean Reversion | Breakout Watch
💬 Idea by: Liquidity_Gold_FX
🔔 Follow for more FX setups and updates.

LONG ON USD/JPYUSD/JPY has given us a CHOC (change of character) from down to up.
It has engineered sell side liquidity right above a demand zone.
I expect price to sweep sell side liquidity, tap into the demand zone then take off to the upside.
looking to catch 150-250 pips on UJ. (Economic News could set this trade on Fire!)

USD/JPY Bullish Reversal AnalysisUSD/JPY Bullish Reversal Analysis 📈💹
🔍 Technical Overview:
The chart illustrates a strong bullish reversal pattern forming on USD/JPY after price reacted from a key support zone at 144.600. This level has held firm multiple times, marked by green arrows, signaling strong buying interest.
📐 Chart Patterns & Structure:
✅ A bullish harmonic pattern (possibly a bullish Bat or Gartley) is completing near the 144.600 zone.
🔄 Multiple rejection wicks and bullish engulfing patterns indicate a potential upside reversal.
🔵 Descending trendlines have been broken, confirming momentum shift.
🔁 Previous resistance turned support (near 145.000) is acting as a possible launchpad for the next move.
🎯 Upside Target:
The projected move targets the resistance zone at 147.698, aligning with previous highs and a significant supply area.
If price breaks above 145.900 convincingly, continuation toward this resistance is expected.
🔻 Downside Risk:
A break below 144.600 would invalidate the bullish setup and expose price to the lower support range near 142.000–143.000.
📊 Conclusion:
USD/JPY is showing signs of bullish reversal from a strong demand zone. If price sustains above 145.000 and breaks the minor consolidation, the pair could rally toward 147.698 🎯.
Bias: Bullish ✅
Support: 144.600
Resistance: 147.698

LONG ON USD/JPYLong on UJ
- Price is respecting a major demand zone after a break and retest
- DXY (Dollar) is bullish
- Yen Bearish

USDJPY Analysis🚀 We entered the buy trade from the bottom level (check the pinned idea)
Thanks to our trailing stop strategy, we locked in full profits ✅
For those who missed it — a new buy zone is now marked on the chart!
Be patient and don’t trade emotionally ✋

USD/JPY Bullish Reversal Trade Setup – Key Support Test at 145.2Entry Point: 145.273 (highlighted in blue)
Stop Loss: ~144.817–145.260 (purple zone)
Target Point (TP): 148.133 (upper resistance zone)
📉 Recent Price Action:
Price peaked near 148.05 before reversing sharply and breaking the trendline.
The market is currently testing the support zone (near the 145.273 entry level).
Moving averages (red = short-term, blue = long-term) show a crossover to the downside, suggesting short-term bearish momentum.
📈 Trade Setup:
Strategy Type: Long (Buy) Setup
Risk/Reward: Favorable, approximately 1:2+
Entry Zone: The current price is close to the entry level at 145.273, making this a timely area to watch for a bounce or confirmation.
⚠️ Risk Factors:
If price breaks below 144.817, the setup becomes invalid.
Short-term momentum is still bearish; confirmation (like a bullish engulfing candle or support hold) is important before entering.
✅ Confirmation Triggers for Entry:
Strong bullish candlestick pattern near entry zone.
RSI or MACD bullish divergence (not shown but useful to check).
Volume spike on bounce from support.

USD/JPY Long Trade Setup – Key Support Rebound Targeting 148.674Entry Point:
Price: 143.373
The chart suggests initiating a long (buy) position at this level, which is just slightly below the current market price.
Stop Loss:
Price: 141.707
Positioned below a strong support zone. This level protects the trade from excessive downside risk if the price breaks down.
Target Point:
Price: 148.674
The target is clearly defined, indicating a potential gain of approximately 5.991 points, or 4.20% from the entry.
🟪 Support/Resistance Zones
The purple boxes indicate demand (support) and supply (resistance) zones.
The lower zone (entry/stop area) shows a historically significant support range that has been tested multiple times (indicated with orange circles).
The upper purple zone marks the take-profit area, which coincides with previous resistance.
📊 Moving Averages
Blue Line: 200 EMA (Exponential Moving Average) – acting as dynamic resistance.
Red Line: 50 EMA – price is currently trading below it, indicating bearish short-term pressure but potential for reversal.
🧠 Trade Idea Summary
Bias: Bullish (long position)
Risk-Reward Ratio: Favorable
Risk: ~1.67 points (from 143.373 to 141.707)
Reward: ~5.3 points (from 143.373 to 148.674)
Approx. R:R = 1:3.17
Validation: The setup relies on the price holding the key support zone and bouncing higher, targeting the next major resistance.
⚠️ Considerations
Monitor for bullish candlestick patterns near the entry zone.
Keep an eye on macroeconomic news (like BoJ or Fed updates) that could cause volatility in USD/JPY.
Confirm momentum shift with RSI or MACD if using indicators.

USD/JPY Breaks Higher – Bullish Momentum Targets 148.40FX:USDJPY CMCMARKETS:USDJPY USD/JPY continues to climb, extending gains above the key 146.00 breakout level, supported by Fed–BoJ policy divergence and rising geopolitical tensions. Despite Japan’s strong CPI and PMI prints, the BoJ maintains a dovish tone, while tariff concerns continue to cap yen sentiment. The Middle East conflict further fuels demand for the USD as a safe haven.
Technically, the pair confirmed a bullish breakout, with price hugging the upper Bollinger Band – a sign of sustained upside pressure. As long as 146.00 holds, bulls may aim for the 148.40 monthly resistance.
Key Levels :
Resistance : 146.75 / 148.40
Support : 146.00 / 145.25
⚠️ Momentum favours the upside while above 146.00. Break below may trigger short-term pullback toward 145.25.

Long - the final move up before moving to the downsideMy macro bias for USDJPY is bearish. However, I opened a long position today.
Reasons for a long trade:
Weekly chart:
1) Both MACD and RSI are in the bear territory, however, both MACD and RSI lines are starting to cross and move to the upside.
2) The price has been moving sideways for weeks, however, weekly candle has been forming higher low since late April (subtle move).
3) There is a major support line at 140.50 area and weekly EMA200 is also sitting right below it.
Although the price has been moving to the downside, it will require strong momentum to pierce through the major support zone that has been holding since July 2023.
Daily chart:
1) EMA9 > EMA14 > EMA 21 - bullish trend
2) Yesterday's daily candle retested EMA 9/14/21 and closed above all of them.
3) MACD has entered the bull zone.
4) RSI has entered the bull zone.
5) There is an unmitigated fair value gap in the Fib 0.618-0.786 area. (see blue rectangular box in the chart).
As I said above, it will take strong momentum for the price to break below the major support line. It makes sense for the price to retrace to the unmitigated fair value gap area to take out all the liquidity to fuel the momentum to the downside.
My trade setup is below:
Entry: 145 Stop/Loss: 144.25 (just under yesterday's candle wick)Target: 147.12
Risk:Rewards 1:1.78

buy is coming on USDJPYThe USD/JPY pair recently experienced a bearish movement, which is largely influenced by heightened concerns surrounding the ongoing trade and tariff tensions between the U.S. and its global counterparts. This risk-off sentiment triggered a flight to safe-haven assets, weighing on the pair.
However, price action has now approached a key trendline support zone, which has held firmly in previous sessions. Technical indicators like RSI are also beginning to show signs of bullish divergence, suggesting a potential reversal. If this trendline continues to act as strong support, we may see a bullish bounce from the current level, aligning with the overall ascending trend structure but if the trade break these support zones, then the bearish movement might continues
for now we will be watching for confirmation signals such as bullish candlestick patterns or a break above near-term resistance levels to validate the upward movement.

USD/JPY 4-Hour Forex Chart (June 20, 2025)4-hour candlestick chart from FOREX.com displays the USD/JPY currency pair's performance, showing a current value of 145.328 with a slight decrease of 0.112 (-0.08%). The chart highlights a recent downward trend following a peak near 145.950, with a shaded area indicating a potential resistance zone around 145.500-145.950. The time frame spans from early June to the present date, with key levels marked at 145.000, 144.478, and higher resistance points.

USD/JPY 2-Hour Forex Chart2-hour candlestick chart from FOREX.com displays the exchange rate between the U.S. Dollar (USD) and the Japanese Yen (JPY). The current rate is 145.513, with a slight increase of +0.074 (+0.05%). The chart shows price movements over the past 2-hour period, with a notable upward trend followed by a recent decline, as highlighted by the shaded area indicating a potential resistance or reversal zone. Key levels such as 145.701 and 145.106 are marked, along with the current time of 04:00.

Bullish bounce?US Dollar Index (DXY) is falling towards the pivot and could bounce to the 1st resistance.
Pivot: 98.48
1st Support: 97.62
1st Resistance: 99.47
Risk Warning:
Trading Forex and CFDs carries a high level of risk to your capital and you should only trade with money you can afford to lose. Trading Forex and CFDs may not be suitable for all investors, so please ensure that you fully understand the risks involved and seek independent advice if necessary.
Disclaimer:
The above opinions given constitute general market commentary, and do not constitute the opinion or advice of IC Markets or any form of personal or investment advice.
Any opinions, news, research, analyses, prices, other information, or links to third-party sites contained on this website are provided on an "as-is" basis, are intended only to be informative, is not an advice nor a recommendation, nor research, or a record of our trading prices, or an offer of, or solicitation for a transaction in any financial instrument and thus should not be treated as such. The information provided does not involve any specific investment objectives, financial situation and needs of any specific person who may receive it. Please be aware, that past performance is not a reliable indicator of future performance and/or results. Past Performance or Forward-looking scenarios based upon the reasonable beliefs of the third-party provider are not a guarantee of future performance. Actual results may differ materially from those anticipated in forward-looking or past performance statements. IC Markets makes no representation or warranty and assumes no liability as to the accuracy or completeness of the information provided, nor any loss arising from any investment based on a recommendation, forecast or any information supplied by any third-party.

Current USD/JPY Trend Analysis and Trading RecommendationsOn Wednesday, the USD/JPY attracted buyers for the second consecutive day, trading near 145.20 in the early European session, close to a two-week high. Japan's May CGPI rose 3.2% YoY, the slowest pace since September last year, potentially easing BOJ rate hike pressure and weakening the JPY. Additionally, optimism over a framework agreement in U.S.-China trade talks dented the JPY's safe-haven appeal. Technically, the price holds above the 200-period SMA on the 4-hour chart and breaches the 145.00 psychological level, with oscillators tilting bullish. A valid break above 145.30 (Tuesday's high) would confirm the bullish setup, targeting the 146.00 integer mark and 146.25-146.30 resistance zone.
USDJPY
buy@145.000-145.200
tp:145.600-146.000

Skeptic | USD/JPY Analysis: Sharp Uptrend Triggers Ready!Hey, traders, it’s Skeptic! 😎 CMCMARKETS:USDJPY is gearing up for a sharp uptrend move, and if you sleep on it, you might miss it, jump in late, and get stopped out. So, let’s set our scenarios and triggers now to make quick, sharp decisions instead of lagging.
Daily Timeframe: The Big Picture
We were in a major bearish trend but now seem stuck in a triangle. The heavy bearish momentum and support zone at 142.232–142.604 —our key level—has held strong with reactions every time we hit it. But, the bearish moves are getting weaker , with shallower slopes and smaller, choppier candles, signaling fading momentum and a higher chance of a reversal. Still, we need a trigger to go long—without it, jumping in is risky. As a skeptical trader , I need solid reasoning for every move. That’s our vibe! :)))
Now, let’s hit the 4-Hour Timeframe for our triggers.
We’ve got a descending trendline , and breaking it upward could spark an uptrend. But here’s the deal: this isn’t a continuation pattern—a break means a trend reversal, so we need extra confirmation beyond just the break.
Our main long trigger is a break above resistance at 145.071 .
Stop loss? Place it below the trendline, previous support, or last low—depends on your strategy.I’m a breakout trader myself
( check my article for deets! ).
For confirmation, watch RSI hitting overbought—it backs the uptrend momentum and can push you to your R/R faster. 😊 I’ll drop an RSI tutorial soon , so stay tuned! If we lose the support zone ( 142.232–142.604 ), expect the bearish trend to continue, so focus on shorts then.
Final word: No FOMO . Wait for your triggers and confirmations. Our motto? No FOMO. No hype. Just reason :)
💬 Let’s Talk!
If this analysis helped you, smash that boost—it means a lot! 😊 Got a pair or setup you want me to hit next? Drop it in the comments. Thanks for chilling with me—keep trading smart! ✌️

Technical Analysis on JPY Price Action (as of June 9, 2025)📈 Technical Analysis on JPY Price Action (as of June 9, 2025)
---
🗂️ Overview:
This chart illustrates the price movement of the Japanese Yen (JPY) with clearly defined support and resistance zones. The setup suggests a bullish bias in the short term, with potential for a breakout toward previous highs.
---
🔍 Key Levels Identified:
🟥 Main Support Zone (141.80 – 142.80):
This is a strong demand zone.
Price bounced aggressively from this level in late May.
If broken, could trigger a major downside move 📉.
🟧 Support Zone (143.80 – 144.70):
Price is currently testing this zone.
Holding this area will be crucial for bullish continuation.
🟨 Resistance Zone (145.80 – 146.60):
This is the next target for bulls 🐂.
Historically acted as a supply zone, causing pullbacks.
🟫 ATH Resistance Zone (~147.80 – 148.50):
The All-Time High (ATH) resistance zone.
Strong rejection from here in the past; likely to act as a hard ceiling again 🚫.
---
🔄 Price Action Forecast:
🕊️ If the current support holds, expect a bullish move toward the 146.00–146.50 resistance.
📈 A breakout above this resistance could initiate a move to the ATH zone (147.80+).
🚨 A breakdown below 143.80 could lead to retesting the main support near 142.00.
---
📊 Technical Sentiment:
Bias: Bullish ✅
Trend: Recovering uptrend after forming a higher low.
Confirmation Needed: Break and retest of the 145.80–146.60 resistance for continuation.
---
✅ Trading Tip:
Wait for either:
🔁 A retest and bounce from 144.00 for long entries 🎯.
❌ A rejection at resistance for potential short opportunities if price fails to break 146.60.
---
📌 Conclusion:
The market shows bullish intent from support, but traders should watch the reaction near the resistance zone to confirm trend continuation. 📍Patience and confirmation are key.

The Japanese yen may face further downward pressure.The USD/JPY has trended higher in a volatile manner this week, rising 0.56% on a weekly basis and closing at 144.87 on Friday, marking the second consecutive week of gains. The Japanese yen, as a safe-haven currency, showed weakness this week, reflecting market concerns about Japan's economic outlook and the impact of Trump's tariff policies. The remarks of Kazuo Ueda (Governor of the Bank of Japan) reflected worries about the effects of the trade war. Market expectations indicate that the Bank of Japan is likely to maintain a dovish stance in the short term. If next week's GDP data is weak, the yen may face further downward pressure.
Humans need to breathe, and perfect trading is like breathing—maintaining flexibility without needing to trade every market swing. The secret to profitable trading lies in implementing simple rules: repeating simple tasks consistently and enforcing them strictly over the long term.

USD/JPY - Triangle Breakout (06.06.2025)The USD/JPY pair on the M30 timeframe presents a Potential Buying Opportunity due to a recent Formation of a Triangle Pattern. This suggests a shift in momentum towards the upside and a higher likelihood of further advances in the coming hours.
Possible Long Trade:
Entry: Consider Entering A Long Position around Trendline Of The Pattern.
Target Levels:
1st Resistance – 144.94
2nd Resistance – 145.52
🎁 Please hit the like button and
🎁 Leave a comment to support for My Post !
Your likes and comments are incredibly motivating and will encourage me to share more analysis with you.
Best Regards, KABHI_TA_TRADING
Thank you.
Disclosure: I am part of Trade Nation's Influencer program and receive a monthly fee for using their TradingView charts in my analysis.

USDJPY Analysis todayHello traders, this is a complete multiple timeframe analysis of this pair. We see could find significant trading opportunities as per analysis upon price action confirmation we may take this trade. Smash the like button if you find value in this analysis and drop a comment if you have any questions or let me know which pair to cover in my next analysis.

Bullish bounce?US Dollar Index (DXY) has bounced off the pivot and could rise to the 1st resistance.
Pivot: 98.36
1st Support: 97.98
1st Resistance: 99.23
Risk Warning:
Trading Forex and CFDs carries a high level of risk to your capital and you should only trade with money you can afford to lose. Trading Forex and CFDs may not be suitable for all investors, so please ensure that you fully understand the risks involved and seek independent advice if necessary.
Disclaimer:
The above opinions given constitute general market commentary, and do not constitute the opinion or advice of IC Markets or any form of personal or investment advice.
Any opinions, news, research, analyses, prices, other information, or links to third-party sites contained on this website are provided on an "as-is" basis, are intended only to be informative, is not an advice nor a recommendation, nor research, or a record of our trading prices, or an offer of, or solicitation for a transaction in any financial instrument and thus should not be treated as such. The information provided does not involve any specific investment objectives, financial situation and needs of any specific person who may receive it. Please be aware, that past performance is not a reliable indicator of future performance and/or results. Past Performance or Forward-looking scenarios based upon the reasonable beliefs of the third-party provider are not a guarantee of future performance. Actual results may differ materially from those anticipated in forward-looking or past performance statements. IC Markets makes no representation or warranty and assumes no liability as to the accuracy or completeness of the information provided, nor any loss arising from any investment based on a recommendation, forecast or any information supplied by any third-party.
