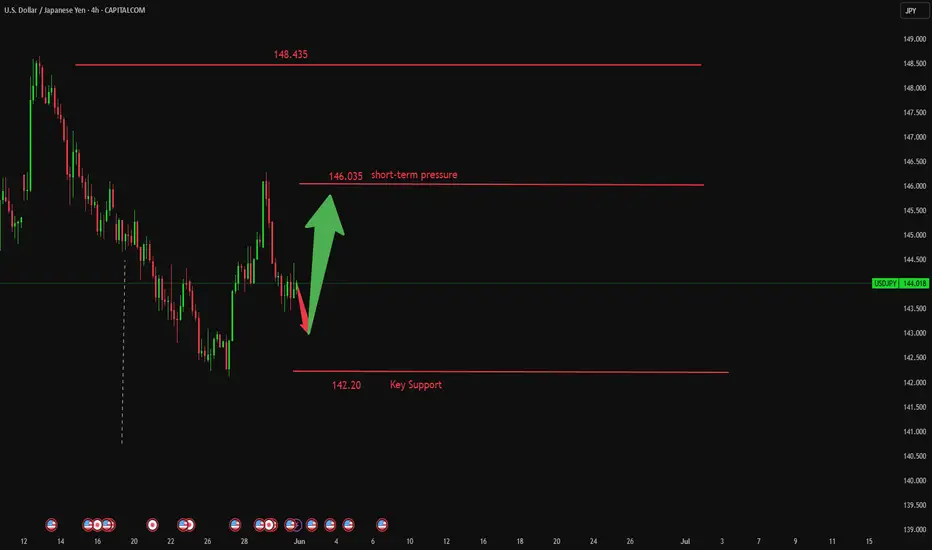
Is the 144 level becoming a key battleground for positioning?The USD/JPY exchange rate has staged a mild rebound for the second consecutive day, though it remained capped below the 144.00 level during the European session. Despite short-term signs of stabilization, the pair remains broadly pressured by a dual combination of fundamental expectations and technical resistance. Persistently constrained by selling pressure above 144.00 and failing to achieve a volume-supported breakout, the exchange rate is expected to continue trading within a range-bound consolidation between 142.00 and 144.80. Focus remains on the multi-empty battles in the 143.40 and 142.30 zones.
Humans need to breathe, and perfect trading is like breathing—maintaining flexibility without needing to trade every market swing. The secret to profitable trading lies in implementing simple rules: repeating simple tasks consistently and enforcing them strictly over the long term.
Usdjpylong


USDJPY I Trading Plan and Forecast Welcome back! Let me know your thoughts in the comments!
** USDJPY Analysis - Listen to video!
We recommend that you keep this pair on your watchlist and enter when the entry criteria of your strategy is met.
Please support this idea with a LIKE and COMMENT if you find it useful and Click "Follow" on our profile if you'd like these trade ideas delivered straight to your email in the future.
Thanks for your continued support!Welcome back! Let me know your thoughts in the comments!

A rebound is inevitable. Execute!During the European session, the USD/JPY price trended lower overall, with prices gradually declining from higher levels, indicating that bearish forces remained dominant. The pair started its downward movement from near 144.049 and continued to move lower. Notably, the USD/JPY exchange rate faced resistance at the 146.00 psychological level and is currently moving toward the support zone at 142.35. If prices reach this area, buyers are expected to enter the market after setting clear risk parameters below the support level, preparing for a potential rebound toward the 148.00 resistance level. On the flip side, sellers will look for prices to break below this level to increase bearish bets, with a further downside target set at the 140.00 threshold.
Humans need to breathe, and perfect trading is like breathing—maintaining flexibility without needing to trade every market swing. The secret to profitable trading lies in implementing simple rules: repeating simple tasks consistently and enforcing them strictly over the long term.
Trading Strategy:
buy@142.20-142.50
TP:145.50-146.00

USD/JPY) bullish choch Analysis Read The ChaptianSMC trading point update
Technical analysis of USD/JPY presents a bullish outlook with Smart Money Concepts (SMC)-based logic. Here's a breakdown of the idea and key elements:
---
Chart Summary
Current Market Context
Price: ~144.05
EMA 200: Acting as dynamic resistance at 144.19
Trendline: Broken, signaling a potential shift in market structure
Change of Character (ChoCh): Confirmed around 143.3, marking a bullish transition
---
Key Zones Identified
1. Support Level (Strong Demand Zone)
Around 141.8–142.5
Marked by historical rejections
Possible mitigation of unfilled orders here
2. Fair Value Gap (FVG)
Between 143.0–143.8
Price may return to fill this imbalance before rising
---
Projected Move
Price is expected to:
1. Dip into the FVG or Support Zone to mitigate imbalance
2. Reverse and make a bullish rally
3. Reach the target point near 148.68 (approx. +4.55%)
---
RSI Analysis (14-period)
Current RSI: ~49 (neutral)
No overbought/oversold condition
Room for upside momentum
---
Notable Features
Break of structure (ChoCh) → Bullish signal
EMA crossover potential → Bullish confluence
Multiple FVG fills + support reaction → Entry confirmation opportunities
Economic events marked → Be cautious of volatility spikes
Mr SMC Trading point
---
Trading Idea Summary
Buy Entry Zone: 141.8–143.0 (support or FVG)
Stop Loss: Below 141.5
Target: 148.68
Risk/Reward: Favorable (approx. 1:3+)
Pales support boost 🚀 analysis follow)

USD/JPY) Bullish reversal analysis Read The ChaptianMr SMC Trading point update
Technical analysis for the USD/JPY (U.S. Dollar / Japanese Yen) on the 4-hour timeframe. Here's a detailed breakdown of the idea and strategy:
---
Key Components of the Chart:
1. Strong Support Zone:
The yellow zone is labeled as a “big support level of pullback”, around the 142.00 – 141.20 range.
Price has historically bounced from this zone, suggesting demand and buyer interest.
2. Bullish Structure Setup:
Price is forming a double bottom or potential reversal pattern in the support zone.
A downtrend line is clearly marked, and a break above this trendline would signal bullish continuation.
3. EMA 200 (at 145.020):
The EMA is currently acting as dynamic resistance.
A breakout above the EMA would confirm further bullish momentum.
4. RSI Indicator:
RSI is currently below 30, indicating the market is oversold – a common precursor to a bullish reversal.
5. Target Levels:
Target 1: 145.803 – likely the first resistance level or EMA retest.
Target 2: 148.587 – a prior high and strong resistance area.
6. Projection:
Price is expected to bounce from support, break the trendline, retest, and then rally to higher levels.
---
Trade Idea Summary:
Bias: Bullish
Entry Zone: Near 142.00 – 141.20 (support zone)
Confirmation: Break above the descending trendline + bullish RSI divergence
Targets:
TP1: 145.803
TP2: 148.587
Invalidation: Break and close below 141.00 (support zone broken)
Mr SMC Trading point
---
Risk Management Suggestion:
Use a tight stop-loss below the support zone, considering it's the key reversal area. Also, keep an eye on fundamental factors such as U.S. and Japan interest rate decisions or key economic events (indicated by the icons on the chart).
Pales support boost 🚀 analysis follow)

Is a new round of decline impending?
The latest prices of USD/JPY are fluctuating around the range of 1.43922 to 1.44275, with an average price of 1.43917. The earlier pullback from higher levels indicates some downward pressure. On the upside, the pair may encounter resistance near the 144.20 level, with the next key resistance at around 144.50 and the first major resistance at 145.00. A close above the 145.00 level could lay the foundation for further gains.
Under the above scenario, the pair may even break through the 146.00 resistance level, with the next major target for bulls near the 147.80 resistance level.
Humans need to breathe, and perfect trading is like breathing—maintaining flexibility without needing to trade every market swing. The secret to profitable trading lies in implementing simple rules: repeating simple tasks consistently and enforcing them strictly over the long term.
USDJPY starting bullish move?Hello traders, this is a complete multiple timeframe analysis of this pair. We see could find significant trading opportunities as per analysis upon price action confirmation we may take this trade. Smash the like button if you find value in this analysis and drop a comment if you have any questions or let me know which pair to cover in my next analysis.

USDJPY 4H Analysis – Market Dynamics ChangingDear Traders,
Guys, the bearish trend in USDJPY has now shifted into a bullish uptrend. My target level for USDJPY is 146.330. Once it reaches my target, I will share updates under this post.
Friends, every single like from you is my biggest source of motivation when it comes to sharing my analysis.
A huge thank you to everyone who supports me with their likes!

Bullish USDJPY The video is self-explanatory.
UJ failing to break a strong weekly and daily support zone, which increases the probability of a bullish trend for the next days or weeks.

LONG ON USD/JPYUJ has given a choc (change or character) at a major demand zone.
JPY index structure is currently bearish.
I will buying UJ to the next swing high looking to catch 100-200 pips

USD/JPY 1H Analysis – Channel Breakout and Buy SignalOverview:**
The USD/JPY chart shows a **bullish breakout from a descending channel**, supported by technical indicators like the Ichimoku Cloud and a strong demand zone. This setup suggests a potential bullish reversal and upward momentum.
*Key Technical Points:**
* **Descending Channel Breakout:**
Price action has broken out of a falling channel, indicating a shift in market sentiment from bearish to bullish.
* **Strong Support Zone:**
Around 143.28 – 143.73, the price found significant support, which aligns with a previous demand zone. This area held firm, helping trigger the breakout.
* **Ichimoku Cloud:**
Price is emerging above the Ichimoku Cloud, signaling a potential start of an uptrend. If the price maintains above the cloud, bullish momentum may strengthen.
* **Resistance Levels:**
* **First Resistance:** Near 146.00 – a critical area to watch for short-term profit-taking.
* **Second Resistance:** Around 148.00 – a more extended target if bullish continuation holds.
---
### **Trading Idea:**
**BUY USD/JPY** on successful retest of the breakout or sustained move above the Ichimoku Cloud.
* **Entry:** 144.30–144.40 zone
* **Target 1:** 146.00
* **Target 2:** 148.00
* **Stop Loss:** Below 143.20 (under the support zone)
---
Conclusion:**
The chart presents a classic **bullish channel breakout** supported by the Ichimoku indicator and price action at a strong support zone. As long as the price holds above the breakout level and Ichimoku Cloud, the upside targets at 146 and 148 remain valid.
Let me know if you want this formatted as a trade plan or journal entry.
To ensure you do not miss the upcoming analysis, be sure to follow me!
Please leave a remark and a like!

Bullish Reversal on Risk-On Shift and Channel BreakoutCMCMARKETS:USDJPY USD/JPY surged as risk appetite returned after a U.S. federal court blocked President Trump's "Liberation Day" tariffs, undermining demand for safe-haven assets like the yen. Meanwhile, weak demand in Japan’s 40-year bond auction raised concerns over fiscal stability, adding further downside pressure to JPY. Technically, the pair broke above a downward channel and formed a bullish engulfing pattern near the 144.90 demand zone. If price consolidates above 145.00, a test of the 148.15 resistance zone is possible. Traders now eye upcoming U.S. GDP and PCE inflation data for direction on Fed policy.
Resistance : 148.14 , 148.67
Support : 144.90 , 144.42

USDJPY Bullish Signal | Technical + Custom AlgoSmart Trend Signal | Technical Analysis + Custom Algorithm
This signal is the result of a combination of classic technical trend analysis and a proprietary software I personally developed.

USDJPY: 300+ Pips From Previous Idea, What Hold Next? Hey Everyone
USDJPY is on a roll! It’s rebounded a whopping 300+ pips and is now on the positive side. We reckon it’s going to keep climbing in the coming days as DXY is starting to regain its strength.
And here’s the cherry on top: there’s some exciting news coming up, including the NFP tomorrow. This could really boost the USDJPY to a new record high.
But remember, when trading, it’s crucial to manage your risk carefully.
Now, let’s talk about the potential for a significant market movement. We’ve spotted a chance for a substantial bullish swing that could reach around 2050 pips. We’ve also identified three potential targets, so you can choose the one that best fits your analysis.
The main driver behind this move is the reversal of the Japanese Yen (JPY) from a bullish trend to a bearish one. So, let’s be cautious and use precise risk management techniques during this period.
Good luck and happy trading! 😊
Oh, and if you’d like to help us out, here are a few things you can do:
- Like our ideas
- Comment on our ideas
- Share our ideas
Thanks a bunch for your support! 😊
Cheers,
The Setupsfx_ Team

USDJPY Analysis – Yield Support Signals Potential UpsideUSDJPY is currently sitting at a key support zone around 142.80–143.00, showing signs of a potential bullish reversal. This support area has previously acted as a strong launchpad for price rallies.
🟢 Technical Setup:
Price action has formed a clean higher low structure, bouncing off horizontal support.
The US10Y Treasury Yield (pink line) has rebounded sharply and is diverging to the upside — a leading indicator for USDJPY strength.
The Fib retracement from the last swing move aligns well with the 0% zone, suggesting the dip might be complete.
A bullish reaction from here targets the 148.50 zone, with intermediate resistance around 145.00–146.00.
🟠 Risk Levels:
Invalidated below 141.40 (structure break).
Stops could be placed below 142.00, targeting a 2:1 or better risk-reward ratio.
🔍 Macro-Fundamental Insight:
U.S. Yields are firming despite mixed Fed signals — this gives strength to USD, especially against low-yielders like the JPY.
BOJ remains dovish with no urgency to normalize rates, keeping the yen weak.
With risk appetite improving and bond yields lifting, carry trade dynamics favor USDJPY upside.
✅ Conclusion:
As long as US10Y yields remain firm and USD holds above 142.00, USDJPY has a strong probability of rallying toward 148.50. Look for confirmation with higher highs on the 4H chart and continued divergence between yield and price.

USD/JPY "The Gopher" Forex Bank Bullish Heist Plan (Swing Trade)🌟Hi! Hola! Ola! Bonjour! Hallo! Marhaba!🌟
Dear Money Makers & Robbers, 🤑 💰💸✈️
Based on 🔥Thief Trading style technical and fundamental analysis🔥, here is our master plan to heist the USD/JPY "The Gopher" Forex Market. Please adhere to the strategy I've outlined in the chart, which emphasizes long entry. Our aim is to escape near the high-risk Yellow MA Zone. Risky level, overbought market, consolidation, trend reversal, trap at the level where traders and bearish robbers are stronger. 🏆💸"Take profit and treat yourself, traders. You deserve it!💪🏆🎉
Entry 📈 : The vault is wide open! Swipe the Bullish loot at any price - the heist is on!
Place buy limit orders most recent or swing, low level for Pullback entries.
Stop Loss 🛑:
📍 Thief SL placed at the recent/swing low level Using the 4H timeframe (138.500) Day/Swing trade basis.
📍 SL is based on your risk of the trade, lot size and how many multiple orders you have to take.
🏴☠️Target 🎯: 147.500 (or) Escape Before the Target
🧲Scalpers, take note 👀 : only scalp on the Long side. If you have a lot of money, you can go straight away; if not, you can join swing traders and carry out the robbery plan. Use trailing SL to safeguard your money 💰.
💰💵💸USD/JPY "The Ninja" Forex Money Heist Plan is currently experiencing a bullishness,., driven by several key factors. .☝☝☝
📰🗞️Get & Read the Fundamental, Macro, COT Report, Quantitative Analysis, Sentimental Outlook, Intermarket Analysis, Future trend targets & Overall Score... go ahead to check 👉👉👉🔗🔗🌎🌏🗺
⚠️Trading Alert : News Releases and Position Management 📰 🗞️ 🚫🚏
As a reminder, news releases can have a significant impact on market prices and volatility. To minimize potential losses and protect your running positions,
we recommend the following:
Avoid taking new trades during news releases
Use trailing stop-loss orders to protect your running positions and lock in profits
💖Supporting our robbery plan 💥Hit the Boost Button💥 will enable us to effortlessly make and steal money 💰💵. Boost the strength of our robbery team. Every day in this market make money with ease by using the Thief Trading Style.🏆💪🤝❤️🎉🚀
I'll see you soon with another heist plan, so stay tuned 🤑🐱👤🤗🤩

USD/JPY "The Ninja" Forex Bank Money Heist (Bullish)🌟Hi! Hola! Ola! Bonjour! Hallo! Marhaba!🌟
Dear Money Makers & Robbers, 🤑 💰💸✈️
Based on 🔥Thief Trading style technical and fundamental analysis🔥, here is our master plan to heist the USD/JPY "The Ninja" Forex Market Heist. Please adhere to the strategy I've outlined in the chart, which emphasizes long entry. Our aim is to escape near the high-risk YELLOW MA Zone. It's a Risky level, overbought market, consolidation, trend reversal, trap at the level where traders and bearish robbers are stronger. 🏆💸"Take profit and treat yourself, traders. You deserve it!💪🏆🎉
Entry 📈 : "The vault is wide open! Swipe the Bullish loot at any price - the heist is on!
however I advise to Place buy limit orders within a 15 or 30 minute timeframe most recent or swing, low or high level. I Highly recommended you to put alert in your chart.
Stop Loss 🛑:
Thief SL placed at the Nearest / Swing low level Using the 1H timeframe (143.000) Day trade basis.
SL is based on your risk of the trade, lot size and how many multiple orders you have to take.
🏴☠️Target 🎯: 147.000
💰💵💸USD/JPY "The Ninja" Forex Money Heist Plan is currently experiencing a bullishness,., driven by several key factors. .☝☝☝
📰🗞️Get & Read the Fundamental, Macro, COT Report, Quantitative Analysis, Sentimental Outlook, Intermarket Analysis, Future trend targets.... go ahead to check 👉👉👉🔗🔗🌎🌏🗺
⚠️Trading Alert : News Releases and Position Management 📰🗞️🚫🚏
As a reminder, news releases can have a significant impact on market prices and volatility. To minimize potential losses and protect your running positions,
we recommend the following:
Avoid taking new trades during news releases
Use trailing stop-loss orders to protect your running positions and lock in profits
💖Supporting our robbery plan 💥Hit the Boost Button💥 will enable us to effortlessly make and steal money 💰💵. Boost the strength of our robbery team. Every day in this market make money with ease by using the Thief Trading Style.🏆💪🤝❤️🎉🚀
I'll see you soon with another heist plan, so stay tuned 🤑🐱👤🤗🤩

(BTC/USD) Short Trade Setup – Bearish Reversal from Resistance 1. Entry Point: 111,516.84
2. Stop Loss: 112,858.08
3. EA Target Point (Take Profit): 106,068.04
4. Resistance Point: ~110,563 (currently being tested)
Trade Setup Summary:
Type: Short position
Risk (Stop LOss - Entry): 112,858.08 - 111,516.84 = 1,341.24
Reward (Entry - Target): 111,516.84 - 106,068.04 = 5,448.80
Risk/Reward Ratio: Roughly 1:4, which is favorable.
Technical Indicators:
The chart shows:
Moving Averages: A red (shorter) and blue (longer) MA, suggesting recent bullish momentum.
Price Action: Consolidation near the resistance after an uptrend; current candle appears bearish and breaking the support.
Interpretation:
This is a bearish reversal setup.
If the price breaks the support around 110,563 convincingly, it may confirm a move downward.
The stop loss is placed safely above recent highs to avoid getting caught in short-term volatility.
The target is significantly lower, around previous support levels, implying a strong move down is anticipated.
Risk:
This strategy banks on a clear breakdown. If the support holds, price may reverse upward, hitting the stop loss.

USDJPY- IS it a beginning of major bulish trend nowthe USD/JPY pair is currently in a major bullish trend, driven by several key factors:
1. Interest Rate Differentials: The U.S. Federal Reserve maintains higher interest rates compared to the Bank of Japan, attracting capital flows into the U.S. dollar and away from the yen.
2. Dovish Bank of Japan: Despite global tightening, the BOJ remains cautious about raising rates or ending yield curve control, weakening the yen further.
3. Robust U.S. Economic Data: Strong economic indicators from the U.S. (such as inflation, jobs, and GDP growth) continue to support expectations of prolonged higher rates, boosting the dollar.
USDJPY BULLISH IDEA🧱 Key Observations
Order Block (OB) Marked (Demand Zone):
A clearly marked bullish order block (OB) zone is highlighted in pink around the 139.883 low.
This zone likely represents institutional buying interest.
It was the origin of a strong bullish move that broke prior structure.
Price Action:
After a series of higher highs and higher lows, price has retraced significantly.
It's approaching the order block area again, potentially for a retest or liquidity grab.
Heikin Ashi Candles:
Recent candles are bearish, showing momentum to the downside.
However, these candles typically lag in reversals, so price may soon shift if it hits the OB zone.
Projected Move:
A large blue upward arrow is drawn, suggesting an anticipated bullish reversal from the OB zone with a potential move back to 148.647 (recent high).
📊 Technical Implication
Bullish Bias if price holds within or just above the OB zone.
Watch for bullish reversal signals (engulfing patterns, divergence, or break of minor structure).
If price breaks below 139.883 decisively, the bullish setup may be invalidated.
📌 Strategy Idea (Not Financial Advice):
Entry Zone: 140.000–139.900 (inside OB)
Stop Loss: Below 139.800
Target: ~148.500
Risk/Reward: Favorable if OB holds

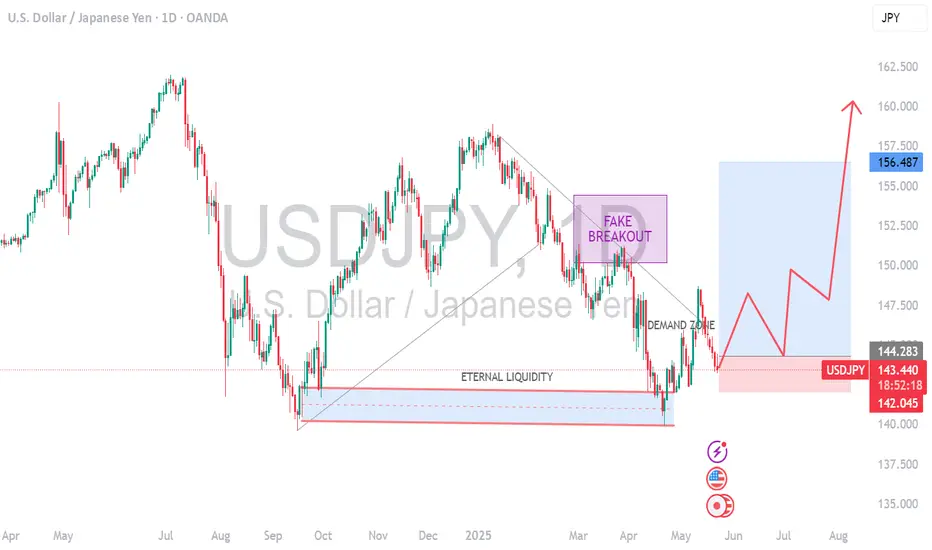
USDJPY:Is it a beginning of major bullish trend? Read CaptionThe price of USDJPY has shown a mixed volume, making it difficult to determine the trend. However, if we analyse the data, we can see that USD is gaining strength in the coming time. This could be due to the strong news coming in this week, which may divert the USDJPY towards the 150 price region. There are four potential targets that price could hit and surpass. Please use this analysis solely for educational purposes, as it does not provide any guarantees.
Good luck and trade safely.
Thanks for your support! 😊
If you’d like to help us out, here are a few things you can do:
- Like our ideas
- Comment on our ideas
- Share our ideas
Team Setupsfx_
❤️

USD/ JPY) bullish trend analysis Read The ChaptianSMC trading point update
Technical analysis of 4-hour for USD/JPY (U.S. Dollar vs Japanese Yen). Here's the breakdown of the idea
---
1. Bullish Structure
The market is moving within a rising channel, indicating a bullish trend.
Higher highs and higher lows support the uptrend.
---
2. Key Zones
Support Zone (Demand Area): Around the 144.500–145.000 level, price has reacted positively here multiple times — it's marked as a strong support level.
Resistance Zone: Around 148.000 — this level is marked as an obstacle before reaching the final target point.
---
3. Indicators & Confluence
EMA 200: Price is currently testing just above/below the EMA 200 — a key dynamic support/resistance level.
RSI: Showing a bullish divergence or a potential recovery from oversold zone (both RSI lines are turning upward).
MACD-style Oscillator (Custom): Showing signs of a bullish crossover, confirming upward momentum.
---
4. Projection & Target
The expected move is a bounce from support, followed by:
A retest of resistance around 148.
A continuation to the target zone at 150.864 — marked as the final target point.
The potential move is approximately +592 pips (4.19%).
Mr SMC Trading point
---
Conclusion
This is a bullish continuation setup, expecting price to maintain above the support zone and ride the trendline and channel toward 150.864. The confluence of RSI, structure, and EMA adds strength to the idea.
Pales support boost 🚀 analysis follow)
