USDJPY LONG FORECAST Q2 W16 D16 Y25USDJPY LONG FORECAST Q2 W16 D16 Y25
GM,
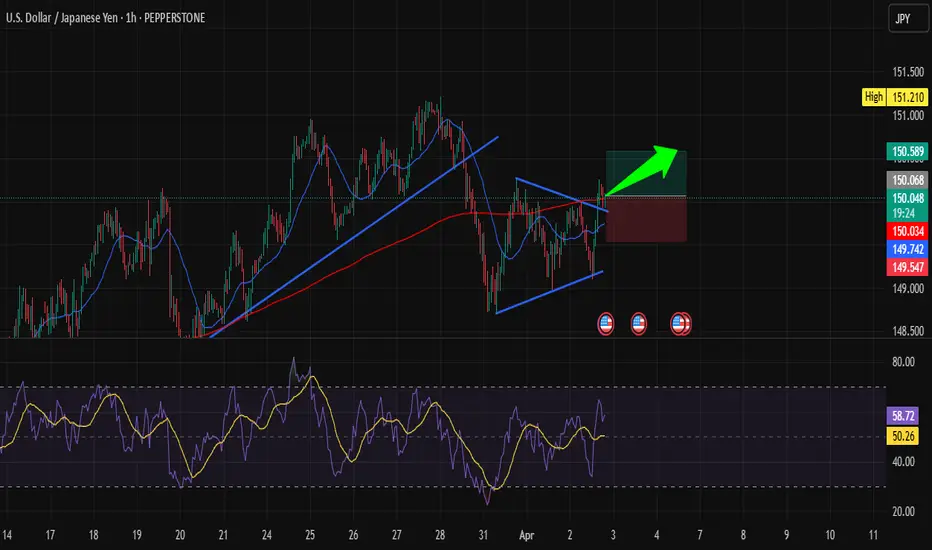
A potential long set up in addition to that of this morning!
FRGNT X
Usdjpylong

USDJPY LONG FORECAST Q2 W16 D16 Y25USDJPY LONG FORECAST Q2 W16 D16 Y25
Good morning all.
It may look like we are holding onto a bias. I can understand why that assumption is created. However, a short position is invalid for FRGNT whilst in a higher time frame order block long.
As per, that does not mean LONG blindly.
Two set ups illustrated.
1) 15' Break of structure
2) Lower time frame Break of structure without 15' break.
Trading is risky.
Both positions of course come with a side dish of risk and reason to loose. The question is, would you like to see USDJPY explode long without you?
Lets see how price actions plays.
FRGNT X

USD/CAD 1H Breaking Structure: The Start of a New Trend?Hi traders! Analyzing USD/CAD on the 1H timeframe, spotting a potential bullish reversal from a descending wedge pattern:
🔹 Entry: 1.38846
🔹 TP: 1.40286
🔹 SL: 1.37692
Price is bouncing off the lower boundary of a falling wedge, showing signs of bullish divergence with RSI also turning upwards. The breakout of the descending structure may signal a trend reversal or at least a corrective move to the upside.
The RSI is recovering from the oversold region, reinforcing the idea of a possible bullish push. A break and close above the minor resistance zone could confirm the move towards higher levels.
Watching closely for momentum confirmation!
⚠️ DISCLAIMER: This is not financial advice. Every trader must evaluate their own risk and strategy.

USDJPY LONG FORECAST Q2 W16 D14 Y25USDJPY LONG FORECAST Q2 W16 D14 Y25
We caught a the long play for a similar setup. We need more this time around.
Why? To be sure of the weekly order block rejection. Compared to EURUSD and EURGBP for example... That is the type of weekly order block rejection we prefer. With that said we will not give up on USDJPY. We simply must await more levels of confluences.
15' break of structure, Order block creation as a result of the BOS. Pull back into area, lower time frame break of structure.
Let's see what USDJPY provides us with.
FRGNT X

USDJPY LONG POSITION FORECAST UPDATE Q2 W15 D11 Y25USDJPY LONG POSITION FORECAST UPDATE Q2 W15 D11 Y25
Good Friday to you, Traders!
Take a look at this morning analysis!
As per the morning brief, we await the price action to come to us.
-Awaiting the weekly order block rejection. Aligning with rejection of the 4 hour order block.
-Await of break of structure on the 15'.
-Have it confirmed with a break of structure on a lower time frame. Be it the 5' or 1'.
FRGNT, is current risk off the position and look forward to banking fun coupons on Friday as per the plan.
Happy weekend.
See you Sunday for a breakdown of all pairs.
Until then.
FRGNT X

USDJPY LONG FORECAST Q2 W15 D11 Y25USDJPY LONG FORECAST Q2 W15 D11 Y25
Happy Friday Traders, It has been a week of sitting on capital. Being cautious, awaiting for breaks of structures at key areas and not not getting dragged into trades that do not fully present themselves. The clues have been there. The carrot has been continually dangled however as risk managers... You know how the saying goes.
We stay true to our trading plan.
We hold firm with what we know works.
We are aware of our market edge.
We know our "perfect" set up does present itself.
with that said, we are dynamic! We do of course entertain the "Imperfect" setup. We simply approach with caution.
USDJPY LONG FORECAST Q2 W15 D11 Y25
15' of course, bearish start to the Friday. Perhaps we are asking a lot from UJ today but let's see if we can break 15' structure before taking a deeper look.
Bigger picture, We are in a weekly order block in the long direction so all shorts are OFF until further notice.
Best of Luck Traders.
Continue to manager your capital.
FRGNT X

Explosive Rebound on USD/JPY? This Zone Has It ALL...Hi traders! Analyzing USD/JPY on the 1H timeframe, spotting a potential rebound within a descending channel:
🔹 Entry: 144.35
🔹 TP1: 145.59
🔹 TP2: 147.29
🔹 SL: 142.993
Price is currently testing the lower boundary of a well-structured descending channel — a zone that has held as dynamic support multiple times. The RSI is in oversold territory, suggesting the potential for a bullish correction.
If buyers defend this area again, we could see a strong bounce toward the midline and possibly the upper boundary of the channel. Wait for bullish confirmation (e.g., strong candle or volume spike) before entering.
⚠️ DISCLAIMER: This is not financial advice. Every trader must evaluate their own risk and strategy.

USDJPY UPDATESHello folks, this might be trend for next week.
see chart above, might make a new low?
This is only my view, we still have PPI tomorrow friday.
The idea is LONGS.
This is not a financial advice or trade signals.
Trade wisely base on your own understanding.
Good luck.
SEE you next week for new charts on new pair of shoes, joke. new pair of forex market or indices or crypto.
pewwpeww.
SEE the description not the chart, I totally base on my idea on weekly to this USDJPY.
are we going down?

USDJPY Bearish Flag Breakdown – Eyes on 140.11 Support ZoneUSDJPY is showing signs of a bearish continuation, following a breakdown from a rising wedge pattern. The recent strong drop confirms a shift in momentum from bullish to bearish, with price now forming a bear flag just below a key structure.
Key Technical Zones:
Current Price: 147.78
Resistance Area (Invalidation Zone): 148.11 – 151.44
Support Targets:
TP1: 142.87
TP2: 140.11
Technical Confluence & Patterns:
✅ Series of Rising Wedges followed by sharp breakdowns
✅ Bear Flag Pattern forming after recent drop
✅ Lower highs & lower lows confirming downtrend
✅ Volume spike during breakdown, low volume on pullback
Trade Outlook:
📉 Bias: Bearish below 148.11
📌 Entry Zone: On confirmation of flag breakdown
🎯 Target 1: 142.87 – Previous horizontal support
🎯 Target 2: 140.11 – Major swing support / demand zone
🛑 Invalidation: Break above 151.44 (major resistance zone)
Conclusion:
USDJPY is set up for a potential bearish continuation as it respects a textbook flag breakdown setup. A close below 147.50 would reinforce bearish pressure with further downside toward 142.87 and 140.11. Traders should monitor momentum and structure confirmation before entering positions.
Let me know if you want a short caption or video script version! 📉

#USDJPY:1351+ Bullish Move One Not To Miss| Three TPs| JPY has been bullish since the dollar strengthened, potentially leading to a trade war that would make the Japanese yen more valuable to global investors. However, we may see a strong correction on all XXXJPY pairs, potentially returning stronger with a major bullish correction. We’re not sure if the price will hit all three take profit zones, but we’re interested in how far it goes.
Use accurate risk management. This analysis is purely for educational purposes only. Use your own knowledge and analysis before taking any entries.
Team Setupsfx_

USD/JPY(20250409)Today's AnalysisMarket news:
The U.S. Customs and Border Protection Agency reiterated that the specific tax rates for each country will be announced at 12:01 a.m. on April 9.
Technical analysis:
Today's buying and selling boundaries:
146.77
Support and resistance levels
148.90
148.10
147.59
145.95
145.43
144.63
Trading strategy:
If the price breaks through 145.95, consider buying, the first target price is 146.77
If the price breaks through 145.43, consider selling, the first target price is 144.63

USD/JPY) Bullish reversal analysis Read The ChaptianSMC Trading point update
This chart is for USD/JPY on the 1-hour timeframe, and it presents a bullish trade setup. Let’s break down the idea
---
Key Observations:
1. Current Price:
USD/JPY is trading around 146.281.
2. Overall Bias:
Bullish setup expecting a bounce from demand into a higher target zone.
3. EMA 200:
Price is currently below the 200 EMA (147.942), which usually suggests a bearish trend — but this setup is aiming for a short-term bullish retracement.
4. Demand Zone (Buy Area):
Marked in yellow between 145.822 and slightly above.
Labeled as "FVG orders" (Fair Value Gap), suggesting institutional interest or imbalance fill.
5. Trendline Support:
The price is approaching a rising trendline, adding confluence for a potential bounce.
6. Expected Move:
Price is expected to bounce from the demand zone, form a higher low, and then move up toward the target zone at 148.221.
Two upside targets are drawn:
First Move: ~1.12% (30.6 pips)
Full Target: ~1.76% (256.1 pips)
Mr SMC Trading point
7. RSI (Relative Strength Index):
RSI is around 37.66, nearing oversold territory, supporting a bullish reversal idea.
---
Trade Idea Summary:
Bias: Bullish
Entry Zone: Around 145.822 (fair value gap & trendline support)
Target Zone: 148.221
Stop Loss: Likely just below the demand zone or trendline
Confluence Factors:
Trendline support
RSI nearing oversold
Fair value gap zone
EMA 200 overhead (target acts as resistance)
---
Pelas support boost 🚀 analysis follow

WHY EVERYTHING IS GOING DOWN? ANSWER IS HERE!Understanding the Simultaneous Decline in EVERYTHING!
1. The Influence of U.S. Treasury Yields and Interest Rates
The U.S. 10-year Treasury bond yield is a major benchmark in global finance. When yields rise, it signifies that bonds are becoming more attractive relative to riskier assets. Rising yields typically occur when:
Investor Demand Shifts: Investors move from risky assets (like equities or crypto) to safer, higher-yielding government bonds.
Inflation Expectations: Higher inflation expectations often lead investors to demand higher yields, which in turn increases borrowing costs.
Cause and Effect:
When Treasury yields increase, the opportunity cost of holding lower-yielding assets rises. This makes stocks, precious metals like gold, and speculative assets like cryptocurrencies less attractive. Even gold, typically seen as a safe haven, can lose its charm if fixed-income assets provide competitive returns with significantly lower risk.
2. M2 Money Supply Dynamics
The M2 money supply measures the total liquidity available in the economy, including cash, checking deposits, and easily convertible near-money assets. Changes in M2 can impact asset prices in several ways:
Expanding M2: More liquidity in the market initially can boost asset prices. However, if this expansion leads to rising inflation, it may eventually trigger higher interest rates and bond yields.
Contraction or Slowing Growth in M2: A tightening in liquidity can reduce the flow of money into various asset classes. This dampens overall market sentiment and makes riskier assets less attractive.
Cause and Effect:
If M2 growth slows or contracts, there is less capital to chase after higher returns in equities and crypto. At the same time, if there is an expectation of tightening monetary policy, investors recalibrate risk expectations, which leads to a broader sell-off across multiple asset classes.
3. Investor Sentiment and Risk-Off Behavior
In periods where both Treasury yields are rising and the money supply signals less liquidity, the overall investor sentiment often shifts toward a "risk-off" stance. This means:
Safe-Haven Demand: Investors move into safe assets like government bonds, which drives up bond prices and yields while pulling money out of riskier assets such as stocks, gold, and cryptocurrencies.
Correlation Effect: As riskier assets are sold off, their prices fall in tandem. Therefore, even if gold typically acts as a counterweight to stocks, in a severe risk-off environment, all asset classes might decline.
Cause and Effect:
With a risk-off sentiment dominating the market, traditional safe havens (like gold) and growth-oriented assets (stocks and crypto) can experience simultaneous declines. Rising yields encourage a rotation away from these riskier positions, which reinforces the downward trend across multiple markets.
4. Historical Context: The Trump Era and Beyond
During the Trump administration, we observed episodes where Treasury bond prices surged significantly (e.g., a 10% surge) as investors sought refuge during periods of political and economic uncertainty. Eventually, as market sentiment shifted, yields rose, and this led to higher borrowing costs. The resulting effect was a broad-based retreat in many asset classes.
Example: In those periods, as yields climbed to around 4%, investor appetite for risk diminished. The market corrected across equities, precious metals, and cryptocurrencies, with all asset classes experiencing pressure concurrently.
Cause and Effect:
In the current climate, if similar dynamics are at work—namely, rising yields accompanied by tightening M2 growth—then we might see a similar pattern: gold, the S&P 500, and crypto all experience declines together because investor risk appetite is sharply reduced.
Conclusion
The simultaneous decline in gold, the S&P 500, and cryptocurrencies can primarily be attributed to rising U.S. Treasury yields and tightening M2 money supply. As yields rise:
The relative attractiveness of low-risk government bonds improves, encouraging a shift in investment away from riskier assets.
Increased yields raise borrowing costs, which in turn dampens economic growth and investor sentiment.
Slowing liquidity (as measured by M2) further restricts the available capital chasing after higher returns.
This confluence of factors leads to a widespread "risk-off" environment where even traditional safe havens like gold may fall as the entire market adjusts to a higher interest rate and lower liquidity backdrop. Investors thus move across asset classes in a coordinated fashion, leading to declines in gold, equities, and crypto alike.
Understanding this cause-and-effect relationship is crucial for professional traders who rely on disciplined strategies. With a clear view of the broader economic signals, you can navigate these shifts with precision—helping you not only to avoid costly mistakes but also to capitalize on high-probability opportunities that emerge during these market transitions.

USD/JPY) bullish trend analysis Read The ChaptianSMC Trading point update
This chart is an analysis of the USD/JPY currency pair on a 2-hour timeframe, and it presents a possible bullish scenario. Here’s a breakdown of the idea:
---
Key Points of the Analysis:
1. Support Level & Change of Character (ChoCH):
Price found strong support around 144.556.
A ChoCH (Change of Character) is noted, indicating a potential shift from a bearish to a bullish trend.
2. Bullish Reversal Setup:
The price is forming higher lows, suggesting the start of a "New Up Trend".
There's a clear zig-zag bullish projection, suggesting potential long opportunities.
3. Target Zones:
The first target point is in the range of 149.692 – 150.493.
This area is also marked with a resistance zone, making it a logical TP (Take Profit) level.
4. Risk/Reward Ratio:
The risk is around -3.75% (-564.8 pips), and the reward is around +3.94% (+569.2 pips), suggesting a 1:1.05 R/R ratio.
5. RSI Indicator (Below):
RSI is showing a bullish divergence (price made lower lows while RSI made higher lows).
This divergence supports the idea of a possible bullish reversal.
6. 200 EMA:
The 200 EMA is at 148.767, acting as a dynamic resistance. Price may react around that level before hitting the final target zone.
Mr SMC Trading point
---
Conclusion:
This analysis suggests a potential long trade setup on USD/JPY based on:
A support zone,
Bullish RSI divergence,
Market structure shift (ChoCH),
And projected movement toward 149.692–150.493.
Idea: Buy near the support zone (~144.556) and target the resistance zone (~150.493) while managing risk carefully.
---
Pales support boost 🚀 analysis follow)

USD/JPY Bullish Reversal: Order Block & EMA 200 TargetSMC Trading point update
This chart presents a technical analysis of USD/JPY on the 1-hour timeframe. The key insights from this analysis are:
1. Order Block & Potential Reversal
The price has dropped significantly and reached a highlighted order block zone (a key demand area).
A potential inverse head and shoulders pattern is forming, indicating a possible bullish reversal.
2. Expected Bullish Movement
The price is expected to bounce from the order block, creating a bullish structure.
The projected move suggests a retracement toward a resistance zone, which aligns with previous price action.
Mr SMC Trading point
3. Target Zone & EMA 200
The target zone is around 148.946 - 149.178, aligning with the 200 EMA, a significant resistance level.
4. RSI Indicator
The RSI is currently low (~38.93), indicating potential for a reversal as the market may be oversold.
Conclusion
The chart suggests a bullish retracement after the recent drop, targeting the resistance zone near the 200 EMA. However, confirmation is needed (e.g., bullish price action, volume increase) before taking a trade. Keep an eye on fundamental news that may impact USD/JPY volatility.
Pales support boost 🚀 analysis follow)

USD/JPY Bullish Reversal Setup with 2.30% Upside PotentialThis is a USD/JPY 1-hour chart analysis, and it looks like a bullish setup is being anticipated. Here's a breakdown:
Key Observations:
1. Support Zone (Purple Box - Around 146.411 - 146.429):
Multiple bullish rejections (green arrows) indicate a strong support level.
Price bounced off this support recently, forming a potential double bottom.
2. EMA Levels:
50 EMA (Red Line) is currently at 146.411.
200 EMA (Blue Line) is at 148.499, acting as dynamic resistance.
Price has crossed above the 50 EMA, a bullish sign, and might aim for the 200 EMA next.
3. Projected Bullish Path:
The path drawn suggests a pullback to the support zone around 146.429, followed by a bullish continuation.
Target zone is marked around 150.032, showing a projected gain of 2.30% (337.2 pips).
4. Resistance Levels:
Minor resistance at the 200 EMA (~148.5).

USD/JPY Ready for Liftoff? Catch This Potential Rebound! Hi traders! , Analyzing USD/JPY on the 1H timeframe, spotting a potential long entry:
🔹 Entry: 145.44
🔹 TP: 146.78
🔹 SL: 144.115
USD/JPY has formed a consolidation zone after a sharp downtrend, indicating a potential bullish reversal. If buyers step in, we could see a move towards 146.78. RSI is recovering from oversold levels, supporting the upside scenario.
⚠️ DISCLAIMER: This is not financial advice. Every trader makes their own decision.

USD/JPY(20250403)Today's AnalysisMarket news:
US trade policy-① Trump signed an executive order to establish a 10% "minimum base tariff" for all countries, and will impose reciprocal tariffs, including 20% for the EU, 24% for Japan, 46% for Vietnam, and 25% for South Korea. The tariff exemption for goods that meet the USMCA will continue, and the tariff for those that do not meet the requirements will remain at 25%; ② The US Treasury Secretary called on countries not to retaliate; ③ The base tariff will take effect on April 5, and the reciprocal tariff will take effect on the 9th. In addition, the 25% automobile tariff will take effect on the 3rd, and the automobile parts tariff will take effect on May 3rd; ④ Gold bars, copper, pharmaceuticals, semiconductors and wood products are also not subject to "reciprocal tariffs".
Today's buying and selling boundaries:
149.61
Support and resistance levels
150.97
150.46
150.13
149.08
148.75
148.24
Trading strategy:
If the price breaks through 148.75, consider buying, the first target price is 149.08
If the price breaks through 148.24, consider selling, the first target price is 148.00

USD/JPY Ready to Take Off: Golden Opportunity on 1H!Hi traders! Analyzing USD/JPY on the 1H timeframe, spotting a potential entry:
🔹 Entry: 150.08
🔹 TP: 150.589
🔹 SL: 149.547
USD/JPY is breaking out of a bullish pennant pattern, suggesting a potential upward move. The RSI is holding above 50, indicating bullish momentum building up. If the price sustains above 150.08, we could see a push toward 150.589. Keep your eyes on price action and manage your risk!
⚠️ DISCLAIMER: This is not financial advice. Trade responsibly.
USDJPY DOWNWARDhello fellow traders, we wait for another down/retracements on this pair FX:USDJPY , but this is only my view, you can share yours if you have any idea.
1st target 148.6,
Long zone 145 . this idea base on my own understanding, on my other pairs that posted, still valid folks. GU, GJ, XAU. are we all connected?
this is not a financial advice,
follow for more swing trades. swing it....

USD/JPY "The Ninja" Forex Bank Heist Plan (Day / Scalping Trade)🌟Hi! Hola! Ola! Bonjour! Hallo! Marhaba!🌟
Dear Money Makers & Robbers, 🤑 💰💸✈️
Based on 🔥Thief Trading style technical and fundamental analysis🔥, here is our master plan to heist the USD/JPY "The Ninja" Forex Bank . Please adhere to the strategy I've outlined in the chart, which emphasizes long entry. Our aim is the high-risk Red Zone. Risky level, overbought market, consolidation, trend reversal, trap at the level where traders and bearish robbers are stronger. 🏆💸"Take profit and treat yourself, traders. You deserve it!💪🏆🎉
Entry 📈 : "The vault is wide open! Swipe the Bullish loot at any price - the heist is on!
however I advise to Place buy limit orders within a 15 or 30 minute timeframe most recent or swing, low or high level.
Stop Loss 🛑:
Thief SL placed at the recent/swing low level Using the 1H timeframe (148.600) Day / scalping trade basis.
SL is based on your risk of the trade, lot size and how many multiple orders you have to take.
🏴☠️Target 🎯: 152.400 (or) Escape Before the Target
🧲Scalpers, take note 👀 : only scalp on the Long side. If you have a lot of money, you can go straight away; if not, you can join swing traders and carry out the robbery plan. Use trailing SL to safeguard your money 💰.
USD/JPY "The Ninja" Forex Bank Heist Plan (Day/Scalping Trade) is currently experiencing a bullishness,., driven by several key factors.
📰🗞️Get & Read the Fundamental, Macro, COT Report, Quantitative Analysis, Sentimental Outlook, Intermarket Analysis, Future trend targets.. go ahead to check 👉👉👉🔗
⚠️Trading Alert : News Releases and Position Management 📰 🗞️ 🚫🚏
As a reminder, news releases can have a significant impact on market prices and volatility. To minimize potential losses and protect your running positions,
we recommend the following:
Avoid taking new trades during news releases
Use trailing stop-loss orders to protect your running positions and lock in profits
💖Supporting our robbery plan 💥Hit the Boost Button💥 will enable us to effortlessly make and steal money 💰💵. Boost the strength of our robbery team. Every day in this market make money with ease by using the Thief Trading Style.🏆💪🤝❤️🎉🚀
I'll see you soon with another heist plan, so stay tuned 🤑🐱👤🤗🤩

usdjpy road mapWeakly time frame we are in side way now, 90% of my trades was short this month, it is simple and clear.

USD/JPY(20250328)Today's AnalysisToday's buying and selling boundaries:
150.74
Support and resistance levels
151.83
151.42
151.16
150.32
150.06
149.66
Trading strategy:
If the price breaks through 151.16, consider buying, the first target price is 151.42
If the price breaks through 150.74, consider selling, the first target price is 150.32
