USDJPY Weakening or a Correction to the Uptrend✏️ OANDA:USDJPY is approaching the old Break out support zone. The convergence zone of the 2 EMA lines. If there is a sweep to the support zone at the beginning of the week, it will be an opportunity to buy to continue the bullish wave structure. When this 146.200 zone is broken, the uptrend will be broken and we have to wait for new momentum to determine the next trend.
📉 Key Levels
Support: 146.200-143.200
Resistance: 150.800-154.500
Buy zone 146.300 (Support & Trendline)
Buy zone 143.200 Strong support zone
Target 154.500
Leave your comments on the idea. I am happy to read your views.
Usdjpylongsetup

USD/JPY Robbery Route | Enter at Dip, Exit Before Police💥USD/JPY Forex Money Heist Plan 🎯 — Ninja Robbery at 146.000💥
🌟 Hi! Hola! Ola! Bonjour! Hallo! Marhaba! 🌟
Dear Market Bandits, Money Makers & Risky Robbers 🤑💰💸✈️
Welcome to another Thief Trader-style operation. We've cracked open the USD/JPY vault (aka "The Gopher" 💹), and here's the blueprint to pull off this forex heist like true professionals. 💼🎭💵
🚨 Strategy Overview
This isn't just a trade – it’s a well-researched, precision-timed robbery mission based on technicals, macro analysis, sentiment, and the bigger global picture.
Expect action near critical zones – especially the moving average barricade, where police (aka risk) is waiting. Stay sharp.
🔓 Entry Point – Unlock the Vault
📈 Watch for bullish pullbacks near 146.000.
Whether it's a dip, zone test, or wick bounce — you’re looking to layer buy limit orders like a seasoned thief using DCA tactics.
Enter on swings or any bullish confirmation.
Heist Window is Open.
🛑 Stop Loss – Escape Route
📍 SL near 143.000 (1D swing low) — adjust based on your capital and position size.
💡 Don’t go blind — SL is your backup plan, not an optional accessory.
Custom-fit it based on how many entries you’re stacking.
🎯 Target – Vault Exit Point
🏁 151.000 or exit before resistance heat catches on.
No greedy thieves here — precision exit is key.
Lock profits, vanish in style. 🕶️💼💸
🧲 Scalpers Take Note
Only long side raids are valid. Scalping against the trend? That's walking into a trap.
Use trailing SLs and protect your loot.
Small bag or big vault — play your game smart. 🎯💰
📢 Fundamental Boosters
USD/JPY’s bullish run isn’t random — it’s backed by:
📊 Macro shifts,
📈 COT reports,
🧠 Sentiment drivers,
📉 Intermarket trends,
And a whole mix of thief-level intel 🔍
🧭 Dive deeper before acting. The map’s been provided. 🔗🌍
🗞 News Traps Ahead – Move Cautiously
🚫 Avoid new trades during major releases
🔁 Use trailing SLs on open positions
💡 Position management is a thief’s best defense. Risk management keeps you in the game. 🎯🧠
🔥💖 Support the Heist Crew
Smash that ❤️🔥 Boost Button to keep our robbery engine running.
Each boost = strength for our crew.
💬 Share the love, spread the intel, and trade like a rogue with brains. 🤝💵
👀 Stay tuned for more high-profile FX heists from Thief Trader.
Until next time — loot wisely, vanish clean. 🐱👤💨

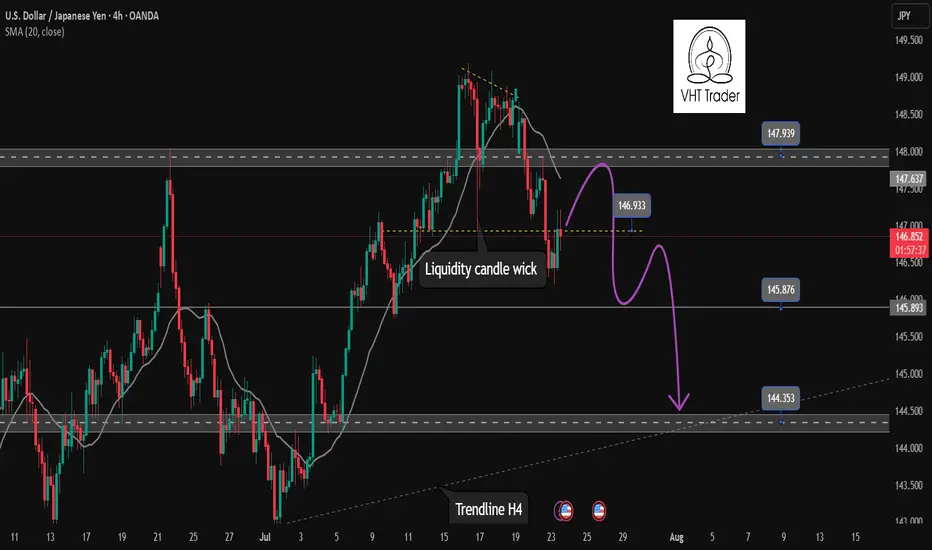
Continuation of downtrend. Waiting for confirmation SELL USDJPY✏️ OANDA:USDJPY is starting a corrective downtrend. Yesterday's New York session's selling pressure surpassed the buying liquidity zone around 147,000. This further confirms the possibility of the pair continuing its downward correction. Some recovery waves in today's Asia-Europe session are considered a good opportunity to SELL towards the target of 144,300 (trailline zone of the h4 frame). Pay attention to the important breakout price zone of 145,900.
📉 Key Levels
Support: 145,900-144,300
Resitance: 147,000-147,800
SELL trigger: Rejection from 147,000
SELL 147,700 (Strong resistance + SMA 20)
Target 144,400
SELL DCA: Break 145,900
Leave your comments on the idea. I am happy to read your views.
USD/JPY 4-Hour Forex Chart4-hour chart from FOREX.com displays the exchange rate between the U.S. Dollar (USD) and the Japanese Yen (JPY). The current rate is 147.446, with a slight increase of 0.072 (+0.05%). The chart shows recent price movements, including a notable drop within a highlighted support and resistance zone (light green and pink areas). Buy and sell prices are marked at 147.446 and 147.444, respectively, with additional price levels indicated on the right side ranging from 146.943 to 149.000. The chart includes candlestick patterns and is timestamped up to July 22, 2025.

U.S. Dollar / Japanese Yen - 4h Chart (FOREX.com)4-hour chart from FOREX.com shows the exchange rate between the U.S. Dollar (USD) and the Japanese Yen (JPY). The current rate is 148.184, reflecting a decrease of 0.623 (-0.42%) as of 01:29:16. The chart highlights recent price movements over the past few hours, with a shaded area indicating a consolidation phase around the current level.

#USDJPY: Price is currently accumulating ! Wait For DistributionAt present, the USDJPY currency pair appears to be in an accumulation phase, as evidenced by the absence of significant price movement throughout the current week. Several factors contribute to this trend.
Firstly, several significant economic events are scheduled for this week, particularly tomorrow and Friday. These developments hold substantial implications for the future trajectory of the USDJPY pair. Consequently, there exists a possibility that the price may experience a decline prior to initiating a bullish trend.
Secondly, there are two primary areas where the price could reverse its course. The extent to which the USD reacts to the economic data will serve as an indicator of the potential reversal zones.
It is imperative that you conduct your own analysis before making any financial decisions. This chart should be utilised solely for educational purposes and does not guarantee any specific outcome.
Regarding the stop loss, as this is a swing trade, it is advisable to employ a larger stop loss if the price reaches entry zones. The take profit level can be determined based on your entry type and analysis.
We wish you the best of luck in your trading endeavours and emphasise the importance of trading safely.
Kindly share this analysis with others through likes, comments, and social media platforms. If you have any questions or require further assistance, please do not hesitate to comment below. We are here to provide support.
Team Setupsfx_
❤️🚀
USD/JPY 4-Hour Chart Analysis4-hour chart displays the price movement of the U.S. Dollar against the Japanese Yen (USD/JPY) from June to August 2025. The chart shows a significant upward trend in July, followed by a correction. Key levels are highlighted, including support at 147.031 and resistance at 150.130, with the current price at 148.809. The chart suggests a potential bullish continuation, as indicated by the upward arrow and green box, targeting higher levels above 150.000.

USD/JPY 4-Hour Forex Chart4-hour performance of the U.S. Dollar (USD) against the Japanese Yen (JPY) from late June to mid-July 2025, sourced from FOREX.com. The current exchange rate is 147.436, with a 1.178 (+0.81%) increase. Key levels include a sell price of 147.393 and a buy price of 147.479. The chart shows a recent upward trend with a resistance zone highlighted between 147.436 and 148.092, and support around 146.598. Candlestick patterns indicate volatility, with notable price movements around early July.

USD/JPY) Bullish trend analysis Read The captionSMC trading point update
Technical analysis of USD/JPY on the 4-hour timeframe, signaling a breakout and possible rally toward the 151.016 target zone. Here's the detailed breakdown:
---
Technical Analysis – USD/JPY (4H)
1. Bullish Structure Breakout
Price has broken above a long-term resistance trendline, indicating a bullish breakout from a rising wedge or ascending channel.
The breakout is confirmed by bullish momentum and sustained price action above the previous highs.
2. Trendline + EMA Confluence
Price remains well above the 200 EMA (145.143), reinforcing the bullish bias.
A clear higher low was formed at the inner trendline (support), followed by strong upside moves.
3. RSI Strength
RSI is around 63.16, indicating strong bullish momentum without being overbought yet.
Suggests more upside potential while maintaining healthy trend conditions.
4. Price Target Projection
The chart shows two upward extensions:
First move projected ~+2.20%, indicating a measured move target around 149.7.
Final target point is 151.016, based on previous price action extension and resistance level.
Mr SMC Trading point
---
Summary
Bias: Bullish
Current Price: 147.366
Key Support: Rising trendline + 145.143 EMA
Targets:
Short-term: ~149.7
Final: 151.016
RSI: Strong but not overbought (63.16)
Invalidation: Break below the inner trendline support and EMA (below 145.00)
Please support boost 🚀 this analysis)

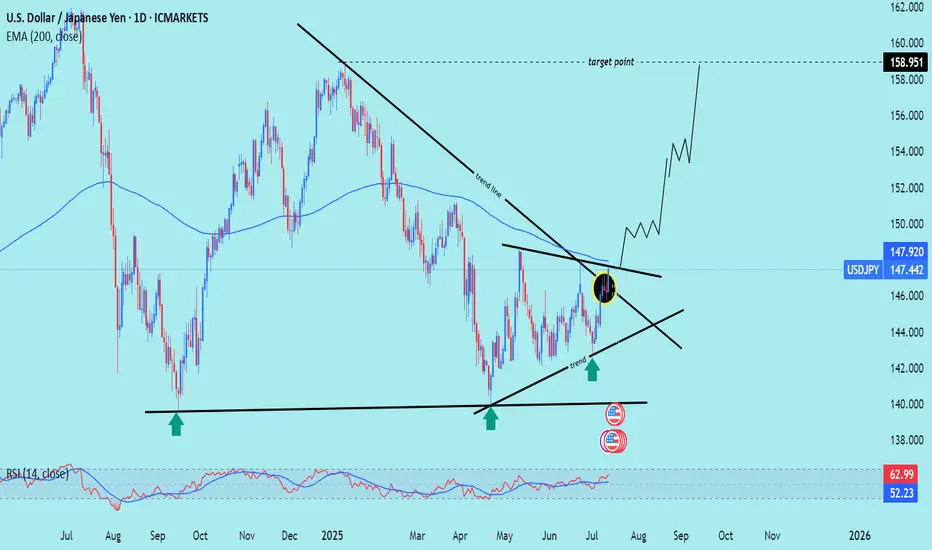
USD/JPY) LOGN TIME Analysis Read The captionSMC trading point update
Technical analysis of USD/JPY on the daily timeframe, highlighting a long-term downtrend reversal with potential for significant upside.
---
Analysis Summary
Pair: USD/JPY
Timeframe: Daily
Current Price: 147.442
Bias: Bullish breakout from a descending wedge structure.
---
Key Technical Insights
1. Descending Trendline Break:
Price has broken above the long-term downtrend line, signaling a reversal.
Breakout area is circled in yellow, confirming bullish intent.
2. Trendline & Structure Support:
Multiple rejections from the ascending support trendline (marked by green arrows) confirm accumulation and higher lows.
3. 200 EMA as Dynamic Resistance/Support:
Price is now above the 200 EMA (147.920) — a bullish signal, turning resistance into support.
4. RSI (14):
RSI at 62.99, approaching overbought territory, but still has room to push further.
---
Target Point
Target: 158.951
Based on measured move from wedge breakout and historical resistance level.
---
Trade Setup Idea
Direction Entry Stop-Loss Target
Buy 147.40–147.60 Below 145.80 158.95
Mr SMC Trading point
---
Summary
This chart signals a major bullish breakout on USD/JPY, with the break of a year-long downtrend structure, reclaiming the 200 EMA. If this breakout sustains, price could aim for 158.95 in the coming weeks.
Please support boost 🚀 this analysis)
USD/JPY "The Ninja Heist" – Bullish Loot Grab!🌟 Hey, Thieves & Market Bandits! 🌟
💰 Ready to raid the USD/JPY "The Gopher" vault? 💰
Based on 🔥Thief Trading Style🔥 (technical + fundamental heist analysis), here’s the master plan to swipe bullish profits before the market turns against us! Escape near the high-risk Yellow MA Zone—overbought, consolidation, and bear traps ahead! 💸 "Take the money and run—you’ve earned it!" 🏆🚀
🕵️♂️ Heist Strategy:
📈 Entry (Bullish Raid):
The vault’s unlocked! Buy any price—this heist is LIVE!
Pullback lovers: Set buy limits at recent/swing lows for extra loot.
🛑 Stop Loss (Escape Route):
Thief SL at recent/swing low (4H/Day trade basis).
Adjust based on your risk, lot size, and multiple orders.
🎯 Target (Profit Escape):
147.500 (or flee earlier if bears ambush!)
⚔️ Scalpers’ Quick Strike:
LONG ONLY! If rich, attack now. If not, join swing traders & rob slowly.
Trailing SL = Your bodyguard! 💰🔒
💥 Why This Heist?
USD/JPY "The Ninja" is bullish due to key factors—check:
📌 Fundamental + Macro + COT Report
📌 Quantitative + Sentiment + Intermarket Analysis
📌 Future Targets & Overall Score (Linkks In the profile!) 🔗🌍
🚨 Trading Alert (News = Danger!):
Avoid new trades during news—volatility kills!
Trailing SL saves profits on running positions.
💖 Support the Heist Team!
💥 Smash the Boost Button! 💥
Help us steal more money daily with Thief Trading Style! 🏆🚀
Stay tuned—another heist is coming soon! 🤑🎯

USD/JPY Profit Heist – Are You In or Missing Out?"🔥💰 "USD/JPY NINJA HEIST: Bullish Loot Before the Trap! (Thief Trading Style)" 💰🔥
🌟 Attention Market Robbers & Profit Takers! 🌟
🚨 Thief Trading Alert: USD/JPY "The Ninja" is primed for a BULLISH HEIST!
Based on our stealthy technical & fundamental analysis, we’re locking in a long entry strategy. The plan? Loot profits before the RED ZONE danger hits! Overbought? Maybe. Risky? Sure. But the real robbery happens before the bears wake up! 🏴☠️💸
🎯 ENTRY: The Vault is OPEN!
Buy Limit Orders: Swipe the dip on pullbacks or jump in at key swing lows.
Aggressive? Enter now & ride the wave!
🛑 STOP LOSS (Thief-Style Escape Plan):
Swing Low (5H TF): 143.600 (Adjust based on your risk & lot size!)
Multiple orders? Scale SL wisely—don’t get caught!
🎯 TARGETS:
Main Take-Profit: 151.000 (Or escape earlier if the trap triggers!)
Scalpers: Only play LONG—trail your SL & lock in quick loot!
📢 SCALPERS & SWING TRADERS:
Got deep pockets? Ride the wave now!
Small account? Join the swing heist & rob the trend slowly!
📈 WHY USD/JPY?
Bullish momentum + Macro/Fundamental tailwinds!
COT Report, Sentiment, & Intermarket Analysis all hint at more upside! go ahead to check 👉🔗🌏
⚠️ WARNING: NEWS = VOLATILITY!
Avoid new trades during high-impact news!
Trailing SL = Your best friend! Protect profits & avoid jail (stop-out)!
💥 BOOST THIS IDEA TO SUPPORT THE HEIST!
More boosts = More robberies = More profits for YOU!
Stay tuned—next heist coming soon! 🚀💰
🔥 Like, Share, & Follow for Daily Steals! 🔥

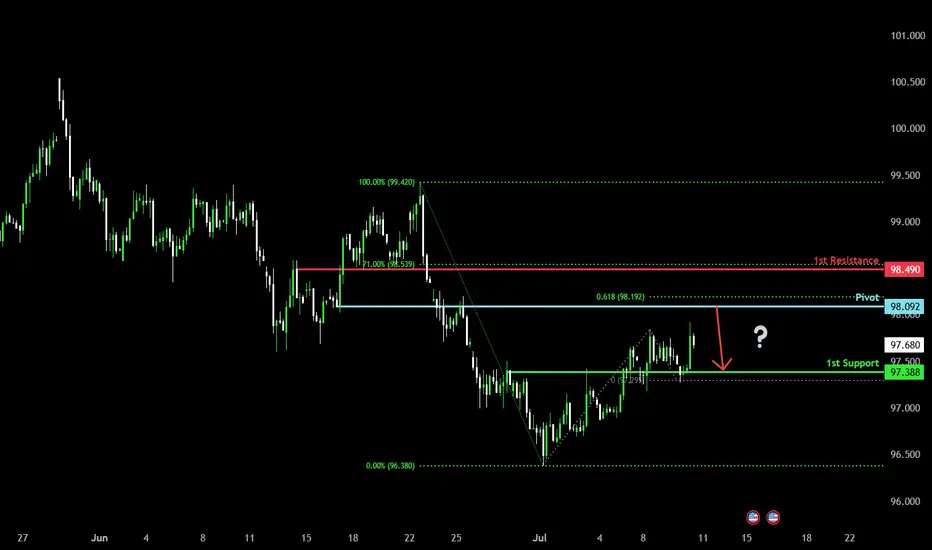
Could the price reverse from here?US Dollar Index (DXY) is rising towards the pivot and could reverse to the 1st support which acts as an overlap support.
Pivot: 98.09
1st Support: 97.38
1st Resistance: 98.49
Risk Warning:
Trading Forex and CFDs carries a high level of risk to your capital and you should only trade with money you can afford to lose. Trading Forex and CFDs may not be suitable for all investors, so please ensure that you fully understand the risks involved and seek independent advice if necessary.
Disclaimer:
The above opinions given constitute general market commentary, and do not constitute the opinion or advice of IC Markets or any form of personal or investment advice.
Any opinions, news, research, analyses, prices, other information, or links to third-party sites contained on this website are provided on an "as-is" basis, are intended only to be informative, is not an advice nor a recommendation, nor research, or a record of our trading prices, or an offer of, or solicitation for a transaction in any financial instrument and thus should not be treated as such. The information provided does not involve any specific investment objectives, financial situation and needs of any specific person who may receive it. Please be aware, that past performance is not a reliable indicator of future performance and/or results. Past Performance or Forward-looking scenarios based upon the reasonable beliefs of the third-party provider are not a guarantee of future performance. Actual results may differ materially from those anticipated in forward-looking or past performance statements. IC Markets makes no representation or warranty and assumes no liability as to the accuracy or completeness of the information provided, nor any loss arising from any investment based on a recommendation, forecast or any information supplied by any third-party.
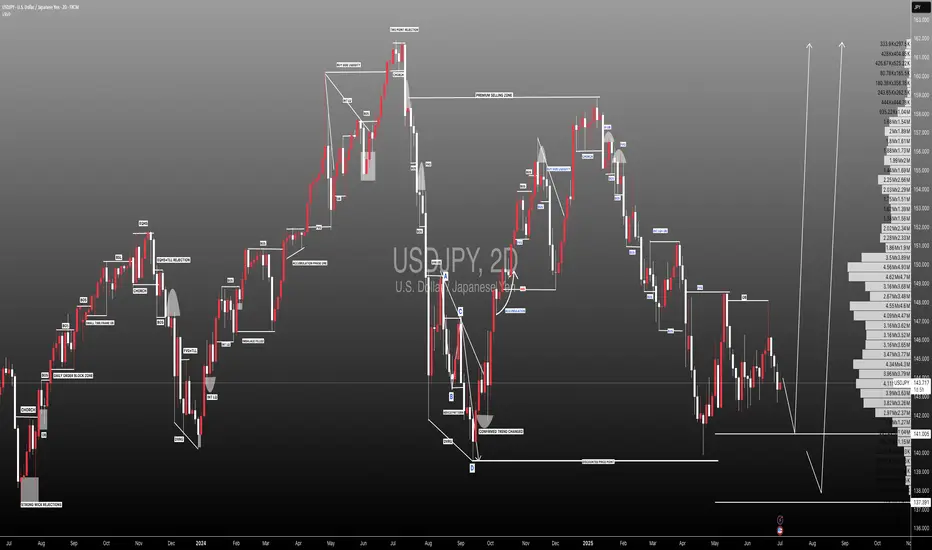
USDJPY Price Accumulated|Time For Bullish Distribution|Setupsfx|The price has accumulated nicely and is now distributing. We have three targets in mind, but set your own based on your analysis. Our approach is purely technical, but also includes a basic fundamental approach. This analysis concludes over 1500 pips and is a swing move. Please use this analysis as educational purposes only, as it does not guarantee that price will move exactly as predicted.
If you like our idea, please consider liking and commenting on it.
Good luck and trade safely!
Team Setupsfx_

USDJPY1. Inverted Head and Shoulders Pattern
This is a classic bullish reversal pattern.
You've marked the left shoulder, head, and right shoulder, and the neckline is broken to the upside.
Breakout confirms trend reversal from bearish to bullish.
2. Break of Trendline
A long-term bearish trendline was clearly broken.
Price broke above it with momentum, showing bullish strength.
3. Fib Confluence
Entry area is around the 61.8%–78.6% Fibonacci retracement zone.
Combined with support zone = high-probability reversal area.
4. Change of Character (CHoCH)
CHoCH confirms that the market has shifted structure from lower highs/lows to potential higher highs/lows.
You can see the higher low (HL) forming already.
5. Strong Bullish Candles
The breakout move is supported by strong bullish candles, showing buying pressure.
We're entering on a confirmed bullish reversal – Inverted Head & Shoulders breakout, trendline breach, and bullish market structure shift. Fib zone confluence seals the setup. Buy-side pressure is in control.

Unlocking the Bull Vault: USD/CAD Heist Setup🕵️♂️💼 The Loonie Vault Raid: USD/CAD Buy Blueprint 💰🔐
🌟Hi! Hola! Ola! Bonjour! Hallo! Marhaba!🌟
To All Currency Conquerors, Market Raiders & Profit Seekers 💸🚁🕶️
Welcome to another Thief Trading Style playbook, crafted for bold traders ready to infiltrate the Forex vaults with precision.
📜 Mission Brief – The Loonie USD/CAD Buy Op:
Using a blend of 🔥strategic market intel🔥 (technical + fundamental), we’re gearing up for a targeted buy operation. The goal? Extract max profits and vanish before the guards show up. 🏃♂️💨
🎯 ENTRY POINT – Authorized Access Only!
🎯 Buy Zone #1: Around 1.37000+
🎯 Buy Zone #2: Around 1.36400 (Caution: This is Market Maker Trap turf – approach wisely)
⏳ Wait for pullback signs & reversal confirmation before execution – The real pros enter when the crowd hesitates.
🛑 STOP LOSS – Backup Plan if Things Go South
🧠 Wise raiders always have an exit route!
🔹 SL Strategy 1: Nearest Swing Low on 2H timeframe (e.g., 1.36000)
🔹 SL Strategy 2: Institutional Buy Zone SL (1.34000 or deeper)
💡 Position sizing and risk tolerance are your call, but don’t skip this shield.
🏴☠️ TARGET – Where the Loot Lies
🎯 Aim for 1.39500 or exit early if the heat rises (volatility spike/consolidation stalls)
💼 Remember, the best thieves know when to grab the bag and bounce.
💹 Scalpers Advisory – Shortcuts to Riches
👀 Only ride the bullish tide.
💰 If you’ve got capital muscle, dive in. If not, roll with the swing crew.
📌 Trail that SL like a pro – don’t get caught slippin’.
📊 Why We Strike Now – The Big Picture
USD/CAD is showing bullish signs backed by:
✔️ Macro shifts
✔️ COT reports
✔️ Sentiment shift
✔️ Intermarket synergy
✔️ Smart money positioning
🔗 Full intel available – KlicK & explore!
⚠️ High Alert: News & Chaos Protocol
🚨 News drops = alarm bells.
To survive:
📌 Avoid fresh trades during major releases
📌 Use trailing SL to protect your gains
📌 Don’t overexpose – one vault at a time
💖 Support the Crew – Hit BOOST
Your boost helps fund the next mission. Show love, share strength, and become part of the Forex Heist Syndicate 🕵️♂️💵💼
One chart at a time, we rewrite the game.
🎯 Stay locked in – next mission drops soon... 🤑💻🚀

USD/JPY "The Ninja Heist" – Bullish Loot Grab!🌟 Hey, Thieves & Market Bandits! 🌟
💰 Ready to raid the USD/JPY "The Gopher" vault? 💰
Based on 🔥Thief Trading Style🔥 (technical + fundamental heist analysis), here’s the master plan to swipe bullish profits before the market turns against us! Escape near the high-risk Yellow MA Zone—overbought, consolidation, and bear traps ahead! 💸 "Take the money and run—you’ve earned it!" 🏆🚀
🕵️♂️ Heist Strategy:
📈 Entry (Bullish Raid):
The vault’s unlocked! Buy any price—this heist is LIVE!
Pullback lovers: Set buy limits at recent/swing lows for extra loot.
🛑 Stop Loss (Escape Route):
Thief SL at recent/swing low (4H/Day trade basis).
Adjust based on your risk, lot size, and multiple orders.
🎯 Target (Profit Escape):
148.700 (or flee earlier if bears ambush!)
⚔️ Scalpers’ Quick Strike:
LONG ONLY! If rich, attack now. If not, join swing traders & rob slowly.
Trailing SL = Your bodyguard! 💰🔒
💥 Why This Heist?
USD/JPY "The Ninja" is bullish due to key factors—check:
📌 Fundamental + Macro + COT Report
📌 Quantitative + Sentiment + Intermarket Analysis
📌 Future Targets & Overall Score (Linkks In the profile!) 🔗🌍
🚨 Trading Alert (News = Danger!):
Avoid new trades during news—volatility kills!
Trailing SL saves profits on running positions.
💖 Support the Heist Team!
💥 Smash the Boost Button! 💥
Help us steal more money daily with Thief Trading Style! 🏆🚀
Stay tuned—another heist is coming soon! 🤑🎯

USD/JPY Bullish Reversal AnalysisUSD/JPY Bullish Reversal Analysis 📈💹
🔍 Technical Overview:
The chart illustrates a strong bullish reversal pattern forming on USD/JPY after price reacted from a key support zone at 144.600. This level has held firm multiple times, marked by green arrows, signaling strong buying interest.
📐 Chart Patterns & Structure:
✅ A bullish harmonic pattern (possibly a bullish Bat or Gartley) is completing near the 144.600 zone.
🔄 Multiple rejection wicks and bullish engulfing patterns indicate a potential upside reversal.
🔵 Descending trendlines have been broken, confirming momentum shift.
🔁 Previous resistance turned support (near 145.000) is acting as a possible launchpad for the next move.
🎯 Upside Target:
The projected move targets the resistance zone at 147.698, aligning with previous highs and a significant supply area.
If price breaks above 145.900 convincingly, continuation toward this resistance is expected.
🔻 Downside Risk:
A break below 144.600 would invalidate the bullish setup and expose price to the lower support range near 142.000–143.000.
📊 Conclusion:
USD/JPY is showing signs of bullish reversal from a strong demand zone. If price sustains above 145.000 and breaks the minor consolidation, the pair could rally toward 147.698 🎯.
Bias: Bullish ✅
Support: 144.600
Resistance: 147.698

USD/JPY Bullish Reversal Trade Setup – Key Support Test at 145.2Entry Point: 145.273 (highlighted in blue)
Stop Loss: ~144.817–145.260 (purple zone)
Target Point (TP): 148.133 (upper resistance zone)
📉 Recent Price Action:
Price peaked near 148.05 before reversing sharply and breaking the trendline.
The market is currently testing the support zone (near the 145.273 entry level).
Moving averages (red = short-term, blue = long-term) show a crossover to the downside, suggesting short-term bearish momentum.
📈 Trade Setup:
Strategy Type: Long (Buy) Setup
Risk/Reward: Favorable, approximately 1:2+
Entry Zone: The current price is close to the entry level at 145.273, making this a timely area to watch for a bounce or confirmation.
⚠️ Risk Factors:
If price breaks below 144.817, the setup becomes invalid.
Short-term momentum is still bearish; confirmation (like a bullish engulfing candle or support hold) is important before entering.
✅ Confirmation Triggers for Entry:
Strong bullish candlestick pattern near entry zone.
RSI or MACD bullish divergence (not shown but useful to check).
Volume spike on bounce from support.

USD/JPY Long Trade Setup – Key Support Rebound Targeting 148.674Entry Point:
Price: 143.373
The chart suggests initiating a long (buy) position at this level, which is just slightly below the current market price.
Stop Loss:
Price: 141.707
Positioned below a strong support zone. This level protects the trade from excessive downside risk if the price breaks down.
Target Point:
Price: 148.674
The target is clearly defined, indicating a potential gain of approximately 5.991 points, or 4.20% from the entry.
🟪 Support/Resistance Zones
The purple boxes indicate demand (support) and supply (resistance) zones.
The lower zone (entry/stop area) shows a historically significant support range that has been tested multiple times (indicated with orange circles).
The upper purple zone marks the take-profit area, which coincides with previous resistance.
📊 Moving Averages
Blue Line: 200 EMA (Exponential Moving Average) – acting as dynamic resistance.
Red Line: 50 EMA – price is currently trading below it, indicating bearish short-term pressure but potential for reversal.
🧠 Trade Idea Summary
Bias: Bullish (long position)
Risk-Reward Ratio: Favorable
Risk: ~1.67 points (from 143.373 to 141.707)
Reward: ~5.3 points (from 143.373 to 148.674)
Approx. R:R = 1:3.17
Validation: The setup relies on the price holding the key support zone and bouncing higher, targeting the next major resistance.
⚠️ Considerations
Monitor for bullish candlestick patterns near the entry zone.
Keep an eye on macroeconomic news (like BoJ or Fed updates) that could cause volatility in USD/JPY.
Confirm momentum shift with RSI or MACD if using indicators.

USD/JPY Breaks Higher – Bullish Momentum Targets 148.40FX:USDJPY CMCMARKETS:USDJPY USD/JPY continues to climb, extending gains above the key 146.00 breakout level, supported by Fed–BoJ policy divergence and rising geopolitical tensions. Despite Japan’s strong CPI and PMI prints, the BoJ maintains a dovish tone, while tariff concerns continue to cap yen sentiment. The Middle East conflict further fuels demand for the USD as a safe haven.
Technically, the pair confirmed a bullish breakout, with price hugging the upper Bollinger Band – a sign of sustained upside pressure. As long as 146.00 holds, bulls may aim for the 148.40 monthly resistance.
Key Levels :
Resistance : 146.75 / 148.40
Support : 146.00 / 145.25
⚠️ Momentum favours the upside while above 146.00. Break below may trigger short-term pullback toward 145.25.

buy is coming on USDJPYThe USD/JPY pair recently experienced a bearish movement, which is largely influenced by heightened concerns surrounding the ongoing trade and tariff tensions between the U.S. and its global counterparts. This risk-off sentiment triggered a flight to safe-haven assets, weighing on the pair.
However, price action has now approached a key trendline support zone, which has held firmly in previous sessions. Technical indicators like RSI are also beginning to show signs of bullish divergence, suggesting a potential reversal. If this trendline continues to act as strong support, we may see a bullish bounce from the current level, aligning with the overall ascending trend structure but if the trade break these support zones, then the bearish movement might continues
for now we will be watching for confirmation signals such as bullish candlestick patterns or a break above near-term resistance levels to validate the upward movement.

Bearish reversal?US Dollar Index (DXY) has reacted off the pivot and could drop to the 1st support.
Pivot: 98.89
1st Support: 98.29
1st Resistance: 99.60
Risk Warning:
Trading Forex and CFDs carries a high level of risk to your capital and you should only trade with money you can afford to lose. Trading Forex and CFDs may not be suitable for all investors, so please ensure that you fully understand the risks involved and seek independent advice if necessary.
Disclaimer:
The above opinions given constitute general market commentary, and do not constitute the opinion or advice of IC Markets or any form of personal or investment advice.
Any opinions, news, research, analyses, prices, other information, or links to third-party sites contained on this website are provided on an "as-is" basis, are intended only to be informative, is not an advice nor a recommendation, nor research, or a record of our trading prices, or an offer of, or solicitation for a transaction in any financial instrument and thus should not be treated as such. The information provided does not involve any specific investment objectives, financial situation and needs of any specific person who may receive it. Please be aware, that past performance is not a reliable indicator of future performance and/or results. Past Performance or Forward-looking scenarios based upon the reasonable beliefs of the third-party provider are not a guarantee of future performance. Actual results may differ materially from those anticipated in forward-looking or past performance statements. IC Markets makes no representation or warranty and assumes no liability as to the accuracy or completeness of the information provided, nor any loss arising from any investment based on a recommendation, forecast or any information supplied by any third-party.
