USDJPYHey Everyone,
While many traders believe that UJ will reverse and drop significantly, but, what we think price will continue the bullish trend as it is very unlikely that JPY will gain its strength back. UJ will at least move up 500+ pips before it may drop significantly. For this year, USDJPY remain too bullish in our opinion.
what do you all think about it?
Usdjpylongsetup

Bullishness on USD pairs. USD/JPY looks good for long setup.Setup looking good for momentum outbreak. Once near term resistance level 137.826 being broken, likely to surge towards 146.69 level base on 1:1 wave.
Duration towards short term.
DYODD!

Usd jpy sellHello, according to my analysis of USDJPY. It exists in a very negative state. The price broke the ascending channel, with the formation of a descending channel as shown in the analysis: All these factors confirm the sellers’ control over the market. More declines in the coming days. Good luck to everyone

GBPJPY and USDJPY Top-down analysis Hello traders, this is a complete multiple timeframe analysis of this pair. We see could find significant trading opportunities as per analysis upon price action confirmation we may take this trade. Smash the like button if you find value in this analysis and drop a comment if you have any questions or let me know which pair to cover in my next analysis.

#USDJPY: Still bull have the control! Dear traders,
with usdjpy we expect price to rise continuously moving forward due to two main reason, firstly we think buyers presence in the market is significate and this was just a small short of retracement. Secondly, there are many majors news that will have huge impact on DXY moving forward. About entries, there are two areas of entries first is where price from the current trading price rise from this moment. Second, is where price can drop around 144-143 region and bounce from that point.

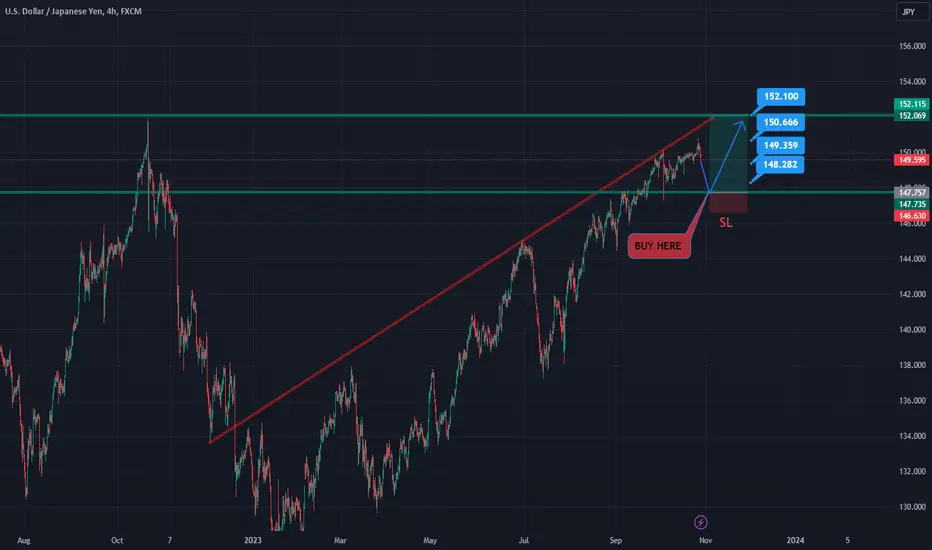
USDJPY Longs from 145.000 up to 148.300This week, the current position of USDJPY appears favorable, positioned near two promising Points of Interest (POIs). We are inclined towards buying opportunities as the price has recently responded to a supply zone, and we anticipate a slowdown and accumulation.
Upon the completion of Wyckoff accumulation within our designated zone, we will seek buy positions for a short-term trade, aiming to reach the nearest significant supply. This counter-trend trade will serve as a retracement, acknowledging the temporary bearish trend.
Confluences for USDJPY Longs are as follows:
- To sustain its bearish trend, the price must respond to a demand level, prompting a retracement.
- The price is nearing a crucial demand level on the 13-hour chart that has broken the structure to the upside.
- There are remaining equal highs and imbalances above, which needs to get mitigated.
The Dollar Index (DXY) is poised for an upward retracement, aligning with this bias.
- The overall market trend on higher time frames, such as the monthly chart, remains generally bullish.
- Price has taken some significant liquidity like asian lows so price might be due for a correction.
P.S. Upon the price reaching our 4-hour supply zone, we will patiently await a form of redistribution to align ourselves with the bearish trend. Currently, our focus is on the anticipation of a slowdown and pullback, which we expect to occur in response to the 13-hour demand.

USDJPY I Rejecting support and potential riseWelcome back! Let me know your thoughts in the comments!
** USDJPY Analysis - Listen to video!
We recommend that you keep this pair on your watchlist and enter when the entry criteria of your strategy is met.
Please support this idea with a LIKE and COMMENT if you find it useful and Click "Follow" on our profile if you'd like these trade ideas delivered straight to your email in the future.
Thanks for your continued support!

USDJPY R:R 1:4This is for short term
Marked Possible Buy zone
Once Reached Entry zone Look for Liquidity sweep and BOS in LTF then Enter
And this is risky too.
Please DYOR before entering the trade.

USDJPY DOUBLE BOTTOM PATTERN FORMATIONWe expect further upside on this pair, signalled by the formation of a double bottom pattern We can also see the breakout, close and retest of price above a key level on lower time frames, further supporting our directional basis.

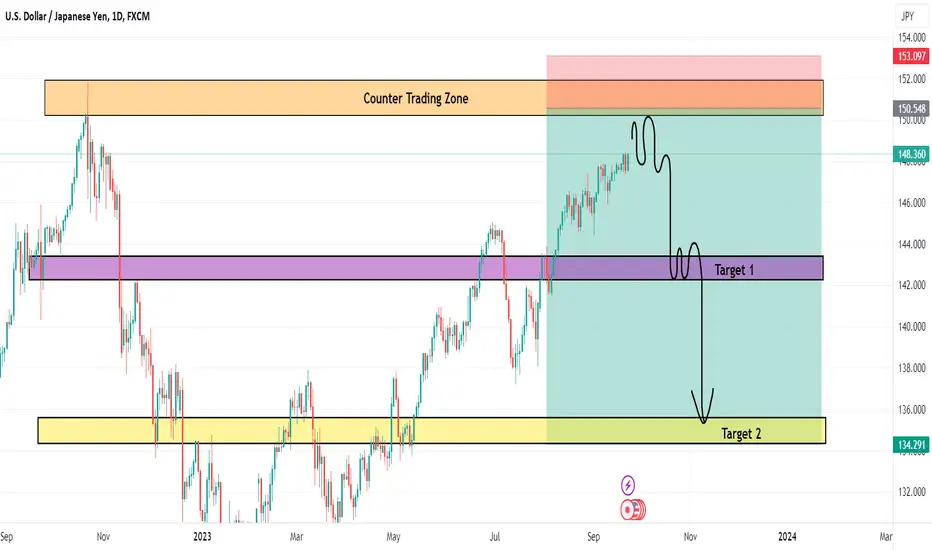
USDJPY Long Term SELLING Trading IdeaHello Traders
In This Chart USDJPY DAILY Forex Forecast By FOREX PLANET
today USDJPY analysis 👆
🟢This Chart includes_ (USDJPY market update)
🟢What is The Next Opportunity on USDJPY Market
🟢how to Enter to the Valid Entry With Assurance Profit
This CHART is For Trader's that Want to Improve Their Technical Analysis Skills and Their Trading By Understanding How To Analyze The Market Using Multiple Timeframes and Understanding The Bigger Picture on the Charts

USDJPY Take off??USDJPY, the double bottom pattern, might indicate a reversal of the previous downward trend. Traders often use the distance between the lowest low of the pattern and the resistance line to estimate a potential price target.
Based on this pattern, and major direction of trend, a projected target of 151 might be feasible. However, it's essential to apply technical analysis and consider other indicators to confirm the pattern and potential price target before making trading decisions.

JPY plummeted with bad newsThe Bank of Japan adjusted monetary policy, the Yen suddenly plummeted
According to results from the Bank of Japan's two-day meeting, the bank's Policy Committee allowed 10-year bond yields to exceed 1%, considering this level as an upper threshold instead of a ceiling. hard and remove the commitment to protect this ceiling by buying bonds with unlimited volume.
Short-term interest rates are set at -0.1%, while 10-year bond yields are at around 0% under yield curve control, as is the current policy.
The above decision shows that rising global bond yields and persistently high inflation are making it more difficult for the Bank of Japan to maintain its yield curve control policy.


USDJPY BUYING FROM SUPPORT HELLO TRADERS,,,
As i can see USDJPY is moving all time HIGHER on 4HR and daily TF but still it had not tested the last weekly horizontal support so i am expecting a drop on this pair on smaller Time Frames to test support zone & then we can enter to buying this pair with very low risk and higher rewards on bigger TF it is showing something big pictures whats Ur thoughts and ideas on this pair we appreciate Ur love and support it help alote of traders community
Stay tuned for more updates
USDJPY UPDATE. Either push now or unclear again.UJ holds the bullish trend, that's for sure. But multiple intervention bring unclearaty to this market. Please see connected ideas for context.

Alert: Yen's Weakening Against Dollar Raises Intervention Risk Over the past few weeks, we have observed a steady decline in the value of the yen against the dollar. This trend has raised serious concerns about the possibility of intervention by the Japanese government or central bank. As traders, it is essential that we consider the potential implications of such intervention and take appropriate action to safeguard our positions.
Given the current state of affairs, I strongly urge you to consider going long on the yen. However, it is equally important to remain cautious and closely monitor any signs of intervention by Japanese authorities. The intervention risk is real and could significantly impact the yen's value in the market.
To ensure you make informed decisions, I encourage you to keep a close eye on key economic indicators, news releases, and any statements from Japanese policymakers. Additionally, staying updated on market sentiment and expert analysis will be invaluable in navigating this uncertain landscape.
As we move forward, let us remember that risk management is of utmost importance. While there may be opportunities to profit from the yen's weakening, it is crucial to have a well-defined risk management strategy in place. This will help protect your investments and mitigate potential losses in case of unexpected market movements.
In conclusion, I want to emphasize the importance of being proactive and prepared in these challenging times. By going long on the yen while remaining vigilant for potential intervention, we can position ourselves strategically to take advantage of market opportunities while minimizing risks.
Should you have any questions or concerns, please do not hesitate to comment below. Let us support each other and collectively navigate through this period of uncertainty.

USDJPY Top-down analysis Hello traders, this is a complete multiple timeframe analysis of this pair. We see could find significant trading opportunities as per analysis upon price action confirmation we may take this trade. Smash the like button if you find value in this analysis and drop a comment if you have any questions or let me know which pair to cover in my next analysis.

USDJPY Top-down analysis Hello traders, this is a complete multiple timeframe analysis of this pair. We see could find significant trading opportunities as per analysis upon price action confirmation we may take this trade. Smash the like button if you find value in this analysis and drop a comment if you have any questions or let me know which pair to cover in my next analysis.

USDJPY possible entry opportunity Hello traders, this is a complete multiple timeframe analysis of this pair. We see could find significant trading opportunities as per analysis upon price action confirmation we may take this trade. Smash the like button if you find value in this analysis and drop a comment if you have any questions or let me know which pair to cover in my next analysis.

USDJPY Long Term SELLING Trading IdeaHello Traders
In This Chart USDJPY DAILY Forex Forecast By FOREX PLANET
today USDJPY analysis 👆
🟢This Chart includes_ (USDJPY market update)
🟢What is The Next Opportunity on USDJPY Market
🟢how to Enter to the Valid Entry With Assurance Profit
This CHART is For Trader's that Want to Improve Their Technical Analysis Skills and Their Trading By Understanding How To Analyze The Market Using Multiple Timeframes and Understanding The Bigger Picture on the Charts
USDJPY: Confidence in the uptrend!USD/JPY consolidates in a tight range around 147.40 ahead of US UoM confidence data
The USD/JPY pair consolidated its recent gains in a tight range below the mid-147.00s during the first hour of Asian trading on Friday. The stronger US dollar (USD) is underpinned by strong US economic data. Meanwhile, the US Dollar Index (DXY), a measure of the USD's value against six other major currencies, held above 105.35, near its highest daily close since March. The pair is currently trading near 147.45, losing 0.02% on the day.

USDJPY Top-down analysis Hello traders, this is a complete multiple timeframe analysis of this pair. We see could find significant trading opportunities as per analysis upon price action confirmation we may take this trade. Smash the like button if you find value in this analysis and drop a comment if you have any questions or let me know which pair to cover in my next analysis.

USDJPY: BoJ has a strong influence on the position of the currenThe USD/JPY pair broke its winning streak of three days, trading lower around 147.40 in the early hours of Wednesday's European trading session. The currency pair retreated from its recent highs reached on Tuesday, marking a new high since November 2022. The pair is facing downward pressure following a statement from Japan's top currency diplomat, Masato Kanda, according to Reuters' report.
