USDJPY Strong Breakout!
HI,Traders !
#USDJPY made a bearish
Breakout of the rising support
Line and the breakout is
Confirmed so we will be
Expecting a further bearish
Move down !
Comment and subscribe to help us grow !
Usdjpysell

USD/JPY) Bullish trend analysis Read The captionSMC Trading point update
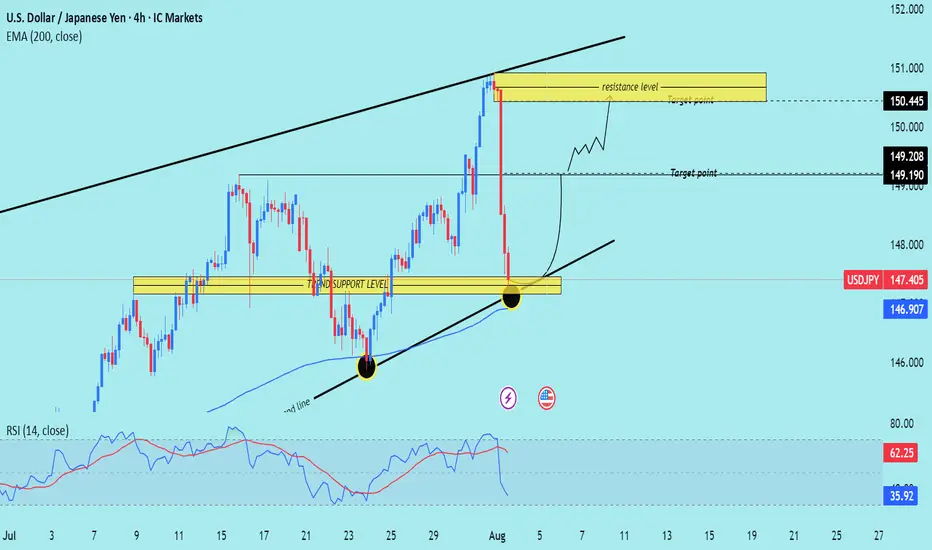
Technical analysis of USD/JPY on the 4-hour timeframe, using a combination of trendline support, key horizontal levels, and EMA 200 confluence to identify a potential bounce.
---
Technical Breakdown:
1. Market Structure:
USD/JPY experienced a sharp decline from the resistance zone near 150.445, but price is now testing a strong confluence support area:
Horizontal support zone
Rising trendline
200 EMA (146.907)
2. Support Confluence Zone:
Marked as "trend support level", this zone has historically acted as a springboard for bullish moves.
Recent price action shows a wick rejection at this zone, indicating buying pressure.
3. Resistance/Target Zones:
Target 1: 149.190 – 149.208
Target 2: 150.445 (major resistance zone)
4. EMA 200:
Price is reacting just above the 200 EMA, strengthening the bullish case for a bounce.
5. RSI (14):
RSI has dipped to 35.92, near oversold territory, suggesting the downside may be exhausted.
Prior bounce from similar RSI levels led to strong upward moves.
6. Projected Path:
The chart outlines a potential bullish recovery, targeting a climb back into the upper channel and retesting previous highs.
Mr SMC Trading point
---
Trade Idea Summary:
Bias: Bullish (Reversal from trendline + support zone)
Entry Zone: Current level near 147.40–146.90 (support confluence)
Targets:
TP1: 149.190
TP2: 150.445
Invalidation: Daily close below trendline and 200 EMA (~146.70 or lower)
Indicators: RSI supports a bounce; EMA and trendline confirm structure
Please support boost 🚀 this analysis)
USD/JPY) Bullish Trend Read The captionSMC Trading point update
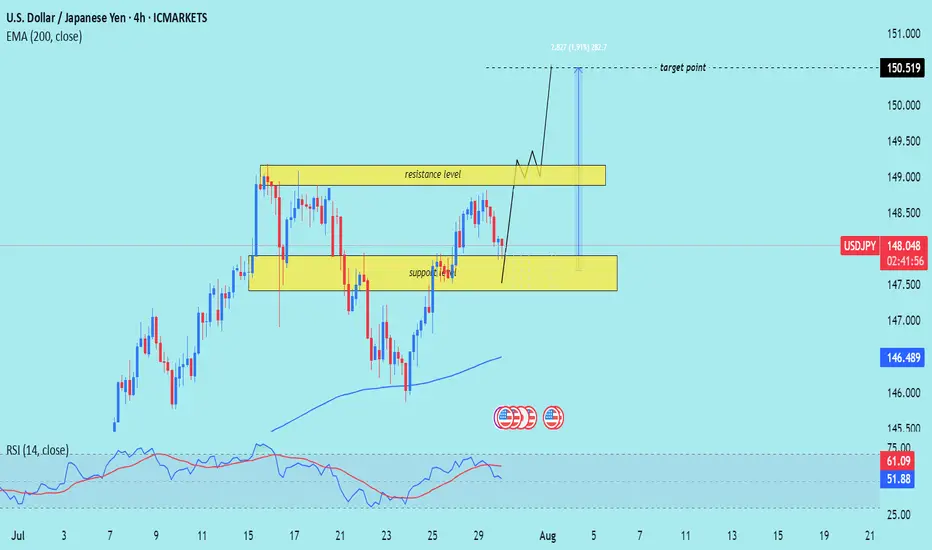
Technical analysis of USD/JPY on the 4-hour timeframe, with a focus on a support-resistance structure and trend
---
Technical Breakdown:
1. Market Structure:
Price is moving in a clear uptrend, making higher highs and higher lows.
A recent pullback into a support zone suggests potential for a bullish continuation.
2. Key Zones:
Support Zone: Around 147.00–147.50, highlighted in yellow — the area where price recently bounced.
Resistance Zone: Around 148.800–149.300, which price is expected to break through.
Target Point: Clearly marked at 150.519, aligning with the prior high and a projected bullish extension.
3. EMA (200):
The 200 EMA (blue) is at 146.489, far below current price — signaling strong bullish momentum.
4. RSI (14):
RSI is at 61.14, showing bullish momentum without being overbought — supportive of further upside.
No divergence is noted, which supports trend continuation.
5. Projection (Drawn Path):
The chart suggests price may bounce from support, break through resistance, and rally toward 150.519, possibly after a retest of the resistance-turned-support.
Mr SMC Trading point
---
Trade Idea Summary:
Bias: Bullish
Entry Zone: Near 147.00–147.50 (support)
Confirmation: Bullish candlestick pattern or strong bounce
Target: 150.519
Invalidation: Break and close below 146.489 (200 EMA) or sustained move below support zone
---
Please support boost 🚀 this analysis)
USDJPY – DAILY FORECAST Q3 | W31 | D29 | Y25📊 USDJPY – DAILY FORECAST
Q3 | W31 | D29 | Y25
Daily Forecast 🔍📅
Here’s a short diagnosis of the current chart setup 🧠📈
Higher time frame order blocks have been identified — these are our patient points of interest 🎯🧭.
It’s crucial to wait for a confirmed break of structure 🧱✅ before forming a directional bias.
This keeps us disciplined and aligned with what price action is truly telling us.
📈 Risk Management Protocols
🔑 Core principles:
Max 1% risk per trade
Only execute at pre-identified levels
Use alerts, not emotion
Stick to your RR plan — minimum 1:2
🧠 You’re not paid for how many trades you take, you’re paid for how well you manage risk.
🧠 Weekly FRGNT Insight
"Trade what the market gives, not what your ego wants."
Stay mechanical. Stay focused. Let the probabilities work.
OANDA:USDJPY

USD/JPY) Bullish Analysis Read The captionSMC Trading point update
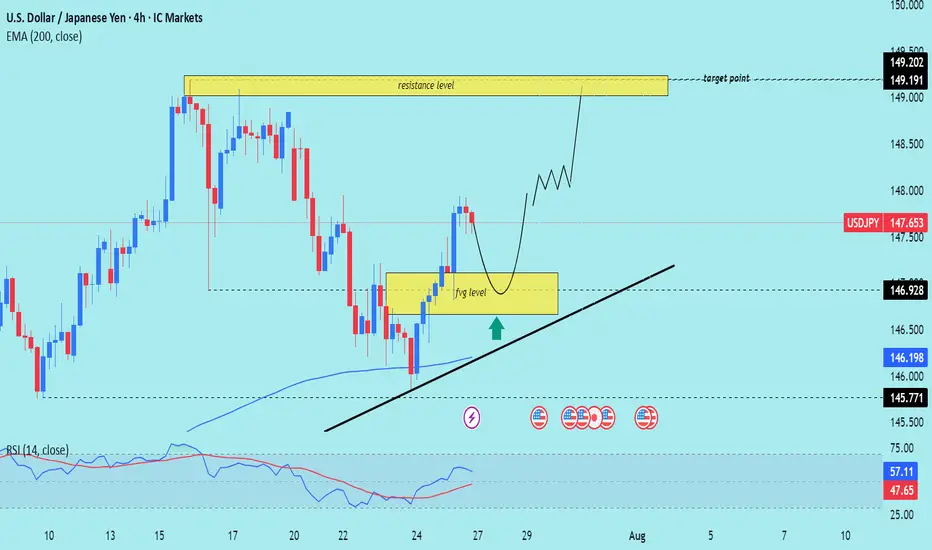
Technical analysis of USD/JPY on the 4-hour timeframe, signaling a potential rally toward the 149.191–149.202 resistance zone. Here's the full breakdown
---
Technical Analysis – USD/JPY (4H)
1. Fair Value Gap (FVG) Support
Price recently filled a Fair Value Gap (FVG) level (yellow box) and is now pulling back toward it.
The FVG zone is expected to act as a support and potential entry point for buyers (marked by the green upward arrow).
2. Uptrend Structure
Price is moving within an ascending trendline, suggesting bullish market structure.
The current retracement is seen as a higher low setup, aligning with bullish continuation logic.
3. 200 EMA as Support
The 200 EMA at 146.198 is providing dynamic support.
Confluence between the EMA, FVG, and ascending trendline strengthens the bullish bias.
4. Resistance Target Zone
The projected target zone is between 149.191–149.202, which aligns with a previous high and key resistance level.
This zone is highlighted as the final take-profit area.
5. RSI Momentum
RSI is at 57.11, showing positive momentum but not yet overbought — which supports further upside.
RSI remains above 50, maintaining bullish momentum.
Mr SMC Trading point
---
Summary
Bias: Bullish
Current Price: 147.653
Support Zone (FVG): 146.20–146.92 (approx)
Trendline Support: Uptrend line intact
200 EMA: Acting as dynamic support (146.198)
Resistance Target: 149.191–149.202
RSI: 57.11 – healthy bullish momentum
plesse support boost 🚀 this analysis)
USDJPY SELLUSD/JPY rises further and approaches 148.00 as the US Dollar firms up
The US Dollar rallies for the second consecutive day against the Yen, and approaches 148.00. Strong US data support the Fed's "wait and see" stance and underpin demand for the US Dollar. In Japan, the uncertain political context is likely to deter the BoJ from hiking interest rates further.
Previous market optimism is turning into caution as the market shifts its focus to the monetary policy reports by the Bank of Japan and the US Federal Reserve due next week.
The Fed is widely expected to leave interest rates unchanged next week, more so after the strong US business activity and Jobless Claims figures released on Thursday. These data confirmed that the US economy remains resilient with a healthy labour market, which gives further leeway for the Fed to await further insight into the impact of tariffs before resuming rate cuts. The US Dollar has been trading higher following Thursday’s releases.
Also on Thursday, US President Trump paid an unusual visit to the Federal Reserve, only a few days ahead of their monetary policy meeting. Trump complained about the overcosts of the headquarters’ renovation and pressed for a less restrictive monetary policy, but his unusually soft comments after the visit eased investors’ concerns about the previous attacks on the central bank's independence.
In Japan, the somewhat softer Tokyo inflation figures seen on Friday and the trade deal would help the BoJ to continue hiking interest rates, but the bank is likely to stand pat next week and probably delay further monetary tightening until the political situation clarifies. This is likely to keep the Yen upside attempts subdued in the near-term.
SUPPORT 147.642
SUPPORT 147.311
SUPPORT 146.854
RESISTANCE 148.206
RESISTANCE 147.972

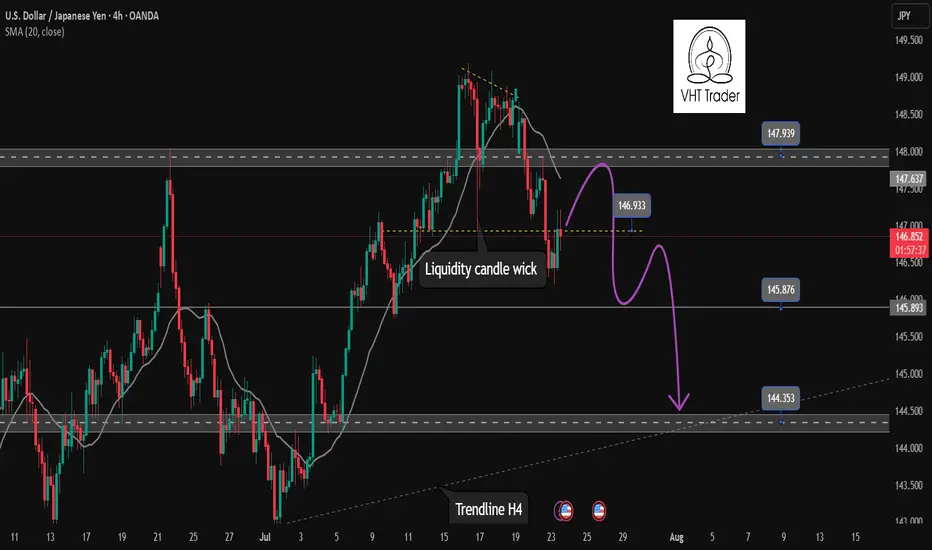
Continuation of downtrend. Waiting for confirmation SELL USDJPY✏️ OANDA:USDJPY is starting a corrective downtrend. Yesterday's New York session's selling pressure surpassed the buying liquidity zone around 147,000. This further confirms the possibility of the pair continuing its downward correction. Some recovery waves in today's Asia-Europe session are considered a good opportunity to SELL towards the target of 144,300 (trailline zone of the h4 frame). Pay attention to the important breakout price zone of 145,900.
📉 Key Levels
Support: 145,900-144,300
Resitance: 147,000-147,800
SELL trigger: Rejection from 147,000
SELL 147,700 (Strong resistance + SMA 20)
Target 144,400
SELL DCA: Break 145,900
Leave your comments on the idea. I am happy to read your views.
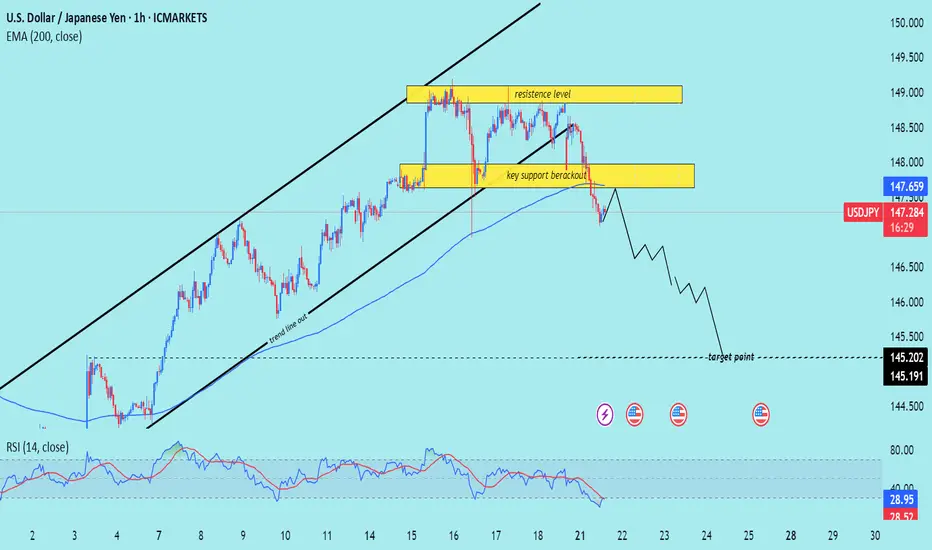
USD/JPY) bearish Trend Read The captionSMC Trading point update
Technical analysis of USD/JPY on the 1-hour timeframe, signaling a potential drop toward the 145.200 – 145.191 target zone. Here's the detailed breakdown:
---
Technical Analysis – USD/JPY (1H)
1. Rising Channel Breakdown
Price has broken below an ascending channel, confirming a trend line breakout and signaling a trend shift from bullish to bearish.
The trend line cut and rejection from the upper resistance zone support the bearish reversal.
2. Key Support Breakout
A crucial horizontal support zone around 147.80–148.00 was broken.
The break-and-retest of this area (yellow box) acts as a confirmation of bearish momentum continuation.
3. Bearish Momentum Below EMA
Price is trading below the 200 EMA (147.659) — a strong signal of downward bias on this timeframe.
The EMA has flipped from dynamic support to resistance.
4. RSI Oversold but Bearish
RSI is at 29.41, in oversold territory, which may hint at a short-term bounce.
However, the broader structure suggests more downside potential before a deeper retracement.
5. Target Projection
Projected target zone is between 145.200–145.191, aligning with previous structure lows and likely liquidity zone.
Mr SMC Trading point
Summary
Bias: Bearish
Current Price: 147.307
Key Resistance: 147.80–148.60 zone
Structure: Rising channel break + key support breakout
200 EMA: Above price (bearish signal)
RSI: 29.41 – oversold but momentum remains bearish
Target: 145.200–145.191
Please support boost 🚀 this analysis)
USDJPY Bearish Breakout!
HI,Traders !
#USD-JPY was trading along
The rising support line but
Now we are seeing a bearish
Breakout so we are bearish
Biased and we will be expecting
A further bearish move down !
Comment and subscribe to help us grow !

USDJPY SELL
USD/JPY
Editorial Tools Latest
USD/JPY Forecast and News
share
Join
NEW
Japanese Yen hangs near multi-month low against USD ahead of Japan election on Sunday
The Japanese Yen drifts lower against its American counterpart for the second straight day on Friday and remains within striking distance of an over three-month low touched earlier this week. Investors now seem convinced that the Bank of Japan (BoJ) would forgo raising interest rates this year amid worries about the economic fallout from higher US tariffs
From a technical perspective, the USD/JPY pair showed some resilience below the 100-hour Simple Moving Average (SMA) earlier this week, and the subsequent move up favors bullish traders. Moreover, oscillators are holding comfortably in positive territory and are still away from being in the overbought zone. However, the overnight failure to build on the momentum beyond the 149.00 mark warrants some caution. Hence, it will be prudent to wait for some follow-through buying beyond the 149.15-149.20 region, or a multi-month peak, before positioning for a move towards reclaiming the 150.00 psychological mark.
On the flip side, the 148.20-148.25 region, or the 100-hour SMA, could offer immediate support ahead of the 148.00 mark. Some follow-through selling, leading to a slide below the 147.70 area, could make the USD/JPY pair vulnerable to accelerate the fall towards testing sub-147.00 levels. Acceptance below the latter might shift the bias in favor of bearish trades and drag spot prices to the 146.60 intermediate support en route to the 146.20 area, the 146.00 mark, and the 100-day SMA, currently pegged near the 145.80 region
1 SUPPORT147.642
2 SUPPORT 147.311
3 SUPPORT 146917
1 RESISTANCE 148.206
2 RESISTANCE 147.972

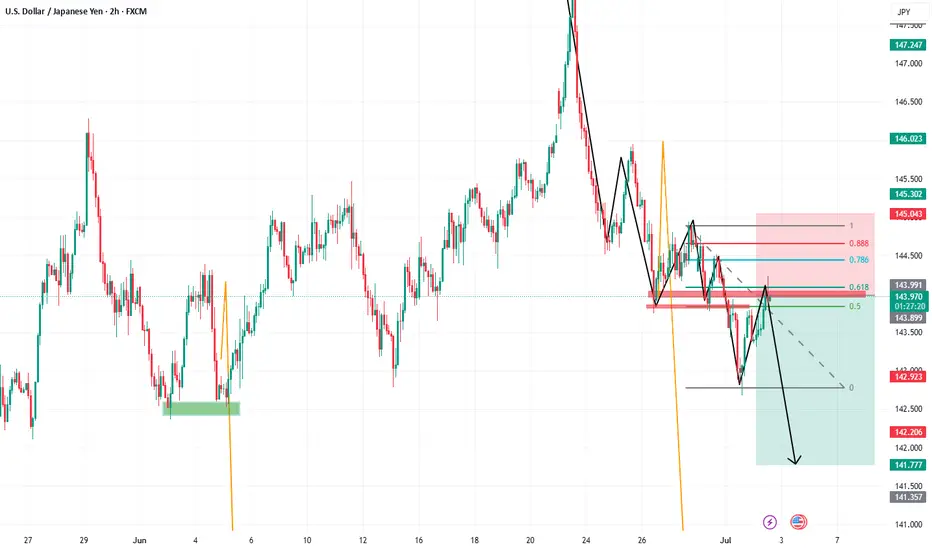
USDJPY SELL IDEAAfter yesterday's spiky move caused by d.trump
Market should correct some of those imbalance soon
Target at the ERL

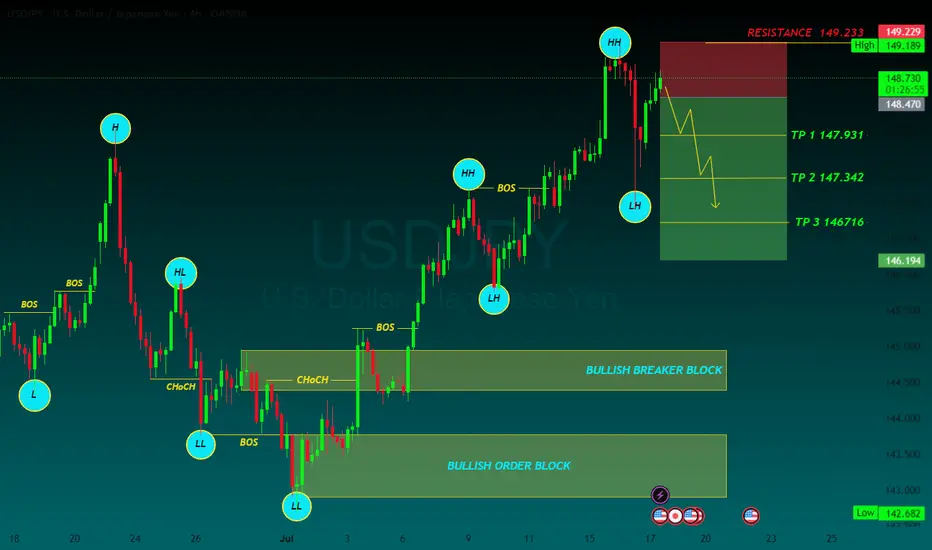
USDJPY SELLJapanese Yen adds to intraday losses; USD/JPY climbs to 148.80 amid broad-based USD strength
The Japanese Yen selling remains unabated through the early European session on Thursday, which along with a goodish pickup in the US Dollar demand, lifts the USD/JPY pair to the 148.80 region in the last hour. Data released earlier today showed that Japan clocked a smaller-than-expected trade surplus in June.
From a technical perspective, the USD/JPY pair showed some resilience below the 100-hour Simple Moving Average (SMA) on Wednesday, and the subsequent move up favors bullish traders. Moreover, oscillators are holding comfortably in positive territory and are still away from being in the overbought zone, suggesting that the path of least resistance for spot prices is to the upside. Hence, some follow-through strength back towards the 149.00 mark, en route to the overnight swing high near the 149.15-149.20 region, looks like a distinct possibility. The upward trajectory could extend further towards reclaiming the 150.00 psychological mark for the first time since late March.
On the flip side, the 148.00 round figure now seems to protect the immediate downside ahead of the Asian session low, around the 147.70 region. The latter nears the 100-hour SMA, below which the USD/JPY pair could retest sub-147.00 levels. Some follow-through selling might shift the bias in favor of bearish trades and drag spot prices to the 146.60 intermediate support en route to the 146.20 area, the 146.00 mark, and the 100-day SMA support, currently pegged near the 145.80 region\
TP 1 147.931
TP 2 147.342
TP 3 146716
RESISTANCE 149.233
USD/JPY 4-Hour Forex Chart4-hour performance of the U.S. Dollar (USD) against the Japanese Yen (JPY) from late June to mid-July 2025, sourced from FOREX.com. The current exchange rate is 147.436, with a 1.178 (+0.81%) increase. Key levels include a sell price of 147.393 and a buy price of 147.479. The chart shows a recent upward trend with a resistance zone highlighted between 147.436 and 148.092, and support around 146.598. Candlestick patterns indicate volatility, with notable price movements around early July.

USDJPY Short From Resistance!
HI,Traders !
#USDJPY keeps growing
And the pair is overbought
So after it hits the horizontal
Resistance of 148.149 from
Where we will be expecting
A local bearish correction !
Comment and subscribe to help us grow !

USD/JPY 4-Hour Chart Analysis4-hour chart for the U.S. Dollar/Japanese Yen (USD/JPY) currency pair, sourced from The chart displays the exchange rate's fluctuations over time, with key indicators and annotations

USD/JPY Made H&S Reversal Pattern , Short Setup Valid !Here is my 15 Mins Chart on USD/JPY , We have a very clear reversal pattern , head & shoulders pattern and we have a confirmation by closure below our neckline so we can enter direct now or waiting the price to go back and retest the neckline and this is my fav scenario .

USDJPY IS THE ONLY FALLING h4Price dips below 143.000 support
Attracts breakout sellers
Sharp reversal back toward resistance at 146.500+
Target zone: 147.800 – 149.000

USDJPY – Key Support Bounce with Macro TailwindsUSDJPY is bouncing off a key trendline and 61.8% Fib zone (143.25–143.60) with confluence across multiple JPY crosses (EURJPY, AUDJPY, CADJPY). This area has historically triggered strong upside momentum, and the current setup aligns with both technical structure and macro drivers.
📊 Fundamentals Supporting the Move:
✅ US Yields Stable: US10Y is holding above 4.20%, keeping USDJPY supported. If yields push back toward 4.30%, expect USDJPY to retest 145.30 and potentially 147.80.
✅ BoJ Dovish: Japan shows no shift in policy. Despite weak Tankan data, BoJ remains patient, and no meaningful rate hike or YCC change is expected soon.
✅ USD Macro Resilience: Core PCE held firm at 2.6%. Focus now shifts to ISM Services PMI (Wed) and NFP (Fri). Markets are still pricing a soft landing – supporting risk-on and a stronger USD.
✅ JPY as a Fading Safe Haven: Even with geopolitical headlines (Trump tariff tensions, Taiwan, Middle East), JPY demand remains weak. Traders are favoring USD and Gold over JPY as risk hedges.
⚠️ Risks to Watch:
Dovish US Data Surprise: Weak NFP or ISM could drag yields down and trigger USDJPY reversal.
Verbal or Actual BoJ Intervention: If we approach 148.50–150, Japan may step in again.
Geopolitical Escalation: Any sharp risk-off could trigger safe haven demand for JPY, though this has underperformed recently.
🔎 Correlation Dynamics:
📈 USDJPY is leading JPY crosses like EURJPY and AUDJPY. The recent bounce started simultaneously across the JPY complex, with USDJPY slightly ahead.
📉 If US yields drop or risk sentiment shifts, USDJPY may lag gold or bonds but eventually catch up.
🧠 Trading Plan:
📍 Entry Zone: 143.30–143.60 (trendline + Fib confluence)
🎯 Target 1: 145.30 (38.2% Fib)
🎯 Target 2: 147.80 (channel resistance)
🛑 Invalidation: Daily close below 141.50 with US yields breaking down
📅 Upcoming Events to Watch:
Wed July 3: ISM Services PMI (key for USD reaction)
Fri July 5: US Non-Farm Payrolls + Average Hourly Earnings
JPY Risk: Verbal intervention possible near 148+
🧭 Summary:
USDJPY is positioned for a bullish continuation, backed by:
Rising yields
Resilient US macro
Weak JPY fundamentals
Technical structure respecting trendline support
Short-term traders can target the 145–147.80 range ahead of NFP, with a tight eye on yield and risk sentiment.
📌 If this analysis helps, drop a like and follow for more real-time macro-technical breakdowns. Stay nimble ahead of NFP! 🧠📈

USD/JPY) back down Trend Read The captionSMC trading point update
Technical analysis of USD/JPY (U.S. Dollar / Japanese Yen) on the 3-hour timeframe, anticipating a rejection from a descending trendline resistance and a move down toward key support levels.
---
Analysis Overview:
Trend Bias: Bearish correction expected
Structure: Price is reacting at a descending trendline, which has held as resistance on multiple occasions.
Indicators:
EMA 200 (144.756): Price is currently above, but projected to break below it.
RSI (14): Overbought at ~74, signaling potential for a reversal.
---
Key Technical Components:
1. Descending Trendline Resistance:
Price is approaching/has touched a well-respected downtrend line, marked by three strong rejections (red arrows).
This trendline has consistently capped bullish moves, indicating strong seller interest.
2. Bearish Reversal Expectation:
The projected path suggests a potential fake breakout or double-top, followed by a steep decline.
A two-stage drop is anticipated, with price first targeting the EMA 200 zone, then extending lower.
3. Target Points:
First target: Around 145.244, near EMA 200.
Final target: 143.048, aligning with the key support zone (highlighted in yellow), where price previously bounced.
4. RSI (14):
Currently overbought (73.29), signaling a likely retracement.
Prior peaks at this level led to notable corrections.
---
Trade Setup Idea:
Parameter Level
Entry Near current price (~146.85) if bearish pattern confirms
Stop-Loss Above trendline (~147.30–147.50)
Target 1 145.24 (EMA 200 zone)
Target 2 143.05 (Support zone)
This setup offers a high-probability short opportunity if resistance holds.
---
Risk Factors:
Upcoming economic events could trigger volatility (news icon marked).
A clean breakout and close above the trendline (~147.50+) would invalidate this bearish thesis.
Mr SMC Trading point
---
Summary:
The analysis suggests a potential USD/JPY reversal from a descending trendline, supported by overbought RSI and prior rejections. The bearish projection targets a move toward 143.048, following a dip below the EMA 200 level at 145.244.
Please support boost 🚀 this analysis)

USDJPY h4 strongly downBearish Expectation Disruption / Bullish Counterpoint
Resistance (147.5) Rejection and drop Breakout and continuation toward 148.5+
Breakout FVG Fakeout and reversal True breakout — bullish trend continues
Bullish Zone (~144) Clean break below Accumulation zone, strong buying interest may emerge
Target (~143) Next leg down May not be reached if price stabilizes above 145
Support (~142.5) Final drop destination Could become irrelevant if trend flips decisively bullish Original Assumption: Market is behaving in isolation from fundamentals.
Disruption: If U.S. data (e.g., strong NFP, CPI, or Fed commentary) supports rate hikes, USD/JPY may remain bid and breakout to 148+ instead of reversing.
Watch For: Strong dollar narrative or dovish BOJ language.

USDJPY SELLBy utilizing levels, historical patterns, , we can formulate a hypothesis that the market might follow a similar trajectory if bearish sentiment prevails.
USD/JPY) Back support level Read The captionSMC trading point update
Technical analysis of USD/JPY pair using a combination of price action, resistance/support levels, and indicators. Here's a breakdown of the idea behind the analysis:
---
Chart Breakdown (2H - USD/JPY)
1. Key Zones:
Resistance Level (Yellow Box at Top):
Price has previously been rejected from this zone multiple times.
Recent bearish wicks and aggressive sell-offs are marked by red arrows—showing strong seller interest.
Support Level / Target Point (Bottom Yellow Box):
Price has found strong buying interest around 142.142.
This zone is the anticipated downside target if the bearish scenario plays out.
2. Bearish Bias Justification:
Liquidity Grab / Fakeout (labeled “fug”):
The price briefly broke above the smaller resistance block but quickly reversed.
This "fake breakout" often traps buyers, strengthening the bearish case.
EMA 200 (Blue Line):
Price is currently near or slightly under the 200 EMA (144.553), suggesting a potential rejection area aligning with resistance.
RSI Indicator:
RSI shows divergence and has not confirmed a bullish breakout.
The values (56.77 and 42.82) indicate loss of bullish momentum.
3. Projection (Black Lines):
The black zig-zag lines represent a forecasted drop to the support level.
Suggests a short setup near 144.50–145.00 with targets near 142.14.
Mr SMC Trading point
---
Summary:
Bias: Bearish
Entry Zone: Near resistance area (144.50–145.00)
Target: 142.142 (support zone)
Invalidation: Strong break above 145.00 and hold
Confirmation: Rejection from resistance with bearish candle pattern
---
Please support boost 🚀 this analysis)

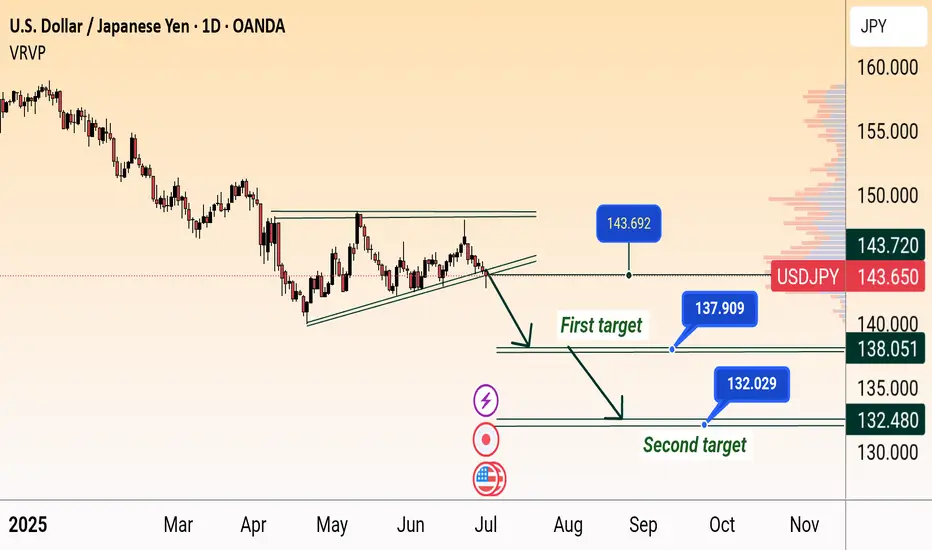
USD/JPY Bearish Breakdown Targets 138 & 132USD/JPY Bearish Breakdown Setup (Daily Chart)
USD/JPY breaks below rising wedge support near 144, signaling potential downside. Price targets are marked at 138.051 (first target) and 132.480 (second target), indicating possible continued weakness if the bearish momentum holds.