Critical Channel Watch Begins on the 1-Hour Chart of USDJPY.Hey everyone,
📉 My Latest USDJPY Analysis:
USDJPY is currently moving within a downtrend. If the price breaks below the lower boundary of the parallel channel, our first target level will be 142.910. The most crucial factor here is the downward breakout of that channel—don’t overlook it.
Also, keep a close eye on key economic data releases on the fundamental side, as they could significantly influence your strategy.
I meticulously prepare these analyses for you, and I sincerely appreciate your support through likes. Every like from you is my biggest motivation to continue sharing my analyses.
I’m truly grateful for each of you—love to all my followers💙💙💙
Usdjpysell

USDJPY and USDCAD Analysis todayHello traders, this is a complete multiple timeframe analysis of this pair. We see could find significant trading opportunities as per analysis upon price action confirmation we may take this trade. Smash the like button if you find value in this analysis and drop a comment if you have any questions or let me know which pair to cover in my next analysis.

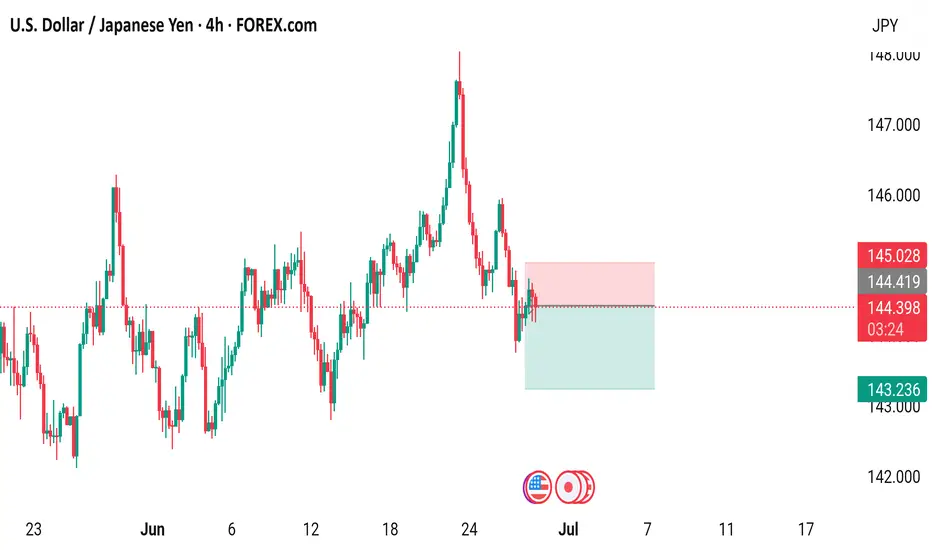
USD/JPY 4-Hour Forex Chart4-hour performance of the U.S. Dollar (USD) against the Japanese Yen (JPY) from FOREX.com, showing a current exchange rate of 144.351 with a slight decrease of 0.063 (-0.04%). The chart highlights a recent sharp upward movement followed by a decline, with key support and resistance levels marked around 144.419 and 145.028, respectively. The time frame spans from late June to early July 2025.
USD/JPY) bearish Trand analysis Read The captionSMC trading point update
Technical analysis of USD/JPY on the 3-hour timeframe, highlighting a breakdown from trendline resistance and projecting a move toward a significant downside target.
---
Technical Breakdown
1. Trendline Rejection
Price sharply rejected from the descending resistance trendline near 148.00 (red arrow), forming a potential lower high.
This suggests continuation of the broader downtrend structure.
2. Break Below EMA 200
Price has broken below the 200 EMA (144.752), signaling a shift in momentum from bullish to bearish.
EMA is likely to act as dynamic resistance if price attempts a pullback.
3. Bearish Projection
The chart outlines a measured move downward toward the target point at 139.955, implying a drop of over 5.36% (approximately 770 pips).
The projected path shows lower highs and lower lows, confirming bearish structure.
4. RSI Confirmation
RSI (14) is currently at 29.98, indicating oversold conditions, but this often supports strong momentum in trending markets—suggesting a possible continuation lower after minor retracements.
Mr SMC Trading point
---
Conclusion / Idea Summary
Bias: Bearish
Entry: After trendline rejection and EMA 200 break (~144.75)
Target: 139.955
Invalidation: Break above 148.00 resistance trendline
---
Please support boost 🚀 this analysis)

USDJPY H4 AnalysisUSDJPY Showing a Bearish Flag. If it breaks this zone above, Most probably can fly up to 148.668 and higher to 150.538. If no, Can rally between 143.981 or even lower to 142.410. Trading Analysis from 23-06-25 to 27-06-25. Take your risk under control and wait for market to break support or resistance on smaller time frame. Best of luck everyone and happy trading.🤗

USD/JPY 4-Hour Forex Chart (June 20, 2025)4-hour candlestick chart from FOREX.com displays the USD/JPY currency pair's performance, showing a current value of 145.328 with a slight decrease of 0.112 (-0.08%). The chart highlights a recent downward trend following a peak near 145.950, with a shaded area indicating a potential resistance zone around 145.500-145.950. The time frame spans from early June to the present date, with key levels marked at 145.000, 144.478, and higher resistance points.

USD/JPY 2-Hour Forex Chart2-hour candlestick chart from FOREX.com displays the exchange rate between the U.S. Dollar (USD) and the Japanese Yen (JPY). The current rate is 145.513, with a slight increase of +0.074 (+0.05%). The chart shows price movements over the past 2-hour period, with a notable upward trend followed by a recent decline, as highlighted by the shaded area indicating a potential resistance or reversal zone. Key levels such as 145.701 and 145.106 are marked, along with the current time of 04:00.

USD/JPY) Bearish reversal analysis Read The captionSMC trading point update
Technical analysis of USD/JPY 3-hour chart suggests a bearish reversal setup, based on smart money concepts (SMC), resistance rejection, and price action structure. Here's a full breakdown:
Technical Breakdown – USD/JPY
Big Resistance Zone (~145.800–146.300):
Price has tapped into a major resistance zone (yellow box) twice (highlighted with red arrows).
Both rejections indicate strong seller interest.
The latest candle structure shows clear rejection wick, signaling weakness at resistance.
---
Bearish Bias Confirmation:
Bearish structure forming after the second rejection.
Break of the rising trendline could accelerate selling pressure.
A measured move projection (-2.58%) aligns the downside target with the support level at ~142.144.
---
Support Zone (~141.800–142.400):
Marked as the likely target zone.
Historically acted as a strong bounce area (visible from late May to early June).
Completion of ABC bearish structure aligns here.
---
Indicators & Tools:
200 EMA (144.419): Price currently slightly above it — watching for a close below to strengthen bearish view.
RSI (14): Shows signs of bearish divergence and cooling off from overbought (was above 70 previously).
Volume spike during the rejection suggests institutional selling.
Mr SMC Trading point
---
Forecast Summary:
Bias: Bearish toward 142.144
Entry Idea: Look for confirmation of breakdown below trendline (~145.00)
Invalidation: Strong bullish close above 146.300 would break this idea.
---
Please support boost 🚀 this analysis)

USDJPY Swing trade Signal for the Sell Once in a while we like to give a free signal. So here is one of the many trades we will have running for our subscribers.
Wait for the 1 hour candle to close below the Entry, and then a response to our entry, then you can sell.
Remember the rules, and remember your risk/reward
USDJPY Sell
🦇Entry: 143.525
⚠️Sl: 145.036
✔️TP1: 142.153
✔️TP2: 140.346
✔️TP3: 138.109
Happy trading. Any problems feel free to contact me, as over 10 years as a professional trader I can assure you there is no such thing as a stupid question.
Best,
Sarah

USD/JPY) Bearish trend analysis Read The ChaptianSMC trading point update
Technical analysis iUSD/JPY on the 30-minute timeframe, showing a rejection from resistance zones and a potential move toward lower support levels.
---
Analysis Breakdown
Technical Components:
1. Resistance Zones:
Primary Resistance: Near 145.500 (upper yellow box), which has previously been rejected multiple times (red arrows).
FVG (Fair Value Gap) Resistance Level: Around 144.400, also acting as strong resistance, especially near the EMA 200.
2. Downtrend Line:
The price is moving below a downward trendline, respecting bearish structure.
Last rejection from both the trendline and FVG zone confirms selling pressure.
3. EMA 200 (144.075):
Price is hovering around this level, showing indecision.
Bearish bias remains unless price breaks and holds above it.
4. Target Zone:
A clearly marked support level around 142.543, shown as the bearish target.
Includes multiple event markers (potential news catalysts or key dates), suggesting added volatility.
5. RSI (14):
Currently near 55.23, with a prior rejection from higher RSI levels.
Bearish divergence not clear, but no overbought conditions.
---
Bearish Idea Summary:
Thesis: Rejection from resistance zones + trendline + EMA suggests continuation to downside.
Expecting: Price to either:
Retest the upper resistance zone (around 145.000–145.500) and reject again, or
Break below current levels and continue lower toward 142.543.
---
Trade Idea Concept:
Entry Option 1: Sell on confirmed rejection from FVG zone or upper resistance.
Entry Option 2: Sell on break and retest below 144.000.
Target: 142.543 (support zone).
Stop Loss: Above the resistance zone or trendline (e.g., >145.600).
Mr SMC Trading point
Risks to Watch:
Invalidation: Clean break and close above 145.500 would invalidate the bearish setup.
News Impact: Note the icons near the target zone – monitor economic releases around that time.
---
Please support boost 🚀 this analysis)

USD/JPY) bearish Technical Analysis Read The captionSMC trading point update
Technical analysis of USD/JPY (U.S. Dollar vs. Japanese Yen) on the 4-hour timeframe. Here's a breakdown of the analysis:
---
Trend & Price Action
The chart shows a descending trendline connecting recent lower highs, indicating a downtrend.
Current price: 143.548
Price has recently rejected off the trendline and started to fall, suggesting continued bearish momentum.
A red arrow marks the rejection point, emphasizing a key resistance area.
---
Technical Indicators
EMA 200 (Exponential Moving Average): At 144.459 — the price is currently below the EMA, reinforcing the bearish outlook.
RSI (Relative Strength Index):
RSI (14) values: around 35.45, which is near the oversold threshold (30) but not quite there yet.
Indicates increasing bearish momentum but no reversal signal yet.
---
Support Levels Identified
1. Support Level (Target 1): ~142.280
First target point for bears. Likely to see some reaction or consolidation here.
2. Big Support Level (Target 2): ~140.382
A stronger, more significant support zone and a deeper bearish target if the first support breaks.
---
Bearish Target Scenario
The projected path (in black lines) suggests:
A further drop into the 142.280 zone.
If that breaks, a continuation toward the 140.382 level.
This suggests a swing trade setup favoring short positions if the price respects the current rejection zone.
Mr SMC Trading point
---
Conclusion
Bias: Bearish
Resistance Confirmed: Rejection from descending trendline and below EMA200.
Bearish Targets:
Short-term: 142.280
Medium-term: 140.382
Risk Management: Watch RSI for potential bullish divergence near the second support zone, which could indicate reversal or consolidation.
---
Please support boost 🚀 this analysis)

Current USD/JPY Trend Analysis and Trading RecommendationsOn Wednesday, the USD/JPY attracted buyers for the second consecutive day, trading near 145.20 in the early European session, close to a two-week high. Japan's May CGPI rose 3.2% YoY, the slowest pace since September last year, potentially easing BOJ rate hike pressure and weakening the JPY. Additionally, optimism over a framework agreement in U.S.-China trade talks dented the JPY's safe-haven appeal. Technically, the price holds above the 200-period SMA on the 4-hour chart and breaches the 145.00 psychological level, with oscillators tilting bullish. A valid break above 145.30 (Tuesday's high) would confirm the bullish setup, targeting the 146.00 integer mark and 146.25-146.30 resistance zone.
USDJPY
buy@145.000-145.200
tp:145.600-146.000

#USDJPY: +2000 PIPS Big Swing Move! Do not miss outThe cryptocurrency’s price is currently experiencing bearish pressure, and the current trading price is pivotal for determining its future trajectory. A smooth downtrend is anticipated, potentially propelling the price to 124 in the long term. The US dollar is likely to remain bearish, potentially reaching 95 in the US currency index. Three potential target sets are envisaged, and further updates will be provided based on price developments.
Best of luck and ensure safe trading practices.
Team Setupsfx_

USDJPY:800+ PIPS Dropping Well Since Our First Idea!Dear Traders,
Since we posted our idea when price was trading at 158 we told you that this will be a massive dropped and since then price has proven us right, now we think there is another big drop is on the way. Please use proper risk management while trading.

USD/JPY) breakout bearish trand analysis Read The captionSMC trading point update
Technical analysis of the USD/JPY (US Dollar / Japanese Yen) pair on a 2-hour timeframe. Here's the idea behind the analysis:
---
Overall Idea: Bearish Move Toward Support
---
Key Levels
Resistance Zone (Yellow Box, Top): Marked with two red arrows — shows strong price rejection around 146.00–147.00 area.
Support Zone (Yellow Box, Bottom): Around 139.85, marked as a target point and support level.
These two zones form the range in which price has been reacting.
---
Current Price Action
Price is currently trading at 142.649, well below the 200 EMA (at 144.190), which is a bearish signal.
It has broken below the mid-range and seems to be heading toward the lower support zone (139.85).
---
Trend & Structure
The price is following a downward trend after rejecting from the resistance zone.
The channel suggests a further leg down is likely to complete a measured move.
A temporary retest of the broken trendline might occur before continuation down.
---
RSI (Relative Strength Index)
Currently around 31.83, nearing oversold territory, indicating the potential for:
A short-term bounce before further downside, or
A reversal near the key support zone.
---
Projection
The projection arrow (blue) suggests a bullish rebound from the 139.85 support zone.
This aligns with a potential buy opportunity once support is confirmed.
Mr SMC Trading point
---
Conclusion (Trade Idea Summary)
Short-Term Bias: Bearish
Medium-Term Setup: Look for a buy opportunity around 139.85, if price reacts well.
Key Steps:
1. Watch for price to reach 139.85.
2. Look for bullish reversal patterns or confirmations at that level (e.g., bullish engulfing, RSI divergence).
3. If confirmed, a potential long trade could target back toward the 144–145 zone.
Please Support boost this analysis )

USDJPY Analysis todayHello traders, this is a complete multiple timeframe analysis of this pair. We see could find significant trading opportunities as per analysis upon price action confirmation we may take this trade. Smash the like button if you find value in this analysis and drop a comment if you have any questions or let me know which pair to cover in my next analysis.

Risk, Rates, and Reversals: What’s Next for USD/JPY?CMCMARKETS:USDJPY FX:USDJPY USD/JPY rebounded slightly to 143.10 but remains under pressure after slipping from the 144.50 on BoJ-Fed divergence and rising geopolitical tensions. While the BoJ appears cautious about accelerating its balance sheet tapering beyond FY2026, it still signals further rate hikes amid persistent domestic inflation, offering the yen structural support.
Technically, price is reacting off the lower trendline TL2, aligned with the 142.30–142.40 significant support zone. This area has held multiple times in the past and may offer a bullish pullback toward the 143.80 or even 146.15 resistance zones. However, failure to break above these levels could expose USD/JPY to renewed downside toward the 140.89 demand base.
Short-term recovery depends on Friday’s NFP and risk sentiment around trade tensions. A break below 142.30 would invalidate the bullish rebound and open downside to support near 140.89.
Resistance : 143.87 , 146.14
Support : 142.36 , 140.89

Bullish Reversal on Risk-On Shift and Channel BreakoutCMCMARKETS:USDJPY USD/JPY surged as risk appetite returned after a U.S. federal court blocked President Trump's "Liberation Day" tariffs, undermining demand for safe-haven assets like the yen. Meanwhile, weak demand in Japan’s 40-year bond auction raised concerns over fiscal stability, adding further downside pressure to JPY. Technically, the pair broke above a downward channel and formed a bullish engulfing pattern near the 144.90 demand zone. If price consolidates above 145.00, a test of the 148.15 resistance zone is possible. Traders now eye upcoming U.S. GDP and PCE inflation data for direction on Fed policy.
Resistance : 148.14 , 148.67
Support : 144.90 , 144.42

USDJPY Analysis – Yield Support Signals Potential UpsideUSDJPY is currently sitting at a key support zone around 142.80–143.00, showing signs of a potential bullish reversal. This support area has previously acted as a strong launchpad for price rallies.
🟢 Technical Setup:
Price action has formed a clean higher low structure, bouncing off horizontal support.
The US10Y Treasury Yield (pink line) has rebounded sharply and is diverging to the upside — a leading indicator for USDJPY strength.
The Fib retracement from the last swing move aligns well with the 0% zone, suggesting the dip might be complete.
A bullish reaction from here targets the 148.50 zone, with intermediate resistance around 145.00–146.00.
🟠 Risk Levels:
Invalidated below 141.40 (structure break).
Stops could be placed below 142.00, targeting a 2:1 or better risk-reward ratio.
🔍 Macro-Fundamental Insight:
U.S. Yields are firming despite mixed Fed signals — this gives strength to USD, especially against low-yielders like the JPY.
BOJ remains dovish with no urgency to normalize rates, keeping the yen weak.
With risk appetite improving and bond yields lifting, carry trade dynamics favor USDJPY upside.
✅ Conclusion:
As long as US10Y yields remain firm and USD holds above 142.00, USDJPY has a strong probability of rallying toward 148.50. Look for confirmation with higher highs on the 4H chart and continued divergence between yield and price.

USDJPY Bearish Continuation Setup Trend Analysis
The market is in a clear downtrend, evidenced by the sequence of lower highs and lower lows.
The descending trendline has been respected multiple times, acting as dynamic resistance.
🧠 Key Technical Factors
Rejection Zone (Supply Area):
The marked “Rejection Point” aligns with the confluence of the trendline resistance, 50 EMA (red), and historical supply.
Price attempted to break above but faced a strong rejection—signaling institutional sell interest.
EMA Confluence:
50 EMA (142.993) and 200 EMA (144.063) are both sloping downward.
Price is trading below both EMAs, confirming bearish momentum and trend continuation bias.
BOS (Break of Structure):
Multiple BOS levels marked, showing a consistent pattern of structure breaks to the downside.
Each rally is met with selling pressure, failing to create new highs.
🧩 Projected Price Action
Current retracement could retest the trendline/50 EMA before a potential continuation move downward.
Expectation is a lower high formation near the descending trendline followed by a bearish impulse.
🏹 Bias: Bearish
Traders might consider short opportunities around the 142.90–143.00 zone, targeting 142.00 and below, with stops just above the trendline/supply zone.
⚠️ Risk Note
A clean break and close above the trendline and 50 EMA would invalidate this setup and could lead to a shift in structure.

USD/JPY Analysis: Bearish Bias with Multi-Market Confluence!📉 USDJPY Technical Breakdown – Yen Strength in Focus 📉
In this video, we take a close look at the USD/JPY, which is currently under pressure and trending to the downside 🔽. The bearish momentum is clear, but there are several key factors to consider before positioning ourselves for a potential short 📊.
🔍 First, it’s important to monitor the equity markets. If we start to see a pullback or sell-off in the stock indices 🏦📉, that could translate into further yen strength, adding weight to a USD/JPY short bias 💴💪.
Another key piece of confluence is comparing the DXY (Dollar Index) 📈 with the JXY (Japanese Yen Index) 📉. This gives us deeper insight into the relative strength of each currency and helps confirm our directional bias before entering a trade ⚖️.
🔁 Coming back to the USD/JPY chart, we’re watching for a retracement into a Fibonacci point of interest, which could provide a high-probability area to enter a sell setup. If price reacts from that level and confirms with structure, we could have a clean opportunity for continuation 🔂🎯.
⚠️ This is not financial advice — always conduct your own analysis and manage risk accordingly.

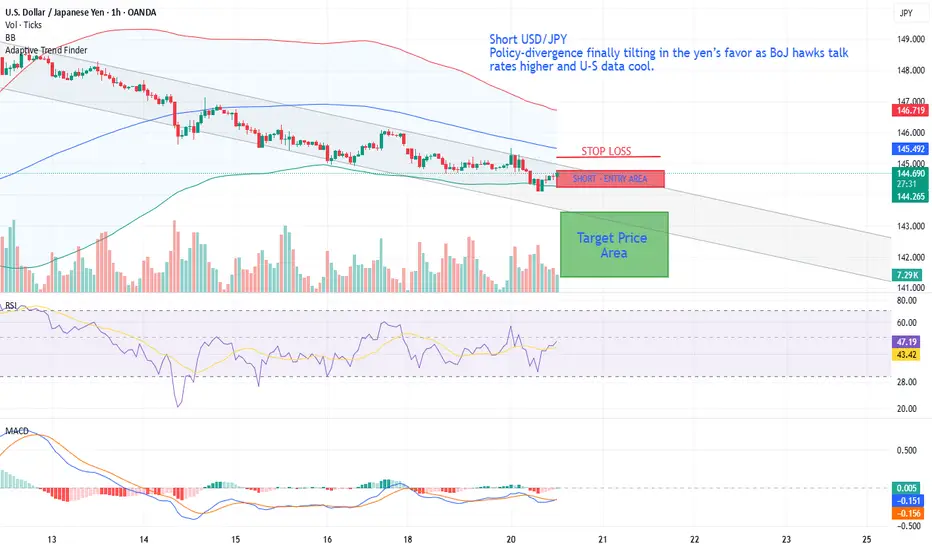
Short USD/JPYShort USD/JPY – policy-divergence finally tilting in the yen’s favor as BoJ hawks talk rates higher and U-S data cool.
• BoJ hawks signaling further 2025 hikes while Fed easing bets build → policy-divergence flips JPY-positive.
• Break & close below 38.2 % retracement and 200-SMA (H4) turns momentum south; hourly / daily RSI roll-over.
• Geopolitics easing removes safe-haven bid for USD, but not for JPY (BoJ still seen hiking).
• Bearish trigger deepens if 144.30 confluence (200-SMA H4 + 50 % Fib) gives way → air-pocket into 141s.
USD/JPY Breakdown: Sell the Rallies, Ride the TrendUSD/JPY has decisively shifted bearish across all key timeframes. On the daily chart, the pair broke below the 50-, 100-, and 200-day EMAs with consistent lower highs and lows. The hourly chart confirms this trend, with bearish EMA stacking and failed attempts to reclaim the 200-hour EMA. RSI remains under 50 across timeframes, signaling persistent bearish momentum without exhaustion.
The 15-minute chart highlights ideal short-entry setups on pullbacks to the 20- or 50-EMA, especially when RSI fails to breach 50. The 200-EMA on this timeframe acts as dynamic resistance near 145.30. Short entries are favorable on rallies to the 145.10–145.35 zone, with downside targets at 144.80, 144.50, and potentially 144.20.
For the week ahead, the strategy is clear: fade rallies into EMA resistance and use RSI confirmation for timing. Avoid chasing lows—wait for price to come to you. Tight stops just above the EMAs minimize risk, and partial profit-taking at swing lows allows for trend-riding flexibility.
As long as USD/JPY remains below the 200-hour EMA, bearish momentum dominates. Trade with the trend, manage risk with precision, and stay alert for breakdowns below key support levels.
