USDJPY IdeaThis is my current outlook on UJ.
*Disclaimer*
This is not financial advice. Forex trading is a risky business. Trade at your own risk. Practise proper risk management and patience.
#TradeLikeMagnatrio
Usdjpysetup

USDJPY SellUSDJPY looking for a sell
i'm currently testing a few things with regards to supply and demand nut not only this another pattern to which to trade from from out of a consolidation box
lets see how these play out next week
what are your thoughts......?


USDJPY is forming a correctional trendThe USDJPY is forming a correctional trend towards its major channel.
After crossing the MA 144 in a 1H time frame, it moves to the price range of 110.30.
110.30 is a price range in a 4H time frame.
Dear Traders, if you like this idea or have your own opinion about it, write in the comments. I will be glad

Trading Idea Regrading USDJPY Currency PairI tried To Make Every Thing Self Explanatory in The Chart

USDJPY Strong bearishAfter breaking the resistance line ( neckline ) in the four-hour time frame, we have a strong bearish move

Wednesday: USDJPY - Week 30Hello Traders! Check Related Idea for market context!!
I will update my idea as the trade progresses if any changes occur and my analysis is wrong, or need to be adapted to the new development of price-action.
Thanks for the support!
-----------------------------------------------------------------------------------------------------------------------
-----------------------------------------------------------------------------------------------------------------------
SMASH that follow button! 👍
💡 Leave a comment and/or message me on how I can improve and provide better content, I'm open to suggestions to create a better experience for you!
RISK DISCLAIMER: Please be advised that I am not telling anyone how to spend or invest their money. Take all of my videos as my own opinion, as entertainment, and at your own risk. I assume no responsibility or liability for any errors or omissions in the content of this channel. This content is for educational purposes only and is not tax, legal, financial, or professional advice. Any action you take on the information in this video is strictly at your own risk. We, therefore, recommend that you contact a personal financial advisor before carrying out specific transactions and investments. There is a very high degree of risk involved in trading. Past results are not indicative of future returns. Inotfancy.com and all individuals affiliated with this channel assume no responsibility for your trading and investment results.
Tuesday: USDJPY - Week 30Hello Traders! Check Related Idea for market context!
I will update my idea as the trade progresses if any changes occur and my analysis is wrong, or need to be adapted to the new development of price-action.
Thanks for the support!
-----------------------------------------------------------------------------------------------------------------------
-----------------------------------------------------------------------------------------------------------------------
SMASH that follow button! 👍
💡 Leave a comment and/or message me on how I can improve and provide better content, I'm open to suggestions to create a better experience for you!
RISK DISCLAIMER: Please be advised that I am not telling anyone how to spend or invest their money. Take all of my videos as my own opinion, as entertainment, and at your own risk. I assume no responsibility or liability for any errors or omissions in the content of this channel. This content is for educational purposes only and is not tax, legal, financial, or professional advice. Any action you take on the information in this video is strictly at your own risk. We, therefore, recommend that you contact a personal financial advisor before carrying out specific transactions and investments. There is a very high degree of risk involved in trading. Past results are not indicative of future returns. Inotfancy.com and all individuals affiliated with this channel assume no responsibility for your trading and investment results.
USDJPY: SIGNAL TRADING Market still bearish, Now I add more sell entry.
manage your leverage and be smart trader.
Good luck

Friday: USDJPY - Week 29Hello Traders! Check Related Idea for market context!! Looks like USDJPY is almost ready to go!
I will update my idea as the trade progresses if any changes occur and my analysis is wrong, or need to be adapted to the new development of price-action.
Thanks for the support!
-----------------------------------------------------------------------------------------------------------------------
-----------------------------------------------------------------------------------------------------------------------
SMASH that follow button! 👍
💡 Leave a comment and/or message me on how I can improve and provide better content, I'm open to suggestions to create a better experience for you!
RISK DISCLAIMER: Please be advised that I am not telling anyone how to spend or invest their money. Take all of my videos as my own opinion, as entertainment, and at your own risk. I assume no responsibility or liability for any errors or omissions in the content of this channel. This content is for educational purposes only and is not tax, legal, financial, or professional advice. Any action you take on the information in this video is strictly at your own risk. We, therefore, recommend that you contact a personal financial advisor before carrying out specific transactions and investments. There is a very high degree of risk involved in trading. Past results are not indicative of future returns. Inotfancy.com and all individuals affiliated with this channel assume no responsibility for your trading and investment results.

Wednesday: USDJPY 2 - Week 29Hello Traders! Check Related Idea for market context!!
I will update my idea as the trade progresses if any changes occur and my analysis is wrong, or need to be adapted to the new development of price-action.
Thanks for the support!
-----------------------------------------------------------------------------------------------------------------------
-----------------------------------------------------------------------------------------------------------------------
SMASH that follow button! 👍
💡 Leave a comment and/or message me on how I can improve and provide better content, I'm open to suggestions to create a better experience for you!
RISK DISCLAIMER: Please be advised that I am not telling anyone how to spend or invest their money. Take all of my videos as my own opinion, as entertainment, and at your own risk. I assume no responsibility or liability for any errors or omissions in the content of this channel. This content is for educational purposes only and is not tax, legal, financial, or professional advice. Any action you take on the information in this video is strictly at your own risk. We, therefore, recommend that you contact a personal financial advisor before carrying out specific transactions and investments. There is a very high degree of risk involved in trading. Past results are not indicative of future returns. Inotfancy.com and all individuals affiliated with this channel assume no responsibility for your trading and investment results.


USDJPY: TRADING SIGNAL - Time to continue sell againUSDJPY has broke the trend line, time to find another sell entry

USDJPY GOOD SELL SETUPUSDJPY has already broken the uptrend, and now it is retesting it and waiting for some bearish volatility.
I expect that USDJPY will go down starting from now to the targets in green lines.

UsdJpy- 110.50 is now resistanceAfter breaking under 110.50 support, UsdJpy has made a local low at 109.50
At this point, 110.50 will act as strong resistance and rallies to that zone should be sold

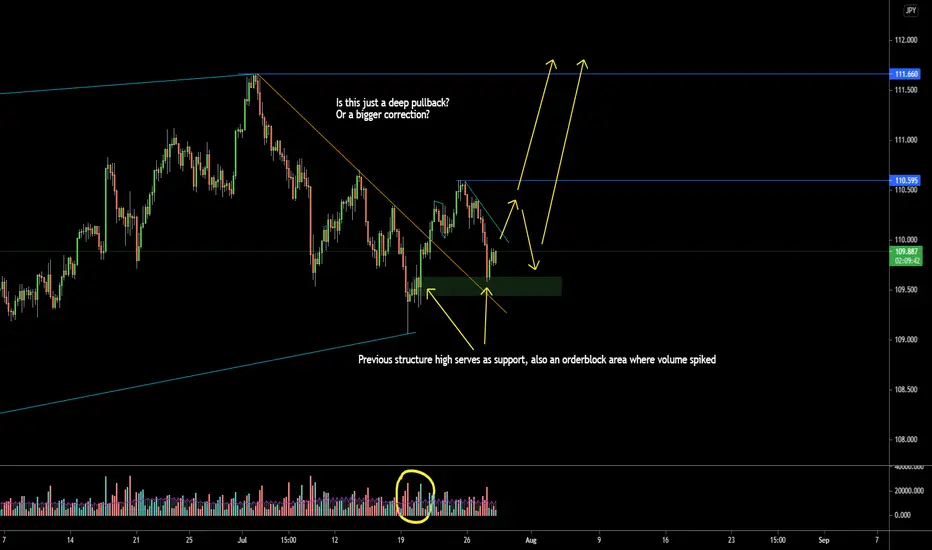
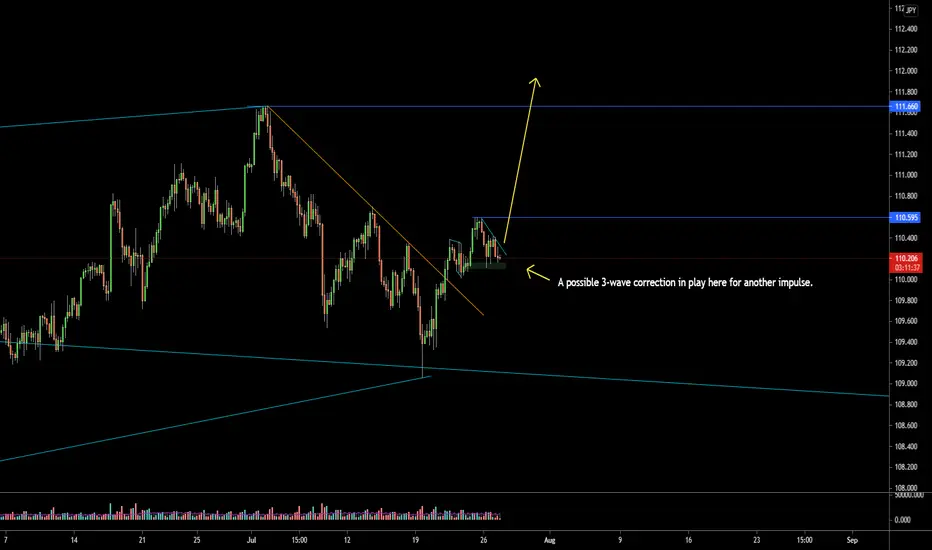
UsdJpy- Good R:R short term tradeAfter reaching a local high at 111.67, UsdJpy has corrected 100 pips and now is trading at strong confluence support.
I expect a new leg up from this pair and only a drop under support would negate this scenario

USDJPY continued bullish trendUSDJPY is moving upside creating higher highs and lows. Daily high was broken last week. My bias is upward unless it breaks structure of higher low. Target is at 112 area, a weekly global resistance.
Leave out a comment if you liked this idea.

USDJPY: Ready to short after price rejectUSDJPY is in ascending channel so we can take a short trade

USD/JPY Long Setup After Daily Confirmation To Catch 150 Pips !This is an educational + analytic content that will teach why and how to enter a trade
Make sure you watch the price action closely in each analysis as this is a very important part of our method
Disclaimer : this analysis can change at anytime without notice and it is only for the purpose of assisting traders to make independent investments decisions

USD/JPY New Long Setup To Create A New Higher High,Free 200 PipsThis is an educational + analytic content that will teach why and how to enter a trade
Make sure you watch the price action closely in each analysis as this is a very important part of our method
Disclaimer : this analysis can change at anytime without notice and it is only for the purpose of assisting traders to make independent investments decisions

USDJPY - Bearish Opportunities !Welcome to our Trade Setups - May 24th ( USDJPY ) !
SELL USDJPY
ENTRY LEVEL @ 108.753
SL @ 110.428
TP @ 103.719
Max Risk: 1% - 3%!
Risk/Reward Ratio: 3.01
Leave us a comment or like to keep our content for free and alive.
Have a great week everyone!

USDJPY: Will Grow +200 pips soonUSDJPY
will rise well by the end of 2021. it will be great to be able around 108, ofcourse your few should for a few month
Target 111 for 6 month
