SELL TRADE SETUP ON USDJPYHey Traders,
Check out this technical analysis on USDJPY.
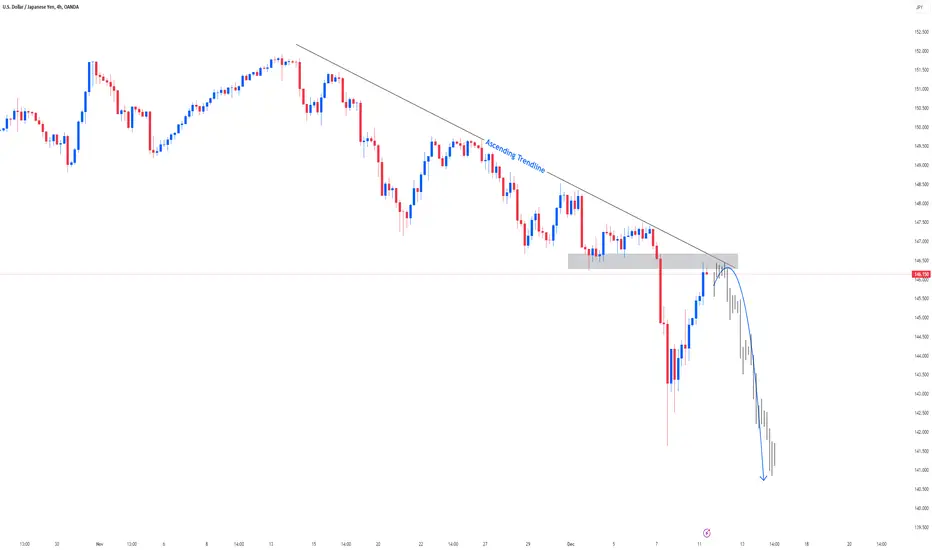
USDJPY is currently trading with bearish momentum, so anticipate a retest of the broken support level and consider entering SELL positions.
Keep a close eye on this; it could play out in either direction.
Usdjpyshort

Should i short USDJPY again?After pullback to broken broad channel, i think its time to short usdjpy again.
Trade safe.
Good luck.

Usd jpy sellHello, according to my analysis of USDJPY. It exists in a very negative state. The price broke the ascending channel, with the formation of a descending channel as shown in the analysis: All these factors confirm the sellers’ control over the market. More declines in the coming days. Good luck to everyone

USDJPY Scalp ShortUSD looks weak, actually USDJPY has made a pullback but looks now read to retest local low.

USDJPY - SHORT Price retraced correctionally and fail to break the resistance zone
Full video on my YT via the Link in my bio

USDJPY Shorts from 147.000 down to 140.000My breakdown for USDJPY this week involves sustaining its temporary bearish trend. Currently, the price has shown a bullish reaction at our identified Point of Interest (POI), resulting in a pullback to tap into a Daily supply zone above. Following this, our strategy involves anticipating a redistribution on lower time frames to facilitate selling opportunities, targeting the equal lows.
Considering the impact of NFP Friday on our demand, we await the formation of a correction to prolong the downward trend. In case the price opts for breaching equal lows first, our plan involves waiting for entry at the 7-hour demand zone, presenting an opportunity to buy at a more favorable price.
Confluences for USDJPY Sells are as follows:
- Price retraced from a 2-day demand and now slowly approaching a daily level of supply zone.
- Supply Zone is on the daily time frame that has also caused a Break of structure to the downside.
- Lots of liquidity to the downside in the form of equal lows, and major trendlines.
- Price needs to fill the imbalance as well which has been left from the supply zone.
- The dollar is also expected to be bearish so this pair is also projected to move in a similar way.
P.S. Since the price on the higher time frame couldn't surpass the all-time highs and experienced a significant sell-off, my expectation is that the price may continue its decline to target substantial liquidity below. Consequently, I am inclined to seek pro-trend trading opportunities to prolong this downward movement, aiming for the 140.000 mark.


UsdJpy want to move more!Looking for Impulse Down.
UsdJpy moving down soon. Make sure you have your own rules on RR and follow them. This is just a trading idea to help you/ give better knowledge. If you have any question ask me in comments.
Learn & Earn!
Wave Trader Pro

USDJPY → Drop to 144.000!? Or Fly back to 152.000? Let's Answer.USDJPY fell from the double top as predicted in last week's analysis, hitting my take profits all the way down to 147.120. Will there be more downside or are we ripe for a rip back to 152.000?
How do we trade this? 🤔
This analysis shows us three clean support areas: 146.000 (Bull Channel Support), 145.000 (Previous High), and 144.000 (200EMA). It's reasonable to zoom into small timeframes and look for short scalp setups down to those levels. Since the macro trend is bullish, I would be careful to hold any shorts now that the gap from 152.000 has closed the majority of the way. The RSI is still below the moving average and has *some* room to fall, supporting the short-term bear bias.
Long-term, look to get long! We'll need a strong show of support with a bull signal bar and confirmation candle closing on or near its high and for the RSI to head upward breaking above the Moving Average.
💡 Trade Ideas 💡
Short Entry: 146.850
🟥 Stop Loss: 150.000
✅ Take Profit: 143.700
⚖️ Risk/Reward Ratio: 1:1
Long Entry: 145.500
🟥 Stop Loss: 143.200
✅ Take Profit: 150.100
⚖️ Risk/Reward Ratio: 1:2
🔑 Key Takeaways 🔑
1. Bull Channel, Bias to Long.
2. Double Top Reversal Signal. Still Gaps to Fill.
3. Wait for Support at Channel Support, Previous High, or 200EMA.
4. Previous Channel High of 145.000 Final Target.
5. RSI at 35.00, below Moving Average. Supports Short-term Short, Long-Term Long.
⚠️ Risk Warning! ⚠️
Past performance is not necessarily indicative of future results. You are solely responsible for your trades. Trade at your own risk!
Like 👍 and comment if you found this analysis useful!

There is a very good potential for usdjpy to dropIn the daily time frame, the price has reached its resistance
In the 4-hour time frame, the price has broken its long-term uptrend line that started on July 14, 2023.
For better confirmation, it needs to break the price of 148.900, but in this current area, it is also a good signal for a sell position to the price of 145.900.

Tipping Point: Are We Poised for a Breakthrough or Breakdown?This pair is at a crucial point. What happens here will set its course for the next few months or even longer.
Last week, it went above 150, but then there was a big drop. It seems the Bank of Japan (BOJ) stepped in, just like they did last year. When they did that last year, the price dropped over 2,000 pips in the following months. Will the same thing happen again?
The 152 mark is a significant resistance level. If the we manages to break and get a weekly or monthly close above this level, it could pave the way for a rally towards the Monthly SUPPLY/SELL zone at 157.
Given the circumstances, such as ten consecutive weeks of the market reaching new highs and recent BOJ interventions, I don't see this happening for now anyhows. I believe that buying this pair at current levels is risky. Though I do anticipate another attempt to breach the 150 mark, perhaps even surpassing last week's high, before an imminent sell-off.
I'll be using the TRFX king indicator to spot sell signals on the 4-hour to daily charts, especially as the market nears or exceeds 150. My stop-loss will be set slightly above 152.
If this rally does not occur I will wait for the break lower and then enter on the first sell signal on the first pull back.
First target that should be easily hit is 145 ,this should act as some sort of support and could be an area for buyers to regroup and try to push for a move to break 152 (I don't see this happening though this is trading anything can happen)
If the pair dives below 145, it could signify an even deeper correction, potentially below 140. Further sell-offs, potentially triggered by the BOJ altering their negative rate policy, could lead to rapid unwinding of carry trade positions.
To sum it up, I believe entering buying positions at current levels is very risky and if you are looking to buy I would wait for pull backs towards 145. In contrast, a sell position seems to offer a more attractive risk-reward proposition and has the potential to result in a substantial trade.

USD-JPY - KEYLEVELSUSD-JPY - KEYLEVELS
These are my Keylevels .
Nothing bullish here yet, maybe a discount zone?

UDSJPY - Short from bearish order block ✅Hello traders!
‼️ This is my perspective on USDJPY.
Technical analysis: Here we are in a bearish market structure from 4H timeframe perspective, so I am looking for short. I want price to continue the retracement to fulfill the imbalance higher and then to reject from bearish order block + institutional big figure 148.000.
Like, comment and subscribe to be in touch with my content!

#USDJPY Wait For ConfirmIn the 4-hour timeframe, it is placed in the corner pattern, but in the resistance zone, it is unlikely that we will have a break in the upward direction. If confirmed, it can continue the correction until the specified zone. Due to the positive divergence in the bottom, it can have a high, but with negative momentum, it can enter the sell position in 4 hours with a confirmation candle.

USDJPY - SHORTUSDJPY has been in a strong downtrend since last week, it has now breakout of a correctional move anticipating futher drop.

USDJPY: How to trade more downside from the double topIf the double top on the weekly chart is going to hold, then there should be a good amount more downside in USD/JPY. If it doesn't - we'll exit this trade.
149 was a key breakdown area - in case of a rebound we can enter short.
A close above 149 probably nullifies this trade.
145 is the key target.

USDJPY: November CPI data in the Tokyo area exceeded the BoJ's 2Recent data shows inflation has eased since October:
CPI (excluding fresh food and energy): 3.7%
Total CPI: 3%
Inflation in Tokyo, although exceeding 2%, is still slightly lower than forecast
FX Update: USD/JPY edged 15bp higher to around 147.25 after this data

USDJPY I Fed expectations soft thus more potential downsideWelcome back! Let me know your thoughts in the comments!
** USDJPY Analysis - Listen to video!
We recommend that you keep this pair on your watchlist and enter when the entry criteria of your strategy is met.
Please support this idea with a LIKE and COMMENT if you find it useful and Click "Follow" on our profile if you'd like these trade ideas delivered straight to your email in the future.
Thanks for your continued support!

Bearish target for USDJPYAs it is clear from the chart, the overall daily trend of USDJPY is bearish. The equal lows at 147.2 has been hit so i expect the equal lows and FVG near 144 would be the next target for bearish trend of USDJPY

USDJPY - Long active ✅Hello traders!
‼️ This is my perspective on USDJPY.
Technical analysis: Here we are in a bullish market structure from higher timeframe perspective, so I am looking for longs. I expect bullish price action from here as price took sell side liquidity from old low, filled the imbalance and rejected from bullish order block.
Like, comment and subscribe to be in touch with my content!

Dollar Yen - Current Trend
Dollar Yen is currently in a downtrend. It has recently been rejected from a recent high of 147.770 to a recent low of 146.875.
I will place a sell-stop order below the counter trend line at 146.929 and aim for a 3X profit target at 145.101.
