USD/JPY Bearish Flag (30.06.2025)The USD/JPY Pair on the M30 timeframe presents a Potential Selling Opportunity due to a recent Formation of a Bearish Flag Breakout Pattern. This suggests a shift in momentum towards the downside in the coming hours.
Possible Short Trade:
Entry: Consider Entering A Short Position around Trendline Of The Pattern.
Target Levels:
1st Support – 143.40
2nd Support – 142.86
🎁 Please hit the like button and
🎁 Leave a comment to support for My Post !
Your likes and comments are incredibly motivating and will encourage me to share more analysis with you.
Best Regards, KABHI_TA_TRADING
Thank you.
Disclosure: I am part of Trade Nation's Influencer program and receive a monthly fee for using their TradingView charts in my analysis.
Usdjpyshort

SELL: USDJPY 144.75 Trade Recommendation – 1H Chart🎯 Trade Setup:
Sell Entry Zone: 144.75 – 144.78
Stop Loss (SL): 145.15
Take Profit (TP): 142.60
Risk:Reward Ratio (R:R): Approx. 1:4 → Excellent for swing or intraday setups
📊 Technical Analysis Breakdown:
1. Strong Resistance Zone – High Reversal Probability:
The 144.75–144.78 zone:
A clear historical resistance area with multiple rejections in the past
Converges with the SMA 89 (red line) → acts as a strong dynamic resistance
Price has consistently formed lower highs around this region → showing selling pressure is building
2. Volume Analysis – Distribution Signals:
Volume slightly increased as price approached the resistance but did not accompany a breakout
No “breakout volume” → Indicates possible distribution phase, not accumulation → Favoring SELL positions
3. Price Action & Pattern:
The structure is forming lower highs – a key sign of bearish momentum
After the sharp rejection from the 145.22 zone (June 26), the market has shifted toward a bearish correction cycle
4. Target Area – Key Support:
142.60 is a well-defined support level:
Matches a previous major low
Corresponds with a high-liquidity zone from prior trading sessions
Ideal area to take profit before any potential bounce
⚠️ Risk Management Notes:
Trade confirmation increases if you see bearish candlestick signals (e.g., bearish engulfing, pin bar) in the entry zone
Exit immediately if price breaks and closes above 145.15 with strong volume – that invalidates the bearish setup

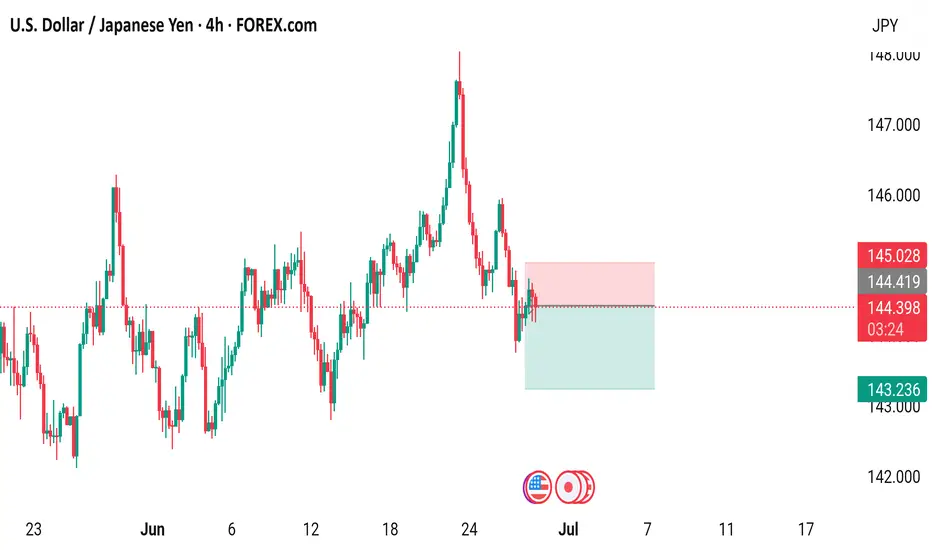
USD/JPY 4-Hour Forex Chart4-hour performance of the U.S. Dollar (USD) against the Japanese Yen (JPY) from FOREX.com, showing a current exchange rate of 144.351 with a slight decrease of 0.063 (-0.04%). The chart highlights a recent sharp upward movement followed by a decline, with key support and resistance levels marked around 144.419 and 145.028, respectively. The time frame spans from late June to early July 2025.
USD/JPY) bearish Trand analysis Read The captionSMC trading point update
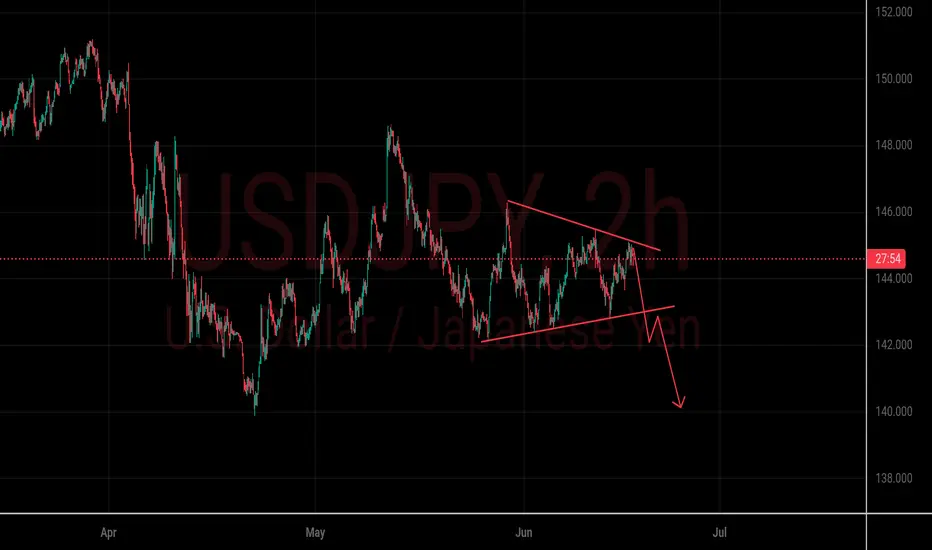
Technical analysis of USD/JPY on the 3-hour timeframe, highlighting a breakdown from trendline resistance and projecting a move toward a significant downside target.
---
Technical Breakdown
1. Trendline Rejection
Price sharply rejected from the descending resistance trendline near 148.00 (red arrow), forming a potential lower high.
This suggests continuation of the broader downtrend structure.
2. Break Below EMA 200
Price has broken below the 200 EMA (144.752), signaling a shift in momentum from bullish to bearish.
EMA is likely to act as dynamic resistance if price attempts a pullback.
3. Bearish Projection
The chart outlines a measured move downward toward the target point at 139.955, implying a drop of over 5.36% (approximately 770 pips).
The projected path shows lower highs and lower lows, confirming bearish structure.
4. RSI Confirmation
RSI (14) is currently at 29.98, indicating oversold conditions, but this often supports strong momentum in trending markets—suggesting a possible continuation lower after minor retracements.
Mr SMC Trading point
---
Conclusion / Idea Summary
Bias: Bearish
Entry: After trendline rejection and EMA 200 break (~144.75)
Target: 139.955
Invalidation: Break above 148.00 resistance trendline
---
Please support boost 🚀 this analysis)

Fundamental Market Analysis for June 25, 2025 USDJPYEvents to pay attention to today:
17:00 EET.USD - Fed Chair Jerome Powell will deliver a speech
17:30 EET.USD - Crude oil inventory data from the Department of Energy
USDJPY:
The Japanese yen (JPY) remains in the lead against the US dollar during Wednesday's Asian session and remains close to the weekly high reached the day before, amid a combination of favourable factors. The summary of opinions from participants at the Bank of Japan (BoJ) meeting in June showed that some policymakers called for interest rates to be kept unchanged due to uncertainty about the impact of US tariffs on the Japanese economy. In addition, the fragile truce between Israel and Iran and trade uncertainty are supporting the Japanese yen as a safe-haven currency.
Meanwhile, investors seem convinced that the Bank of Japan will raise interest rates again amid mounting inflationary pressure in Japan. These forecasts are confirmed by Japan's producer price index (PPI), which rose for the third consecutive month in May and remained above 3% year-on-year. In contrast, traders are factoring into their prices the likelihood that the Federal Reserve (Fed) will further lower the cost of borrowing this year. This, in turn, is causing US dollar (USD) bulls to tread cautiously and suggests that the path of least resistance for the lower-yielding Japanese yen remains upward.
Trading recommendation: SELL 144.900, SL 145.100, TP 144.000

USDJPY H4 AnalysisUSDJPY Showing a Bearish Flag. If it breaks this zone above, Most probably can fly up to 148.668 and higher to 150.538. If no, Can rally between 143.981 or even lower to 142.410. Trading Analysis from 23-06-25 to 27-06-25. Take your risk under control and wait for market to break support or resistance on smaller time frame. Best of luck everyone and happy trading.🤗

USD/JPY 2-Hour Forex Chart2-hour candlestick chart from FOREX.com displays the exchange rate between the U.S. Dollar (USD) and the Japanese Yen (JPY). The current rate is 145.513, with a slight increase of +0.074 (+0.05%). The chart shows price movements over the past 2-hour period, with a notable upward trend followed by a recent decline, as highlighted by the shaded area indicating a potential resistance or reversal zone. Key levels such as 145.701 and 145.106 are marked, along with the current time of 04:00.

USD/JPY) Bearish reversal analysis Read The captionSMC trading point update
Technical analysis of USD/JPY 3-hour chart suggests a bearish reversal setup, based on smart money concepts (SMC), resistance rejection, and price action structure. Here's a full breakdown:
Technical Breakdown – USD/JPY
Big Resistance Zone (~145.800–146.300):
Price has tapped into a major resistance zone (yellow box) twice (highlighted with red arrows).
Both rejections indicate strong seller interest.
The latest candle structure shows clear rejection wick, signaling weakness at resistance.
---
Bearish Bias Confirmation:
Bearish structure forming after the second rejection.
Break of the rising trendline could accelerate selling pressure.
A measured move projection (-2.58%) aligns the downside target with the support level at ~142.144.
---
Support Zone (~141.800–142.400):
Marked as the likely target zone.
Historically acted as a strong bounce area (visible from late May to early June).
Completion of ABC bearish structure aligns here.
---
Indicators & Tools:
200 EMA (144.419): Price currently slightly above it — watching for a close below to strengthen bearish view.
RSI (14): Shows signs of bearish divergence and cooling off from overbought (was above 70 previously).
Volume spike during the rejection suggests institutional selling.
Mr SMC Trading point
---
Forecast Summary:
Bias: Bearish toward 142.144
Entry Idea: Look for confirmation of breakdown below trendline (~145.00)
Invalidation: Strong bullish close above 146.300 would break this idea.
---
Please support boost 🚀 this analysis)

USDJPY Bearish BreakdownChart Overview
The USDJPY pair on the 2-hour chart is currently forming a descending triangle pattern — a typical bearish continuation setup.
---
Key Observations:
Resistance Line (Upper Trendline): Price is repeatedly rejected from lower highs.
Support Line (Lower Horizontal): Price maintains support around the 144.00–144.20 region.
Bearish Bias: The red arrow projection suggests a breakdown from the triangle, with a potential move toward 140.00 if the lower support fails.
---
Potential Bearish Scenario:
1. Break below ~144.00 confirms the triangle breakdown.
2. First target around 142.00, second target near 140.00.
3. Stop-loss ideally above 145.00 if entering short.
---
Disclaimer:
This analysis is for educational purposes and not financial advice. Always perform your own due diligence or consult a financial advisor before making trading decisions.
USDJPY Swing trade Signal for the Sell Once in a while we like to give a free signal. So here is one of the many trades we will have running for our subscribers.
Wait for the 1 hour candle to close below the Entry, and then a response to our entry, then you can sell.
Remember the rules, and remember your risk/reward
USDJPY Sell
🦇Entry: 143.525
⚠️Sl: 145.036
✔️TP1: 142.153
✔️TP2: 140.346
✔️TP3: 138.109
Happy trading. Any problems feel free to contact me, as over 10 years as a professional trader I can assure you there is no such thing as a stupid question.
Best,
Sarah

USD/JPY) Bearish trend analysis Read The ChaptianSMC trading point update
Technical analysis iUSD/JPY on the 30-minute timeframe, showing a rejection from resistance zones and a potential move toward lower support levels.
---
Analysis Breakdown
Technical Components:
1. Resistance Zones:
Primary Resistance: Near 145.500 (upper yellow box), which has previously been rejected multiple times (red arrows).
FVG (Fair Value Gap) Resistance Level: Around 144.400, also acting as strong resistance, especially near the EMA 200.
2. Downtrend Line:
The price is moving below a downward trendline, respecting bearish structure.
Last rejection from both the trendline and FVG zone confirms selling pressure.
3. EMA 200 (144.075):
Price is hovering around this level, showing indecision.
Bearish bias remains unless price breaks and holds above it.
4. Target Zone:
A clearly marked support level around 142.543, shown as the bearish target.
Includes multiple event markers (potential news catalysts or key dates), suggesting added volatility.
5. RSI (14):
Currently near 55.23, with a prior rejection from higher RSI levels.
Bearish divergence not clear, but no overbought conditions.
---
Bearish Idea Summary:
Thesis: Rejection from resistance zones + trendline + EMA suggests continuation to downside.
Expecting: Price to either:
Retest the upper resistance zone (around 145.000–145.500) and reject again, or
Break below current levels and continue lower toward 142.543.
---
Trade Idea Concept:
Entry Option 1: Sell on confirmed rejection from FVG zone or upper resistance.
Entry Option 2: Sell on break and retest below 144.000.
Target: 142.543 (support zone).
Stop Loss: Above the resistance zone or trendline (e.g., >145.600).
Mr SMC Trading point
Risks to Watch:
Invalidation: Clean break and close above 145.500 would invalidate the bearish setup.
News Impact: Note the icons near the target zone – monitor economic releases around that time.
---
Please support boost 🚀 this analysis)

The US dollar retreats as the Japanese yen stages a resurgence.The USD/JPY has continued to decline, hitting a low of around 143.50 during the European session, marking a new weekly low. In terms of exchange rate dynamics, the key support level lies at 142.500, which has withstood multiple tests recently without being breached. A valid break below this level would open up further downward space, with the next support to be monitored at 141.78 (lower Bollinger Band). On the upside, resistance is seen near 145.500, a level that has repeatedly formed phased highs and suppressed price rebounds.
Humans need to breathe, and perfect trading is like breathing—maintaining flexibility without needing to trade every market swing. The secret to profitable trading lies in implementing simple rules: repeating simple tasks consistently and enforcing them strictly over the long term.

USD/JPY) bearish Technical Analysis Read The captionSMC trading point update
Technical analysis of USD/JPY (U.S. Dollar vs. Japanese Yen) on the 4-hour timeframe. Here's a breakdown of the analysis:
---
Trend & Price Action
The chart shows a descending trendline connecting recent lower highs, indicating a downtrend.
Current price: 143.548
Price has recently rejected off the trendline and started to fall, suggesting continued bearish momentum.
A red arrow marks the rejection point, emphasizing a key resistance area.
---
Technical Indicators
EMA 200 (Exponential Moving Average): At 144.459 — the price is currently below the EMA, reinforcing the bearish outlook.
RSI (Relative Strength Index):
RSI (14) values: around 35.45, which is near the oversold threshold (30) but not quite there yet.
Indicates increasing bearish momentum but no reversal signal yet.
---
Support Levels Identified
1. Support Level (Target 1): ~142.280
First target point for bears. Likely to see some reaction or consolidation here.
2. Big Support Level (Target 2): ~140.382
A stronger, more significant support zone and a deeper bearish target if the first support breaks.
---
Bearish Target Scenario
The projected path (in black lines) suggests:
A further drop into the 142.280 zone.
If that breaks, a continuation toward the 140.382 level.
This suggests a swing trade setup favoring short positions if the price respects the current rejection zone.
Mr SMC Trading point
---
Conclusion
Bias: Bearish
Resistance Confirmed: Rejection from descending trendline and below EMA200.
Bearish Targets:
Short-term: 142.280
Medium-term: 140.382
Risk Management: Watch RSI for potential bullish divergence near the second support zone, which could indicate reversal or consolidation.
---
Please support boost 🚀 this analysis)

Current USD/JPY Trend Analysis and Trading RecommendationsOn Wednesday, the USD/JPY attracted buyers for the second consecutive day, trading near 145.20 in the early European session, close to a two-week high. Japan's May CGPI rose 3.2% YoY, the slowest pace since September last year, potentially easing BOJ rate hike pressure and weakening the JPY. Additionally, optimism over a framework agreement in U.S.-China trade talks dented the JPY's safe-haven appeal. Technically, the price holds above the 200-period SMA on the 4-hour chart and breaches the 145.00 psychological level, with oscillators tilting bullish. A valid break above 145.30 (Tuesday's high) would confirm the bullish setup, targeting the 146.00 integer mark and 146.25-146.30 resistance zone.
USDJPY
buy@145.000-145.200
tp:145.600-146.000

#USDJPY: +2000 PIPS Big Swing Move! Do not miss outThe cryptocurrency’s price is currently experiencing bearish pressure, and the current trading price is pivotal for determining its future trajectory. A smooth downtrend is anticipated, potentially propelling the price to 124 in the long term. The US dollar is likely to remain bearish, potentially reaching 95 in the US currency index. Three potential target sets are envisaged, and further updates will be provided based on price developments.
Best of luck and ensure safe trading practices.
Team Setupsfx_

Will the USD/JPY exchange rate fall toward 142?During the European session, USD/JPY continued its downward trend, falling 0.52% on the day to 144.108, technically pressured below the 50-day moving average of 144.412. Meanwhile, news that the Japanese government is considering repurchasing ultra-long-term government bonds has triggered a repricing of the Japanese government bond yield curve, significantly increasing market volatility. The 144 level has become a pivotal battleground for bulls and bears. Two scenarios need to be watched out for: if the Bank of Japan (BOJ) delays policy adjustments and the Federal Reserve maintains a hawkish stance, USD/JPY may rebound to test 146; conversely, if the bond repurchases coincide with the BOJ extending its easing policy, the yen could stage a periodic rally to the 142 range.
Humans need to breathe, and perfect trading is like breathing—maintaining flexibility without needing to trade every market swing. The secret to profitable trading lies in implementing simple rules: repeating simple tasks consistently and enforcing them strictly over the long term.

USDJPY:800+ PIPS Dropping Well Since Our First Idea!Dear Traders,
Since we posted our idea when price was trading at 158 we told you that this will be a massive dropped and since then price has proven us right, now we think there is another big drop is on the way. Please use proper risk management while trading.

USD/JPY Trapped in Consolidation QuagmireDuring the European session, the USD/JPY exchange rate oscillated around 143.10, extending the consolidation pattern triggered by the weak US dollar overnight. Influenced by the worse-than-expected US May ADP and ISM services data, the US Dollar Index fell to a six-week low of 98.60, and the USD/JPY rate also hit a low of 142.53. Subsequently, it rebounded slightly supported by the stable results of Japan's 30-year government bond auction and the decline in yields. Currently, the market is widely focused on the upcoming US May Non-Farm Payrolls (NFP) report and is reassessing the path of the Federal Reserve's monetary policy outlook.
Humans need to breathe, and perfect trading is like breathing—maintaining flexibility without needing to trade every market swing. The secret to profitable trading lies in implementing simple rules: repeating simple tasks consistently and enforcing them strictly over the long term.

USD/JPY) breakout bearish trand analysis Read The captionSMC trading point update
Technical analysis of the USD/JPY (US Dollar / Japanese Yen) pair on a 2-hour timeframe. Here's the idea behind the analysis:
---
Overall Idea: Bearish Move Toward Support
---
Key Levels
Resistance Zone (Yellow Box, Top): Marked with two red arrows — shows strong price rejection around 146.00–147.00 area.
Support Zone (Yellow Box, Bottom): Around 139.85, marked as a target point and support level.
These two zones form the range in which price has been reacting.
---
Current Price Action
Price is currently trading at 142.649, well below the 200 EMA (at 144.190), which is a bearish signal.
It has broken below the mid-range and seems to be heading toward the lower support zone (139.85).
---
Trend & Structure
The price is following a downward trend after rejecting from the resistance zone.
The channel suggests a further leg down is likely to complete a measured move.
A temporary retest of the broken trendline might occur before continuation down.
---
RSI (Relative Strength Index)
Currently around 31.83, nearing oversold territory, indicating the potential for:
A short-term bounce before further downside, or
A reversal near the key support zone.
---
Projection
The projection arrow (blue) suggests a bullish rebound from the 139.85 support zone.
This aligns with a potential buy opportunity once support is confirmed.
Mr SMC Trading point
---
Conclusion (Trade Idea Summary)
Short-Term Bias: Bearish
Medium-Term Setup: Look for a buy opportunity around 139.85, if price reacts well.
Key Steps:
1. Watch for price to reach 139.85.
2. Look for bullish reversal patterns or confirmations at that level (e.g., bullish engulfing, RSI divergence).
3. If confirmed, a potential long trade could target back toward the 144–145 zone.
Please Support boost this analysis )

Japanese Yen to Da Moon!I compared the yen to every single currency pair and USDJPY is the most volatile. BOJ will raise interest rates to 0.75%-1% by late 2025/early 2026. And IF the FED chooses to lower rates that will further exacerbate Yen strength.
103.156 TP, but TBH I see price breaking well past that point and yen will make new all time highs. The dollar will get desecrated across all currencies, the yen will destroy it the hardest. Most likely BTC will also peak around this same time period and youll see and end to the bull cycle and we will enter BTC bear cycle but that is beside the point.
Potential Black Swan Event: the US enters into a recessionary environment, while I dont think this is likely bc everyone is saying that, it will be possible if we see a further escalation in the Ukraine conflict or if the US chooses to enter war with Iran. War is the only situation I see potential US recession.
I predicted then yen would get dusted during COVID, now I predict yen will make never seen before gains for the next 5 years minimum. Let's see how this plays out.

Fundamental Market Analysis for June 4, 2025 USDJPYEvents to pay attention today:
17:00 EET. USD - ISM Services Business Activity Index
15:15 EET. USD - ADP Employment Change
USDJPY:
The Japanese yen (JPY) is attracting some intraday buyers after falling against the US dollar during the Asian session, and, at least for now, it seems that its pullback from the weekly high reached yesterday has paused. An upward revision of Japan's services business activity index, as well as expectations that wage growth will lead to faster inflation, leave open the possibility of another interest rate hike by the Bank of Japan (BoJ) in 2025. In addition, ongoing geopolitical risks and trade uncertainty are key factors supporting the JPY.
Meanwhile, cautious statements by BoJ Governor Kazuo Ueda on Tuesday sparked speculation that the next interest rate hike will not happen anytime soon. However, this still differs significantly from expectations that the Federal Reserve (Fed) will cut rates by at least 25 basis points (bps) by the end of this year. This, along with concerns about the US budget, is causing a new wave of selling of the US dollar (USD) after Tuesday's decent rebound from a six-week low and is putting some pressure on the USD/JPY pair during the Asian session.
Trading recommendation: SELL 144.20, SL 144.40, TP 143.20

UsdJpy could break 142 and fall 500 pipsSince early May, I’ve been highlighting the 142 support zone on USDJPY as a potential reversal area — with a suggested upside target at 146.
The market respected this level twice, reversing from 142 and rallying past 146 both times.
However, last week’s move into 146 was sharply rejected, forming a strong daily Pin Bar exactly at resistance — a classic sign of exhaustion.
Now, price is rolling back toward support, and after multiple tests of the 142 zone, we may be very close to a downside break.
🧩 Add to this the fact that DXY also looks ready to break lower, and the probability of a USDJPY fall increases even more.
📉 Trading Plan:
Sell rallies, with invalidation above 146, and a target at 137, aiming for a 1:2 risk-reward setup.
Disclosure: I am part of TradeNation's Influencer program and receive a monthly fee for using their TradingView charts in my analyses and educational articles.

Prices are testing the 142.55 support level.Bank of Japan (BOJ) Governor Kazuo Ueda stated on Tuesday that the central bank would raise interest rates if the economy re-accelerates, adding that wage growth must regain momentum. Currently, Trump's tariff policies have dimmed the economic outlook, making it potentially not the optimal time for a rate hike. However, policymakers stand ready to raise rates if the economy rebounds after a brief pullback. The remarks bolstered the Japanese yen, with prices now testing the 142.55 support level. A decisive break below this level would form a lower low, confirming the continuation of the downtrend and shifting bearish targets toward the 140.01 support level.
Humans need to breathe, and perfect trading is like breathing—maintaining flexibility without needing to trade every market swing. The secret to profitable trading lies in implementing simple rules: repeating simple tasks consistently and enforcing them strictly over the long term.
Trading Strategy:
sell@144.50-145.00
TP:143.00-142.50
