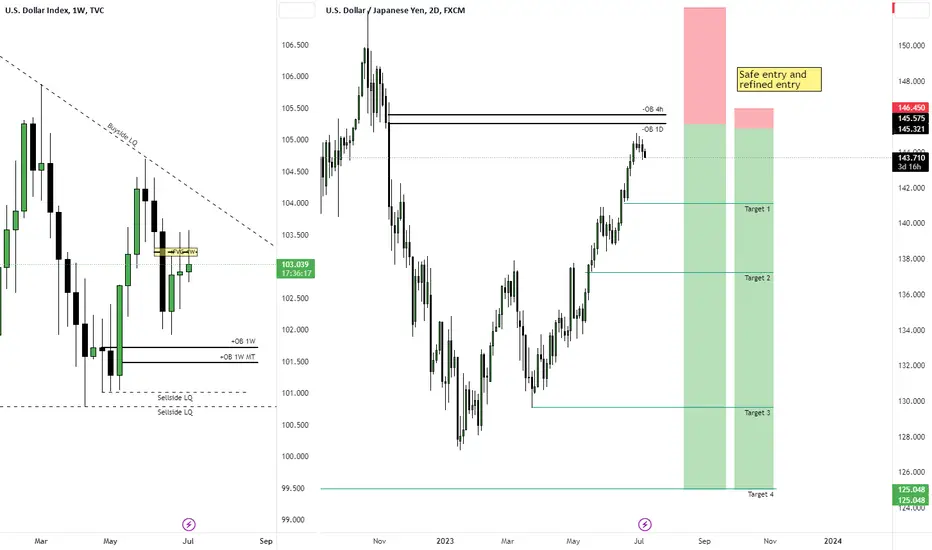
USD/JPY - Short SetupHere is a short setup on UJ.
There should be at the very least some sort of retracement to hit the targets, if not all of them. There is a safe entry and refined entry, depending if you want to wait for lower timeframe confirmations.
#NFA
Happy Trading!
R2F
Usdjpyshort
GBPJPY Sell Idea ??? A detailed Technical and Pictorial AnalysisHello Traders !!!
Today, we will delve into the topic of JPY buying, exploring it from both fundamental and technical perspectives. It has come to our attention that many traders, excluding large investors and major players in the Forex market, are perplexed by the significant selling pressure on JPY. The answer to this question is rather straightforward: the Bank of Japan (BoJ) is not providing substantial support to JPY. When compared to other central banks, the BoJ fails to offer enticing incentives to investors. If this trend continues in the future, it will undoubtedly inflict further damage upon the value of JPY.
Technical Analysis
GBPJPY is currently displaying a strong uptrend from a technical standpoint, and there is optimism that it will easily reach targets of 190 and 196. However, caution is warranted at these key levels, as indicators in higher timeframes indicate significant overbought conditions. Furthermore, it is highly probable that JPY intervention will occur at these crucial levels, with a stronger connection to the USDJPY pair. Therefore, it is crucial to closely monitor the levels of USDJPY. If USDJPY surpasses the 150-152 range, the Bank of Japan (BoJ) will undoubtedly intervene in the Forex market. Hence, those interested in trading GBPJPY must also pay close attention to the key levels of USDJPY. Below I am mentioning some levels to trade GBPJPY.
First Trade Setup :
Sell level: 189.5-190.5
stop loss: 191.950
Take profit: 187.650
Second Trade Setup :
Sell level: 195-196.2
stop loss: 197.57
Take profit: 192.240
Third Trade Setup :
Sell level: 199.65-200.87
stop loss: 201.98
Take profit: 196.7, 192.87, 188.10
Long trade Setup :
open long position from 190 and 196 zone
stop loss: 210.500
take profit : 181.57
Fundamental Analysis :
When discussing fundamentals, it is notable that all central banks are adopting strict monetary policies and raising interest rates in response to inflationary pressures. As inflation continues to surge, these banks are implementing robust measures to maintain it within acceptable bounds. However, in stark contrast, the Bank of Japan (BoJ) is displaying a lack of action when compared to its counterparts and maintaining an accommodative monetary stance. This behavior from the BoJ is detrimental to the value of JPY. Therefore, it is advisable to trade JPY pairs cautiously, particularly at key levels, as the BoJ has been repeatedly issuing verbal warnings regarding potential intervention. Now, let us analyze the possibility of intervention.
Analyzing the Possibility of Intervention
The probability of intervention is widely debated among experts, who argue that concerns regarding intervention are currently unsubstantiated. According to their analysis, Tokyo is expected to limit its actions to verbal warnings this year. Several points support this perspective:
Costly nature of intervention: Japan intervened in the market last year to strengthen the yen, marking the first intervention since 1998. In previous instances, authorities had intervened to prevent the rise of the JPY, which could harm the export-oriented economy. The process of strengthening the yen through intervention is complex and expensive. To increase the exchange rate, the Ministry of Finance issues short-term bills, raising the cost of the currency, which are then sold to weaken the JPY. On the other hand, weakening the yen requires using foreign exchange reserves to exchange dollars for yen. Continuously buying currency to prevent its decline would deplete Japan's monetary reserves. Unlike selling off JPY, where Tokyo can essentially create an unlimited supply of yen, there are limitations to buying back the currency. Approximately 6.35 trillion yen (around $43 billion) was spent on supporting the yen last year. Considering this, it is unlikely that the authorities will engage in large-scale intervention this year and may instead hope for a minor and temporary retreat in the USD/JPY pair.
Absence of consumer pressure: Throughout history, the Japanese government has never chosen to intervene to strengthen the yen during periods of low public dissatisfaction. A weak currency generally leads to an increase in the cost of living, causing discontent among consumers. This was observed in Japan towards the end of the previous year when fuel and commodity prices reached record highs, and the depreciation of the yen accelerated, negatively impacting local purchasing power. Consequently, public outrage prompted the government to take action. Currently, although inflation in the country remains above the target of 2%, the effects of high energy prices have diminished, resulting in significantly lower levels of public dissatisfaction. Based on this, it can be inferred that Tokyo lacks compelling reasons to initiate intervention at present.
Softer tone of warnings: In recent days, the Japanese government has intensified its warnings of potential intervention. However, it is notable that the tone of these warnings has not shifted significantly. Japanese officials continue to express concerns about sudden fluctuations in the foreign exchange market while cautioning about possible actions to address excessive yen volatility. In 2022, before implementing actual intervention, the Japanese authorities adopted a much more assertive tone, using phrases such as "deeply concerned" and "decisive steps." Such strong language is absent from their latest statements. Consequently, many analysts perceive the recent warnings by Japanese authorities as mere rhetoric rather than an indication of imminent intervention.
what measures BoJ will take to protect further devaluation of the JPY
Let's assess the likelihood of the Japanese authorities taking measures to protect their national currency and consider the most realistic scenario for preventing further devaluation of the JPY at this stage.
Increased verbal intervention: Since Federal Reserve Chairman Jerome Powell hinted at potential tightening, the yen has experienced a sharp decline against the dollar. Japanese officials have responded by issuing daily warnings to speculators who try to profit from disparities in monetary policies between the Fed and the Bank of Japan (BOJ) by trading the USD/JPY pair. Given that the fundamental factors influencing the yen are unlikely to change in the near future, it is expected that traders will continue actively selling the Japanese currency. If the decline of the JPY accelerates, Tokyo may escalate its warnings, promising decisive action against speculative movements. Many experts view this scenario as the most likely one. Atsushi Takeda, an economist from the Itochu Research Institute, stated, "The yen's depreciation is not as significant as last year, as the United States approaches the peak of interest rates. There will likely be one or two more rate hikes. Therefore, we do not anticipate strong JPY volatility leading to further depreciation at this stage." Analysts believe that the Japanese government is primarily focused on managing the pace of currency depreciation rather than targeting a specific exchange rate. Therefore, it is expected that Tokyo will continue with verbal intervention as the USD/JPY pair approaches the 145 level, but it is unlikely to engage in actual market intervention if speculators exceed that threshold.
Implementation of intervention: Last year, the Japanese government intervened in the market twice: in September when the yen approached 146 against the dollar, and in October when USD/JPY reached a 32-year high at 152. In 2022, Japan spent $65 billion on direct purchases of JPY. Implementing a new intervention would also incur significant costs for Tokyo, as the authorities would need to utilize the country's foreign exchange reserves to sell dollars. Taro Kimura, an analyst at Bloomberg Economics, noted, "Businesses and consumers are now more accepting of a weak yen compared to last year. The recent rally in Japanese stocks may also contribute to their positive sentiment." Considering these factors, along with the benefits of a weaker yen for exporters, experts consider the actual implementation of intervention at this stage to be unlikely. Japanese companies with a global presence have long been the major beneficiaries of a depreciated JPY, resulting in increased overseas earnings for firms such as Toyota, which added 1.3 trillion yen to its annual operating profit, and Sony, which experienced a sales increase of approximately 1.2 trillion yen across five key segments. Hideo Kumano, an analyst at the Dai-Ichi Life Research Institute, stated, "We believe the government will only intervene in the market if the yen suddenly falls to 150. Although they did so last year, currency intervention remains a last resort."
Hawkish actions by the Bank of Japan (BoJ): Some market participants suggest that the BoJ could halt the yen's decline by adjusting its Yield Curve Control (YCC) policy. Speculation has arisen that the BoJ may make its first hawkish move as early as July. However, Bloomberg analysts believe this expectation is misguided. Toru Fujioka, an economic commentator, shared, "The BoJ has consistently stated that it does not intend to directly curb the yen's depreciation using monetary policy tools, as such actions exceed its mandate and may be seen as currency manipulation." According to Fujioka, the BoJ would only consider adjusting the YCC policy if the bond market experiences significant fluctuations similar to those seen last year, coupled with persistent inflation resulting from wage increases.
My Trade Setup
First Trade Setup :
Sell level: 189.5-190.5
stop loss: 191.950
Take profit: 187.650
Second Trade Setup :
Sell level: 195-196.2
stop loss: 197.57
Take profit: 192.240
Third Trade Setup :
Sell level: 199.65-200.87
stop loss: 201.98
Take profit: 196.7, 192.87, 188.10
Long trade Setup :
open long position from 190 and 196 zone
stop loss: 210.500
take profit : 181.57, 170.35

usdjpy short
⚠️ Notice:
I will enter one third of my position on 70/30% of the box and the rest of it in the middle (50%) of the box. My TP would be R/R=3 and 5.
Please trade with your own money management methodology and be aware that trading has its own risks and rewards.

USDJPY | H1 | OutlookUSDJPY | H1 | Outlook
Looking at the USDJPY we can see that price broke our diagonal support at 144.5xx after successfully closing bellow our diagonal support we saw it push up to our horizontal resistance around 144.720 - 144.890.
Now looking to the right we can expect USDJPY to push down to 142.8xx after successfully closing bellow 144.600.

USD/JPY Short Scalping Setup And Long Swing Setup For Free !This Is An Educational + Analytic Content That Will Teach Why And How To Enter A Trade
Make Sure You Watch The Price Action Closely In Each Analysis As This Is A Very Important Part Of Our Method
Disclaimer : This Analysis Can Change At Anytime Without Notice And It Is Only For The Purpose Of Assisting Traders To Make Independent Investments Decisions.

USD-JPY - KeyLevels for next weekIf you wanna take a trade on USD-JPY, maybe before that, you need to conisder this KeyLevels of support and resistance areas.
Careful with longs until the daily resitstance area was rejected.

SHORT - USDJPY (2 Jul 2023)Position Trade - USDJPY
*Need confirmation
Monthly:
- 6M, 3M and monthly chart shows that price is continuing to make higher prices
As price has broke historical price, any trades for BUYS need confirmation.
Going by the trend, price is expected to rebound downwards to demand zone. Therefore, traders can look for confirmation sells before going big on BUY trades.
Daily
- Price needs to break the demand zone (highlighted) in the Daily chart before the SELL zone can be activated
In the long run, this pair is more profitable in LONG trades than SHORT trades. Once SELL orders are activated, the P/L needs to be managed closely.
LONG trades can be found in the Weekly Chart (purple lines)

SHORT - USDJPY (D) (30 May 2023)Position Trade - USDJPY
In the Monthly Chart,
- Price is showing exhaustion after rallying and is in correcting itself back to the Supply zone
- Hence, there are aplenty of SHORT opportunities in the lower TFs
- Also, if one place a trade from the FRESH MN area, do prepare to hold for a long time.
- The chart candles formed are also good and strong ones, compared to the MESS to the left of the chart
A pending SELL limit order has been placed on the Monthly chart on 30 May 2023
In the Weekly Chart,
- For smaller risk, find the zone to sell from
In the Daily Chart,
- There are 2 zones to sell from

USDJPY Forecast: Insights for the New Week & Follow-Up AnalysisIn this video, we delve into a comprehensive technical analysis of USDJPY, focusing on its bullish and bearish sentiments through price action analysis. Join us as we uncover potential trading opportunities for the upcoming week by identifying key support and resistance levels within the 4-hour timeframe.
On Friday, the Japanese Yen experienced a decline after a three-and-a-half-day struggle, fueled by the strengthening of the US dollar. This was in response to Federal Reserve Chair Jerome Powell's reiterated stance on the necessity of additional rate hikes. During his two-day testimony before Congress, Powell emphasized that U.S. interest rates may rise at least twice more this year to counteract high inflation. Market reactions to Powell's comments led to a significant increase in the likelihood of further rate hikes in July, with markets pricing in a nearly 75% chance of such action.
Data released from the Japanese economic docket on Friday indicated that consumer inflation slightly exceeded expectations for the 12-month period up to May. However, a core reading excluding food and fuel prices surged to a 42-year high, indicating persistent inflationary pressures in Japan.
These trends are placing increased pressure on the Bank of Japan to consider tightening its monetary policy, although the bank has recently reiterated its commitment to maintaining its ultra-loose policy. Nonetheless, the potential for Japanese monetary policy tightening may contribute to a resurgence in the yen, which has faced considerable downward pressure due to the dovish stance of the Bank of Japan. Additionally, the Japanese currency is rapidly approaching levels that could prompt government intervention in currency markets.
USDJPY Technical Analysis (Price Action):
In this video, I offered an extensive analysis of the USDJPY market's current structure, with a primary focus on price action-based technical analysis. Special attention was given to key support and resistance levels within the 4-hour timeframe, uncovering potential trading opportunities for the upcoming week. Notably, I highlighted a key level around 143.900, which was recently tested and represents the highest price reached this year. The market's response to this level at the start of the new week will play a pivotal role in determining the direction of price action in the upcoming week.
Stay connected to my channel, follow my updates, and actively engage in the comment section to stay informed about further technical developments in the USDJPY market. I wish you the best of luck this week as you navigate the USDJPY market.
Disclaimer:
Trading on margin in the foreign exchange market (including commodities, CFDs, stocks, etc.) carries a high level of risk and may not be suitable for all investors. The content of this speculation (including all data) is provided by me for educational and informational purposes only to assist in making independent investment decisions. All information presented here is for reference purposes only, and I do not accept any responsibility for its accuracy.
It is important that you carefully consider your investment experience, financial situation, investment objectives, and risk tolerance level, and seek advice from an independent financial advisor to assess the suitability of your situation before making any investment.
I do not guarantee the accuracy of the information provided and shall not be held liable for any loss or damage that may arise directly or indirectly from the content or the receipt of any instructions or notifications related to it.
Please note that past performance is not necessarily indicative of future results.

🛒 USDJPY | Daily Resistance 🛒The economic news is still not good.
I expect a slight correction at daily resistance before continuing on a rise, if no good news is announced.
Stay very vigilant with the volatility of the JPY.
🚀 If you want to help me here, please follow me 🚀
✅ Random Win Idea ✅

USDJPY: USD's miraculous recovery journey with JPY downturnS&P500 futures have recorded slight losses before the market opens as investors are being cautious about the upcoming speech by Federal Reserve (Fed) chair Jerome Powell at the European Central Bank (ECB) forum of Central Banking. Investor sentiment has become more risk-averse as they hope that Powell will continue to express a cautious stance.
The US Dollar Index has experienced a significant increase, supported by expectations of a cautious approach from Powell and stronger US Durable Goods Orders data. The US Census Bureau reported that Durable Goods Orders grew by 1.7%, surpassing the market's expectation of a 1% decline. This data for May has outperformed the previous figure of 1.2% in April.
Jerome Powell is expected to provide a cautious approach as core inflation in the US economy remains persistent and labor market conditions continue to be tight, despite higher interest rates and strict credit conditions set by commercial and regional banks.
On the other hand, a Reuters survey suggests that the Bank of Japan (BoJ) may intervene in foreign exchange (FX) movements if the Japanese Yen weakens to 145.00 against the US Dollar. Japanese Finance Minister Shunichi Suzuki reiterated his commitment to respond appropriately to excessive FX movements if necessary.
Later this week, the market will closely monitor Tokyo

Big intervention from JPYBased on fundamental data, it is to process an intervention on currency to improve overall economic conditions in their country.
In the technique analysis, I could tell that this is the big uptrend from Q3–Q4 2022. That means it will be a chance to have a correction wave to create a base for institutions to take their time and place their position in the market. I've used these techniques to analyze a short position order to capture a reverse trend: Elliott waves + Harmonic pattern + Support and Resistance (Volume profile) + Fibonacci.
But USDJPY still has a chance to go up and break all the rules until the BoJ next move.

USDJPY Forecast: Insights for the New Week & Follow-Up AnalysisThe Japanese yen experienced a slight decline as the Bank of Japan maintained its ultra-loose policy. However, it managed to recover some of its early losses following the BOJ decision, though it remained close to seven-month lows against the dollar. The BOJ opted to keep interest rates unchanged at record lows and expressed its intention to continue the yield curve control policy in support of economic growth. The bank also forecasted above-average strength in the Japanese economy for the year.
The yen had been weighed down by expectations of a dovish BOJ, especially as the Federal Reserve signaled a relatively hawkish stance, indicating a widening gap between Japanese and U.S. interest rates. While the Fed had previously paused rate hikes, it foresees at least two more increases this year due to inflation trending above the central bank's target range.
Nevertheless, weak U.S. economic indicators such as slowing industrial production, steady jobless claims, and sluggish retail sales raised doubts about the extent to which the Fed could continue raising interest rates.
Anticipated higher U.S. interest rates for a longer period are likely to restrict significant gains in Asian markets. In the upcoming week, we will focus on economic events from both the U.S. and Japan, including the BoJ Monetary Policy Meeting Minutes and the Fed Chair's testimony before Congress. How will these events impact the USDJPY from a technical standpoint?
During the video, I provide detailed analysis of the USDJPY's bullish and bearish sentiment, primarily focusing on price action-based technical indicators. We identify key support and resistance levels within the 4-hour timeframe to uncover potential trading opportunities. Notably, we highlight a significant level around 142.000 that was recently tested, and how market participants react to this level at the start of the new week may play a critical role in determining the direction of price action in the upcoming week.
Stay connected to our channel, follow our updates, and engage in the comment section to stay informed about further developments in the USDJPY market.
Disclaimer:
Trading on margin in the foreign exchange market (including commodities, CFDs, stocks, etc.) carries a high level of risk and may not be suitable for all investors. The content of this speculation (including all data) is provided by me for educational and informational purposes only to assist in making independent investment decisions. All information presented here is for reference purposes only, and I do not accept any responsibility for its accuracy.
It is important that you carefully consider your investment experience, financial situation, investment objectives, and risk tolerance level, and seek advice from an independent financial advisor to assess the suitability of your situation before making any investment.
I do not guarantee the accuracy of the information provided and shall not be held liable for any loss or damage that may arise directly or indirectly from the content or the receipt of any instructions or notifications related to it.
Please note that past performance is not necessarily indicative of future results.

USDJPY - Long from bullish order block ✅Hello traders!
‼️ This is my perspective on USDJPY.
Technical analysis: Here we are in a bullish market structure from 4H timeframe perspective, so I am looking for longs. I want to make a retracement to fill the imbalances lower and then to reject from bullish order block + institutional big figure 142.000.
Fundamental analysis: This week on Thursday we have news on USD, will be released quarterly GDP. Pay attention to the results in order to validate the analysis.
Like, comment and subscribe to be in touch with my content!

Mutiny Sends Ruble to Lowest in 15 MonthsMutiny Sends Ruble to Lowest in 15 Months
In one of the most turbulent trading sessions this year, the Russian ruble reached its lowest point against the US dollar in nearly 15 months on Monday. This decline followed the failed mutiny attempt by The Wagner group’s armed mercenaries over the weekend, which caused significant concern among traders. Initially catapulting to approximately 87 rubles per US dollar, the ruble later recovered some of its losses, settling at around 84.40, down 0.90% against the greenback.
The Wagner group, led by troops loyal to their leader, made an unexpected advancement toward Moscow, covering hundreds of miles before eventually reversing course. In a deal struck with the Kremlin, it is reported that the group's leader, Prigozhin, will go into exile in Belarus. This incident is regarded as the most significant challenge to Vladimir Putin's rule and could weaken his leadership.
The armed uprising also caused volatility in other markets. The international benchmark, Brent crude, rose by 0.8% to approximately $74 per barrel. The trading volume between the Russian ruble and Tether's USDT nearly quadrupled from $4 million on Saturday to $15 million on Sunday.
In other developments, the Japanese yen strengthened by 0.11% against the US dollar, trading at 143.50 per dollar. Vice Finance Minister for International Affairs, Masato Kanda, stated that Japan was not ruling out intervening in the currency markets again. He expressed concerns about the yen's rapid and one-sided depreciation against the dollar. Japan previously intervened in the foreign exchange markets in September and October of the previous year when the yen hit a 32-year low of nearly 152 per dollar.

USDJPY: Breakout bullish channelEven if sellers break the immediate support level at 143.20, a two-week uptrend around 142.40 acts as an additional downside filter.
Notably, the upward sloping trendline from early May and the 200-SMA, near 140.80 and 139.40 respectively, serve as additional support levels for the bearish USD/JPY before taking control.
On the other hand, an eight-week-old uptrend, with a slowest near 144.30, limits the immediate upside of the USD/JPY pair.

USDJPY retracement at the highAfter a few indecision candles at the high, followed buy a volume push up to a major resistance, I became alert that a bearish setup might present. Friday closed off with a variation of a bearish engulfing. When price closes beyond a price then closes right back beneath it its a sign that this price is being rejected. Naked analysis tells us that the 1hour chat has already began its downward momentum. A minor double top formed. My short entry was based on the high volume bearish engulfing re-test at the neckline. The 30MIN chart has begun creating its lower highs and lower lows. This is a short scalp. the buy will likely present later in the week.

USD/JPY - Short; SELL right here!The chart ought to be self explanatory.
(Should have cleared already that +400 pips to which the previous post - attached - eluded. :-)

USDJPY 1DUSDJPY on Daily TF looking forward to taking orders from POI Area while covering the Fair value gap
we can see sell trades in the POI area with a complete risk-reward ratio
Just my thoughts:)

#USDJPY 4H | 1H Sell🔘Broke the structure on the 4H timeframe
🔘Broke the structure on the 1H timeframe (confirmation)
If we break the red level on the 1H timeframe, we we'll go a little higher before drop, but if we break the red level on the 4H timeframe, the analysis becomes invalid🙅♂️
Good luck 🙌💪


USDJPY Daily AnalysisUSDJPY has been in an uptrend for a while after breaking my weekly keyzone. Price is presently at a resistance level. I expect price to break the resistance and continue the uptrend, or price will get rejected and possibly reverse back to the keyzone below as marked in the chart.
What's your bias on this pair? kindly like and share your thoughts below

USDJPY SELLit seems that the strength of up-trend is getting weaker and it's suitable for Sell (Short Position)
