Risk, Rates, and Reversals: What’s Next for USD/JPY?CMCMARKETS:USDJPY FX:USDJPY USD/JPY rebounded slightly to 143.10 but remains under pressure after slipping from the 144.50 on BoJ-Fed divergence and rising geopolitical tensions. While the BoJ appears cautious about accelerating its balance sheet tapering beyond FY2026, it still signals further rate hikes amid persistent domestic inflation, offering the yen structural support.
Technically, price is reacting off the lower trendline TL2, aligned with the 142.30–142.40 significant support zone. This area has held multiple times in the past and may offer a bullish pullback toward the 143.80 or even 146.15 resistance zones. However, failure to break above these levels could expose USD/JPY to renewed downside toward the 140.89 demand base.
Short-term recovery depends on Friday’s NFP and risk sentiment around trade tensions. A break below 142.30 would invalidate the bullish rebound and open downside to support near 140.89.
Resistance : 143.87 , 146.14
Support : 142.36 , 140.89
Usdjpyshort

Short I opened a short position yesterday at the price of 147.50.
Currently the price is 146.18. The price has dropped quite a bit but I think it still has a good short entry opportunity with a reasonable risk reward.
Reasons for short trade:
The price has reached the major support level around 149 on the 22nd April. Since then, the price has moved up to the fair value gap area between 149.2 and 148.2 (blue rectangular box), and also the order block.
That area is also the Fib 0786 area. I look at Fib 0.786 as the last line of defence and it is usually a hard line to break.
The price hit the area and started to move to the downside. Momentum indicators are still in the bull territory but the lines have crossed and clearly moving to the downside.
My macro bias for USD is bearish and the current price set up support my bias. The risk reward is good enough for me to enter.
My trade set up:
Entry: 147.51Stop: 148.95Target: 142.478 (Fib 0.236)
Risk:Reward= 1:3.5
Currently the price is 146.17. It just broked below Fib 0.618. Entry now can give you 1:1.5 risk reward.

Was This Week's Move in USD/JPY Just a Correction?This week’s bounce in USD/JPY may have caught some traders off guard—but when viewed through the lens of the Elliott Wave Principle, the price action appears to be corrective rather than impulsive.
🧩 The Evidence: A 3-Wave Move
According to the wave structure:
The recent move up unfolded in 3 waves, labeled as an ABC correction.
Wave C terminated near the 100% Fibonacci extension of Wave A (~146.189), which is a classic ZigZag ratio.
Additionally, there was a clear MACD divergence between price and momentum as Wave C completed—a common sign that the move is running out of steam and that the wave is likely terminal.
These clues all point to the idea that the rally was corrective, not the start of a new impulsive trend.
📉 What Comes Next?
If this count is correct:
USD/JPY may have completed Wave (ii) of a new downward impulse.
The next move could be the start of Wave (iii)—typically the most aggressive and directional wave in a 5-wave decline.
✅ Trigger Level: A break below the B wave low would act as a technical confirmation of the downtrend resuming.
This would be a green light to look for short setups, depending on the strategy each trader follows—whether that’s pattern-based, indicator-confirmed, or structure-driven.
🔁 Alternate Scenario:
If this isn't the start of Wave (iii), the alternate count would suggest a more complex corrective combination (such as a double three).
However, even in that scenario, the short-term direction is still likely downward.
🧠 For Beginners:
Elliott Wave theory breaks price into 5-wave trends and 3-wave corrections.
A ZigZag correction (ABC) is made up of a sharp Wave A, a pullback in Wave B, and a final move up in Wave C.
Wave C often shows momentum divergence (MACD diverging from price), signaling that the move may be exhausting.
When C = A, especially with divergence, it’s often a sign the correction is ending.
📌 Summary:
USD/JPY’s rally appears to be a corrective ABC structure.
Wave C rejected at the 100% extension of A, with MACD divergence confirming weakening momentum.
A break of the B wave low could confirm that Wave (iii) down is underway.
Even in the alternate count, near-term downside is still favored.
💬 Got a Favorite Chart You’d Like Analyzed?
If there’s a forex pair, crypto, or stock you’d like me to break down using Elliott Waves,
leave a comment below and I’ll feature it in an upcoming post from Real Wave Trader.

Skeptic | USD/JPY Analysis: Bearish Momentum Fuels Short Setups!Hey everyone, Skeptic here! I know some of you might’ve missed our last USD/CHF short signal that hit a sweet 3:1 R/R—no worries! 😊 The market’s always here, so missing a trade isn’t the end of the world. I’m not here to push FOMO; my goal is to take you on a long-term trading journey, and I’m stoked to have you along for the ride! :))) Let’s get back to USD/JPY and break down the latest action. 📊
Daily Timeframe: The Big Picture
First, let’s zoom out and talk about the DXY (US Dollar Index), which recently broke the 99.005 support and turned bearish. This puts USD-based pairs like USD/JPY in the spotlight for short opportunities this week. Here’s what’s happening with USD/JPY:
Trend Context: The major trend is bearish. Last week, sellers showed no mercy to buyers, and with DXY’s bearish move, we’re likely to see more of the same this week.
Key Level: We’re currently reacting to a major daily support at 142.305. Expect a range or reaction here, so we must wait for confirmation before shorting.
Recent Correction: The prior correction reached the 0.50% Fibonacci retracement and seems to have resumed the major bearish trend.
With this in mind, let’s zoom into the 4-Hour Timeframe to hunt for long and short setups.
4-Hour Timeframe: Long & Short Setups
The 4-hour chart is giving us some clear signals to work with. Here’s the plan:
Short Setup:
Key Level: The 142.338 level is critical, as it formed a ceiling at 148.569 in the past and acted as support before.
Trigger: If we form a lower high and then break below 142.305, open a short position.
Confirmation: Use RSI to back up the breakout, ensuring momentum aligns.
Why It Works: A lower high signals increasing weakness in this support, making a break more likely.
Long Setup:
My Take: I personally don’t have a long trigger right now. Both the major and minor trends are downtrends, so going long doesn’t make sense in these conditions.
If You Insist: If you’re set on a long, wait for a break above 144.125. But keep it tight—low risk, small stop loss, and take profits quickly once you hit a decent R/R.
💬 Let’s Talk!
If this analysis sparked some ideas, give it a quick boost—it really helps! 😊 Got a pair or setup you want me to dive into next? Drop it in the comments, and I’ll tackle it. Thanks for joining me—see you in the next one. Keep trading smart! ✌️

Bullish Reversal on Risk-On Shift and Channel BreakoutCMCMARKETS:USDJPY USD/JPY surged as risk appetite returned after a U.S. federal court blocked President Trump's "Liberation Day" tariffs, undermining demand for safe-haven assets like the yen. Meanwhile, weak demand in Japan’s 40-year bond auction raised concerns over fiscal stability, adding further downside pressure to JPY. Technically, the pair broke above a downward channel and formed a bullish engulfing pattern near the 144.90 demand zone. If price consolidates above 145.00, a test of the 148.15 resistance zone is possible. Traders now eye upcoming U.S. GDP and PCE inflation data for direction on Fed policy.
Resistance : 148.14 , 148.67
Support : 144.90 , 144.42

USDJPY: Neutral View! One of The Hardest Forex Pair To TradeUSDJPY has not yet shown a clear move, ranging between 141 and 144. We are currently neutral as the price could go in either direction. Trade cautiously and manage risk according to your trade plan.
Thanks for your support! 😊
If you’d like to help us out, here are a few things you can do:
- Like our ideas
- Comment on our ideas
- Share our ideas
Team Setupsfx_
❤️

USDJPY Analysis – Yield Support Signals Potential UpsideUSDJPY is currently sitting at a key support zone around 142.80–143.00, showing signs of a potential bullish reversal. This support area has previously acted as a strong launchpad for price rallies.
🟢 Technical Setup:
Price action has formed a clean higher low structure, bouncing off horizontal support.
The US10Y Treasury Yield (pink line) has rebounded sharply and is diverging to the upside — a leading indicator for USDJPY strength.
The Fib retracement from the last swing move aligns well with the 0% zone, suggesting the dip might be complete.
A bullish reaction from here targets the 148.50 zone, with intermediate resistance around 145.00–146.00.
🟠 Risk Levels:
Invalidated below 141.40 (structure break).
Stops could be placed below 142.00, targeting a 2:1 or better risk-reward ratio.
🔍 Macro-Fundamental Insight:
U.S. Yields are firming despite mixed Fed signals — this gives strength to USD, especially against low-yielders like the JPY.
BOJ remains dovish with no urgency to normalize rates, keeping the yen weak.
With risk appetite improving and bond yields lifting, carry trade dynamics favor USDJPY upside.
✅ Conclusion:
As long as US10Y yields remain firm and USD holds above 142.00, USDJPY has a strong probability of rallying toward 148.50. Look for confirmation with higher highs on the 4H chart and continued divergence between yield and price.

0527: Bearish USD/JPY: BoJ Rate Hike Expectations Hello traders,
In the futures market, I once again came across a more "interesting" piece of data. The COT position data showed that the speculative long positions in the Japanese yen soared to 167,330 contracts, reaching an extreme level not seen in recent years.
★ I would like to present another set of data:
✔ In April, the price of rice in Japan soared by 98.4% year-on-year, marking the largest monthly increase since 1971. This increase was even higher than the 92.1% in March.
✔ The Japanese government cancelled subsidies for gas and electricity in March, causing energy prices to rise by 9.3%.
✔ Japan's core CPI excluding fresh food rose by 3.5% year-on-year, higher than 3.2% in March. This is the fifth consecutive month of core inflation above 3%.
✔ Meanwhile, the Japanese economy contracted by 0.7% in the first quarter of 2025, marking the first negative growth since the first quarter of 2024.
✔ Within 45 days, the yield on Japan's 30-year government bonds soared by 100 basis points, reaching a record high of 3.20%. Over 500 billion US dollars of 40-year Japanese government bonds, regarded as "safe assets", have depreciated by more than 20% in the past 6 weeks.
Technically, weekly chart, UJ has make a bearish reversed bowl top and now this pair is targeting south running beneath WEEKLY EMAs.
The support zone that be test triple would become resistance zone very soon.
The weekly selling targets are marked out on this chart!
Based on the latest market trends and the policy signals from the Bank of Japan, there is a high probability that the Bank of Japan will raise interest rates at its next meeting (expected to be in June 2025). It is now the time to buy the expectation and sell the reality.
GOOD LUCK!
LESS IS MORE!

USDJPY Bearish Continuation Setup Trend Analysis
The market is in a clear downtrend, evidenced by the sequence of lower highs and lower lows.
The descending trendline has been respected multiple times, acting as dynamic resistance.
🧠 Key Technical Factors
Rejection Zone (Supply Area):
The marked “Rejection Point” aligns with the confluence of the trendline resistance, 50 EMA (red), and historical supply.
Price attempted to break above but faced a strong rejection—signaling institutional sell interest.
EMA Confluence:
50 EMA (142.993) and 200 EMA (144.063) are both sloping downward.
Price is trading below both EMAs, confirming bearish momentum and trend continuation bias.
BOS (Break of Structure):
Multiple BOS levels marked, showing a consistent pattern of structure breaks to the downside.
Each rally is met with selling pressure, failing to create new highs.
🧩 Projected Price Action
Current retracement could retest the trendline/50 EMA before a potential continuation move downward.
Expectation is a lower high formation near the descending trendline followed by a bearish impulse.
🏹 Bias: Bearish
Traders might consider short opportunities around the 142.90–143.00 zone, targeting 142.00 and below, with stops just above the trendline/supply zone.
⚠️ Risk Note
A clean break and close above the trendline and 50 EMA would invalidate this setup and could lead to a shift in structure.

USD/JPY - H1 - Channel Breakout (17.05.2025) The Pair on the H1 timeframe presents a Potential Selling Opportunity due to a recent Formation of a Channel Breakout Pattern. This suggests a shift in momentum towards the downside in the coming hours.
Possible Short Trade:
Entry: Consider Entering A Short Position around Trendline Of The Pattern.
Target Levels:
1st Support – 142.40
2nd Support – 140.17
🎁 Please hit the like button and
🎁 Leave a comment to support for My Post !
Your likes and comments are incredibly motivating and will encourage me to share more analysis with you.
Best Regards, KABHI_TA_TRADING
Thank you.
Disclosure: I am part of Trade Nation's Influencer program and receive a monthly fee for using their TradingView charts in my analysis.

USD/JPY Analysis: Bearish Bias with Multi-Market Confluence!📉 USDJPY Technical Breakdown – Yen Strength in Focus 📉
In this video, we take a close look at the USD/JPY, which is currently under pressure and trending to the downside 🔽. The bearish momentum is clear, but there are several key factors to consider before positioning ourselves for a potential short 📊.
🔍 First, it’s important to monitor the equity markets. If we start to see a pullback or sell-off in the stock indices 🏦📉, that could translate into further yen strength, adding weight to a USD/JPY short bias 💴💪.
Another key piece of confluence is comparing the DXY (Dollar Index) 📈 with the JXY (Japanese Yen Index) 📉. This gives us deeper insight into the relative strength of each currency and helps confirm our directional bias before entering a trade ⚖️.
🔁 Coming back to the USD/JPY chart, we’re watching for a retracement into a Fibonacci point of interest, which could provide a high-probability area to enter a sell setup. If price reacts from that level and confirms with structure, we could have a clean opportunity for continuation 🔂🎯.
⚠️ This is not financial advice — always conduct your own analysis and manage risk accordingly.

USDJPY Bearish in the short term.The USD/JPY exchange rate extended its recent downward trend during the European session, falling for the third consecutive trading day and marking the sixth decline in the past seven trading days. It hit a two-week low in the 143.45 area during the European morning session. Multiple factors have jointly driven the exchange rate lower, indicating that the sharp pullback from the monthly high of 148.65 reached last Monday may continue to extend. The Japanese yen is supported by market expectations that the Bank of Japan (BOJ) will raise interest rates again and has gained additional momentum from the rebound in risk-aversion demand. In the short term, USD/JPY maintains a downward trend, with technical indicators showing that bears are in control. 142.210 will be a key support level; a break below this level could accelerate the decline toward the 139.887 area.
In the market, there are no absolutes, and neither upward nor downward trends are set in stone. Therefore, the ability to judge the balance between market gains and losses is your key to success. Let money become our loyal servant.

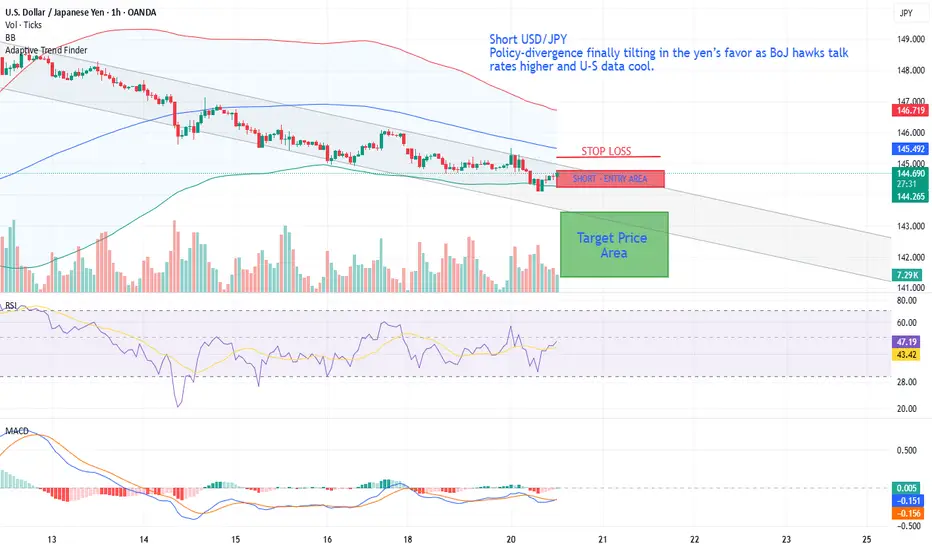
Short USD/JPYShort USD/JPY – policy-divergence finally tilting in the yen’s favor as BoJ hawks talk rates higher and U-S data cool.
• BoJ hawks signaling further 2025 hikes while Fed easing bets build → policy-divergence flips JPY-positive.
• Break & close below 38.2 % retracement and 200-SMA (H4) turns momentum south; hourly / daily RSI roll-over.
• Geopolitics easing removes safe-haven bid for USD, but not for JPY (BoJ still seen hiking).
• Bearish trigger deepens if 144.30 confluence (200-SMA H4 + 50 % Fib) gives way → air-pocket into 141s.
USD/JPY Breakdown: Sell the Rallies, Ride the TrendUSD/JPY has decisively shifted bearish across all key timeframes. On the daily chart, the pair broke below the 50-, 100-, and 200-day EMAs with consistent lower highs and lows. The hourly chart confirms this trend, with bearish EMA stacking and failed attempts to reclaim the 200-hour EMA. RSI remains under 50 across timeframes, signaling persistent bearish momentum without exhaustion.
The 15-minute chart highlights ideal short-entry setups on pullbacks to the 20- or 50-EMA, especially when RSI fails to breach 50. The 200-EMA on this timeframe acts as dynamic resistance near 145.30. Short entries are favorable on rallies to the 145.10–145.35 zone, with downside targets at 144.80, 144.50, and potentially 144.20.
For the week ahead, the strategy is clear: fade rallies into EMA resistance and use RSI confirmation for timing. Avoid chasing lows—wait for price to come to you. Tight stops just above the EMAs minimize risk, and partial profit-taking at swing lows allows for trend-riding flexibility.
As long as USD/JPY remains below the 200-hour EMA, bearish momentum dominates. Trade with the trend, manage risk with precision, and stay alert for breakdowns below key support levels.

USDJPY and GBPJPY Analysis todayHello traders, this is a complete multiple timeframe analysis of this pair. We see could find significant trading opportunities as per analysis upon price action confirmation we may take this trade. Smash the like button if you find value in this analysis and drop a comment if you have any questions or let me know which pair to cover in my next analysis.

Bearish USD/JPY — Yen Strength FavoredCMCMARKETS:USDJPY Bearish Factors (USD Negative / JPY Positive):
Hawkish BoJ Expectations:
Despite Japan’s weaker Q1 GDP, BoJ officials—particularly Deputy Governor Uchida—have signalled openness to resuming rate hikes in 2025. A Reuters survey suggests a potential 25bps hike before year-end. This divergence from the Fed’s stance supports JPY strength.
Dovish Fed Outlook Intensifies:
Weak U.S. April PPI and retail sales figures reinforce expectations for multiple rate cuts this year. Falling Treasury yields and soft inflation readings weigh heavily on the dollar.
Resistance : 146.75 , 145.87
Support : 144.91 , 143.52

USD/JPY - Trendline Breakout (14.05.2025)The USD/JPY Pair on the M30 timeframe presents a Potential Selling Opportunity due to a recent Formation of a Trendline Breakout Pattern. This suggests a shift in momentum towards the downside in the coming hours.
Possible Short Trade:
Entry: Consider Entering A Short Position around Trendline Of The Pattern.
Target Levels:
1st Support – 145.34
2nd Support – 143.81
🎁 Please hit the like button and
🎁 Leave a comment to support for My Post !
Your likes and comments are incredibly motivating and will encourage me to share more analysis with you.
Best Regards, KABHI_TA_TRADING
Thank you.

USOIL Temporary Drop seems inevitableYesterday's analysis perfectly predicted today's market movement. The USD/JPY rebounded from the low of 140.00, recovered from the downtrend channel, and then encountered resistance and pulled back at 148.65. Sellers are currently testing the support level of 146. If this level is broken, it may decline further to the round - number levels of 145.00 and 143.50. If 146 holds, buyers will attempt to break through the resistance level of 148.65 and further aim for the 200 - day moving average at 149.60.
Today, the released U.S. retail sales and PPI inflation data will provide clues about the consumer situation and the wholesale inflation landscape. The market expects that after a 1.5% increase in March, U.S. retail sales will be flat at 0% in April. Meanwhile, the PPI is projected to rise 0.2% after a 0.4% decline in March. The USD/JPY rebounded from the low of 140.00, recovered from the downtrend channel, and then encountered resistance and pulled back at 148.65. Sellers are currently testing the support level of 146. If this level is broken, it may decline further to the round - number levels of 145.00 and 143.50.
Federal Reserve Chair Powell will also give a speech, likely reiterating the Fed's stance that it will not be hasty to cut interest rates again until the impact of Trump's tariffs on the economy becomes clearer.
you are currently struggling with losses, or are unsure which of the numerous trading strategies to follow, at this moment, you can choose to observe the operations within our channel.

USDJPY SHORT📉 TRADE IDEA – SHORT USD/JPY
🗓️ May 14, 2025
🔻 Position: Short
📍 Entry: 148.164
🎯 Target: 145.414
🛑 Stop Loss: [Set based on your risk — e.g., 148.189
Reasoning:
Rejection from resistance zone above 148
Bearish structure forming on the 4H and daily charts
Possible shift in sentiment around JPY with BoJ pressure mounting
USD weakening as Fed rate expectations tilt dovish
📉 Targeting a drop toward key support at 145.414 — a clean level on the daily chart.
This is a short- to medium-term swing trade based on technicals + macro shifts.
Risk managed, watching upcoming Fed & BoJ commentary closely.
📊 Let the trade play out.

USDJPY EXPECTATIONJust looking at the market you can clearly see what is happening, we are currently on short for usdjpy and our expectation target.

USDJPY BEARISH SETUP ONFIRMED.?USD/JPY Bearish Scenario Analysis
Trend: Downtrend (bearish bias confirmed by lower highs and lower lows on the daily timeframe)
Current Price Action: After a failed attempt to sustain above the 148.200 resistance level, USD/JPY has shown rejection patterns such as bearish engulfing candles and increasing selling volume. Price is now breaking below key moving averages (e.g., 50 and 100 EMA), confirming momentum shift to the downside
Key Technical Levels
Resistance: 148.200 – Strong supply zone, multiple rejections seen here.
1st Bearish Target: 143.900 – Recent swing low and minor support zone; break below confirms bearish continuation.
2nd Bearish Target: 141.600 – Major horizontal support from previous consolidation area.
Support: 140.100 – Long-term support level; likely to attract strong buying interest or signal a trend exhaustion.
Bearish Scenario Setup
1. Entry Zone: Between 147.500 - 147.800 (pullback/retest of broken structure)
2. Stop Loss: Above 148.500 (just beyond the resistance zone to avoid false breakouts)
3. Take Profit Targets:
TP1: 143.900
TP2: 141.600
4. Bonus Target (extended move): 140.100 – if selling momentum continues and macro conditions favor JPY strength.

USD/JPY H4 | Approaching a swing-high resistanceThe hawkish stance of the Federal Reserve and the market's optimistic sentiment regarding a potential Sino-US trade agreement have driven the overall strength of the US dollar. The Federal Reserve's suspension of interest rate cuts and the absence of hints of near-term rate cuts have enhanced the attractiveness of the US dollar, providing support for the upward movement of the USD/JPY exchange rate. On the four-hour chart, the Marlin oscillator has reversed downward from the zero line, which coincides with the reversal on the daily chart, forming a strong reversal pattern. The price is testing the support of the MACD line and the key level of 143.45. If the daily candlestick closes below the 143.45 level, it will open the path for a decline towards 141.70 and even the lower boundary of the price channel near 139.50. If the closing price is higher than yesterday's high of 144.00, it is likely to rise towards 144.75, with a long-term target of 145.91. Considering the actual closing price of 145.0930, the upward scenario has been activated. In addition, the MACD indicator shows that the bullish momentum has been somewhat restored, but it is still in the initial stage of the rebound. The RSI indicator remains above 45 and has not entered the strong area, indicating that the current exchange rate is in the stage of consolidation and accumulation of momentum. Although there has been a certain upward movement in the short term, the overall strength of the bulls and bears has not reached an obviously strong state.
you are currently struggling with losses, or are unsure which of the numerous trading strategies to follow, at this moment, you can choose to observe the operations within our channel.

Yen rally ends, markets eyes Fed rate decision and BoJ minutesCurrently, the market sentiment is rather complex. On the one hand, some traders are betting on the restart of negotiations by the US side, believing that policy uncertainty will be alleviated with the convening of the meeting. On the other hand, from the perspective of the capital market, the market's concern about the medium - to - long - term depreciation trend of the US dollar is increasing. In particular, the " $2.5 trillion capital withdrawal" view proposed by the Eurizon SLJ report, if realized, will substantially suppress the US dollar.
In the short term, if the USD/JPY exchange rate fails to hold above the 145.5 level, the rebound may come to an end, and the price may test the two key support levels of 143.00 and 141.650. Especially if the Fed's policy language continues to be dovish, the exchange rate may decline further.
you are currently struggling with losses, or are unsure which of the numerous trading strategies to follow, at this moment, you can choose to observe the operations within our channel.
