USDJPY Retest of Supply Zone Before Bearish ContinuationUSDJPY pair is reacting to key supply around 143.70–144.00 but shows signs of weakness after failing to hold above this level. With renewed risk-off sentiment and escalating global trade tensions—especially involving Japan and the U.S.—this pair may be setting up for a bearish continuation. Here's what both the chart and macro backdrop suggest.
📊 Technical Breakdown (4H Chart)
Key Supply Zone Retested:
The pair retraced into a previously broken structure zone (blue box), rejecting the 143.70–144.00 area multiple times.
Price is now forming lower highs, indicating bearish pressure building beneath resistance.
Bearish Continuation Pattern:
Price action resembles a bear flag, with a minor pullback likely before continuation lower.
A retest of 143.00–143.50 could serve as an ideal sell zone.
Major Support Levels:
142.04–142.02: Immediate support, already tested.
140.16: Key structure low from late April.
138.04: Final measured move target based on Fibonacci extension and prior demand zone.
Bearish Trade Setup:
Entry Zone: 143.00–143.50
Stop: Above 145.35
TP1: 142.00
TP2: 140.15
TP3: 138.00
🌐 Macro Fundamentals
Trump Tariffs Stir Instability:
President Trump is pressing Japan in trade talks with threats of new tariffs, already impacting investor confidence
A 25% tariff on Japanese auto exports has gone into effect, disrupting trade negotiations.
Urgency for a Deal, But No Progress Yet:
Trump says multiple deals are “coming,” but little substance has emerged. Analysts fear economic fallout and potential global recession if tensions continue
JPY Strengthening on Safe-Haven Flows:
With U.S. economic indicators weakening and global uncertainty rising, the yen may benefit from risk aversion.
✅ Summary
USDJPY remains vulnerable to downside continuation from the 143–144 resistance zone. If price breaks below 142.00 again with conviction, expect momentum to build toward 140.15 and potentially 138.00.
Usdjpyshort

USD/JPY) bullish trend analysis Read The ChaptianSMC Trading point update
Technical analysis of USD/JPY chart shows a bullish reversal setup. Here’s a breakdown behind the analysis:
1. Downtrend & Channel Breakout:
Price was trending downward within a descending channel (marked “channel trend”).
Recently, the price broke out of the channel, signaling a potential trend reversal.
2. Demand Zone (Diamond Zone):
The yellow box labeled “Diamond Zone” represents a demand/support zone where price previously found buyers.
A retest of this zone is expected before the bullish move.
3. EMA (200):
The EMA (200) is currently above the price but close. A break above this level (142.522) could add to bullish momentum.
4. RSI Indicator:
RSI is showing a bounce off a mid-level (~50), suggesting bullish momentum is gaining.
5. Target Level:
The analysis targets 147.838, which aligns with a prior resistance zone.
The move projects a 5.19% gain (~778.5 pips) from the current setup.
Trading Idea Summary:
Entry: Around the “Diamond Zone” after a successful retest.
Confirmation: Watch for bullish candlestick patterns or a break above EMA 200.
Target: 147.838
Stop Loss (implied): Below the Diamond Zone (~140.000)
Pales support boost 🚀 analysis follow)

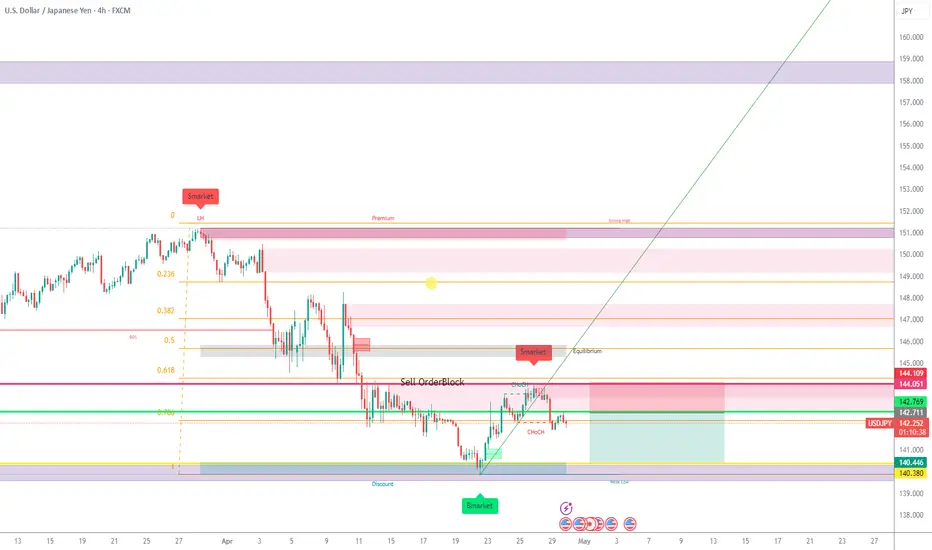
USDJPY Bearish Forecast, More Bearish Order FlowAfter the recent change of character from Monday, UJ continued lower and broke the H1 structure. As we all know, whenever you get a break of structure, expect a pullback. On the H4 there is a nice bearish OB which serves as a nice point of interest for price to rally back towards, be mindful this OB is big so we don't know what to expect once price reaches it.
For now this is how I see the dollar heading towards.

USDJPY ready for another drop?After daily break of structure USDJPY just has managed to form another head and shoulder with strong liquidity grab has started to move in the major direction of the trend. After yesterdays drop, price today so far has done pullback and formed another possible bearish market structure.
As of upcoming USD and JPY news may push that price back to the support as shown in sketch.
A sell trade is high probability

USDJPY sell (h4)Price is oversold in the h4 time frame according to the stochastic indicator which mean it is most likely going to pullback into the sell order block or liquidity zone then potentially travel down.
safe entry idea:
wait till price enters the liquidity zone (sell orderblock) and wait for the stochastic indicator to be overbought then enter.
or you could set a pending order for when price touches and rejects the sell orderblock
Good Luck!
USD/JPYThe Japanese Yen (JPY) oscillates in a narrow trading band at the start of a new week and remains close to a two-week trough touched against its American counterpart on Friday. Mixed signals from the US and China temper hopes for a quick resolution of the trade conflict between the world's two largest economies, which, in turn, offers support to the safe-haven JPY. Moreover, expectations that Japan will strike a trade deal with the US turn out to be another factor underpinning the JPY.
Meanwhile, investors have been scaling back their bets for an immediate interest rate hike by the Bank of Japan (BoJ) as rising economic risks from US tariffs overshadow signs of broadening inflation in Japan. This holds back the JPY bulls from placing aggressive bets, which, along with a modest US Dollar (USD) uptick, acts as a tailwind for the USD/JPY pair. However, the divergent BoJ-Federal Reserve (Fed) policy expectations should cap the USD and benefit the lower-yielding JPY.

#USDJPYTwo resistances are shown, which can be used to trade short. One signal is higher risk because it has a higher stop, and the other is lower risk.

The beginning of the carry trade unwind part 2?If we look at the chart, the current structure looks very similar to what happened right before the market decline in August.
We've formed a head and shoulders (albeit not perfect as it's slanted), and price seems to be breaking down.
If price action accelerates to do downside, it's likely to take the market with it just like it did the last time.
Paying attention to this over the coming weeks.

USDJP WEEKLY UPDATESHello folks, if you're following
this idea since, then the higher chances are, you win the trade on my short idea before.
Now I'm expecting lows again, This idea is on weekly gap to be filled.
Chart are on 4HTF. this idea are on weekly.
It might retrace, but the weekly timeframe still on bearish.+
This is not a financial advice, follow for more.

Keep Your SHORT (USDJPY)FOREXCOM:USDJPY
This pair is keep on going down, testing the strongest support level at 140, but if we look at the weekly time frame, we'll see that this pair is forming head & shoulders pattern which is a bearish pattern.
So keep your short and set your TP to 138 - 136.

Japanese Yen seems poised to appreciate further against weaker UFrom a technical perspective, the daily Relative Strength Index (RSI) is already flashing slightly oversold conditions and warrants some caution for bearish traders. Hence, it will be prudent to wait for some near-term consolidation or a modest bounce before positioning for an extension of the USD/JPY pair's well-established downtrend witnessed over the past three months or so.
In the meantime, attempted recovery might now confront some resistance near the 141.60-141.65 region. This is followed by the 142.00 round figure and the 142.40-142.45 hurdle, above which a fresh bout of a short-covering move could lift the USD/JPY pair to the 143.00 mark en route to the 143.25-143.30 zone. Any further move up, however, might still be seen as a selling opportunity.
On the flip side, a sustained break and acceptance below the 141.00 mark could be seen as a fresh trigger for bearish traders and makes the USD/JPY pair vulnerable. The subsequent downfall below the 140.45-140.40 intermediate support might expose the 140.00 psychological mark. The downward trajectory could extend to the 2024 yearly swing low, around the 139.60-139.55 region.

USDJPY Outlook – Bearish Continuation or Bullish Reversal??In this analysis, I'm breaking down the USDJPY structure starting from the 4H to identify the overall market direction (Bearish/Sells), then zooming into the 1H to fine-tune potential trade setups.
On the 4H timeframe, we’re assessing whether the recent bearish momentum is likely to continue or if price action is showing early signs of a bullish reversal. The LOW created at 141.800 level is our first target IF we continue to sell as its creating that LowerLow.
IF price closes bullish above 142.500, I will switch sides and look for potential buys.
On the 1H timeframe, I’m watching for a bullish liquidity sweep below141.888, followed by a clear break of structure to the upside on the 15m or 1H for more confirmation. That would indicate smart money accumulation and a potential shift in market sentiment—giving me confirmation to start looking for long setups.
🚀 Give me a boost and follow for upcoming $niper entries this week! 🦇🔥
CMCMARKETS:USDJPY

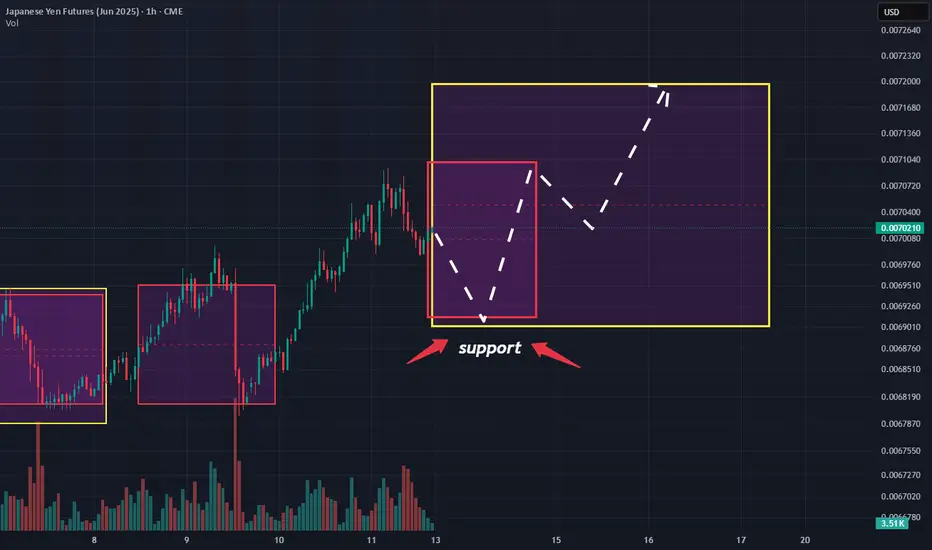
Yen Outlook: Preparing for the Coming Week! During the recent short trading week, we did not observe significant changes in the portfolios of major players. No outflows or overbought conditions—this indicates that the targets remain unchanged, and we are getting closer to the 0.0072 mark. 📊
I recall how, back in mid-December of last year, we noticed the first signs of volume accumulation in the portfolio. It felt like discovering a new horizon! We shared this insight with our subscribers, allowing us to prepare a plan in advance and identify well-founded entry points for the rise of the yen futures. 🚀
Currently, as we maintain a long position on the futures (or a short on the dollar/yen pair), it is essential to keep in mind the boundaries of the expected volatility range.
We have marked these on the chart: the yellow rectangle for Monday and the red rectangle for the upcoming week. 📅
Given the sustained positive sentiment surrounding yen futures, opening a long position as the price approaches the lower boundary of the range could present an excellent opportunity . As indicated by the arrows on the screenshot, don’t miss your chance! 🎯
Summary, we see that the yen continues to be in focus, and we have a clear action plan. We are holding our long position, monitoring the range boundaries, and preparing for the opportunities the market presents. 🌈
No Valuable Data, No Edge!

USDCAD and USDJPY Analysis todayHello traders, this is a complete multiple timeframe analysis of this pair. We see could find significant trading opportunities as per analysis upon price action confirmation we may take this trade. Smash the like button if you find value in this analysis and drop a comment if you have any questions or let me know which pair to cover in my next analysis.

USD/JPY) demand and supply analysis ); Read The ChaptianSMC Trading point update
shows a bearish setup for USD/JPY on the 1-hour timeframe. Here’s a breakdown
---
1. Trend Context:
Downtrend: The pair is clearly in a bearish channel, forming lower highs and lower lows.
200 EMA (~146.297) is above price and sloping down — confirms bearish bias.
---
2. Key Zones Identified:
Supply Zone (~144.800–145.200): A strong area of resistance where sellers may re-enter. If price returns here, it’s a potential short setup.
Demand Zone (~142.800–143.100): A possible reaction point where short-term buyers may provide a bounce.
Target Point (~141.168): A projected target if the downtrend continues and demand zone fails.
---
3. Expected Scenarios:
Primary Bearish Move:
Price may react from current levels or from the demand zone.
A pullback to the supply zone is expected before continuation downward.
Then, sell-off toward the target zone around 141.168.
Alternate Play:
Price could bounce between the demand and supply zones a bit more before breaking down.
---
4. Indicators:
RSI (~46.37): Shows room to the downside before oversold, aligning with bearish momentum.
Mild bullish divergence in RSI recently, suggesting potential for a small pullback or bounce.
Mr SMC Trading point
---
Summary of Idea:
This is a sell setup:
Sell entries: Ideal around the supply zone (144.8–145.2).
First target: Demand zone (~143.0)
Final target: 141.168
Invalidation: Break above 146.30 (200 EMA and channel resistance).
pales support boost 🚀 analysis follow,)

Short USDJPYEcon factors: Fed to lower interest rates, weakening USD
Weekly: Downtrend
Daily Factor: LHs, LLs
Hourly: Identify a place where liquidity is strong to go short.

USD/JPY Bullish Breakout Setup – Entry, Stop Loss & Target AnalyPair: USD/JPY
Timeframe: 15 minutes
Indicators Used:
EMA (30-period) – Red line
EMA (200-period) – Blue line
Chart Features:
Downward channel (declining trendline)
Identified entry point, stop loss, and target
Key support/resistance zones shaded in purple
🟢 Trade Idea Summary:
🔹Entry Point: 143.126
🔹Stop Loss: 142.702
🔹Target (Take Profit): 148.249
🔹Risk/Reward Ratio: ~1:5 (Excellent R/R)
🔍 Technical Analysis:
✅ Bullish Breakout Signal
Price has broken above the descending channel and has retested the breakout area (highlighted purple zone) – a classic bullish breakout structure.
The breakout retest near 143.126 is acting as support, with potential to launch a new bullish move.
📈 Moving Average Analysis
EMA 30 is starting to flatten and curve up – indicating potential shift in momentum.
EMA 200 is still above price, but a breakout above it could strengthen the bullish case.
🔁 Support and Resistance
Strong support zone around 143.000 – 143.200 area (highlighted zone).
Major resistance and target zone is between 148.000 – 148.250.
🔔 Trade Plan Suggestion:
Go Long at or near 143.126
Place Stop Loss below support at 142.702
Target 148.249 for profit
Reasoning:
This setup offers a trend reversal potential from a downtrend to uptrend, with a clean breakout-retest-confirmation pattern. The wide take profit range gives room for extended upside as momentum builds.
⚠️ Watch For:
Reaction to the 144.325 (EMA 200) level
Increased buying volume to confirm breakout
Any re-entry into the channel (would invalidate setup)

Quotes Dropping? Here’s How to Find Support & Gain Best DealHave you ever found yourself wondering how to make sense of fluctuating quotes?
What if I told you that the powerful key lies in understanding the power of expected range volatility?
Ready? Let me 5 min to introduce you how understanding expected range volatility can give you the edge you need to succeed.
The expected range volatility (ER) provides a framework for understanding how much the asset could move within a specific timeframe. Statistically, price movements within the expected volatility corridor have a 68% probability, based on CME market data and a Nobel Prize-winning calculation formula. This means that traders can rely on these insights as a powerful filter for making more precise entry points into trades.
Key insight: when the market is quiet, and we approach certain price levels, there’s a 68% chance that the price won’t break through those boundaries.
The ER formula is available on the CME exchange's website, and in just a few minutes, you can input the data to get incredible results. It’s truly amazing!
I remember the first time I stumbled upon the ER tool. It felt like finding a gold mine in the trading world! I was amazed that such a powerful resource was available for free, yet it remained unnoticed by 95% of traders.
At that moment, I began to explore the trading community and was shocked to see how underestimated this tool was. I couldn’t find a single author who utilized such valuable data in their analysis.
But once I began to focus on expected range volatility and the data provided by the CME, everything changed. Since that I never make intraday trades without ER data was checked.
Limitations:
• Market Dynamics: Short-term price movements can be unpredictable due to various factors like market sentiment, news, and economic events. The Expected Range provides a statistical estimate but does not guarantee outcomes.
• Assumptions: The formulas assume that price movements follow a log-normal distribution , which may not hold true in all market conditions.
So, what about you? Do you utilizing the power of expected range volatility in your trading strategy? Share your thoughts in the comments below! And if you want make deeper insights , don’t forget to subscribe us.
In the world of trading, knowledge is power.
No Valuable Data - No Edge!🚀💰
USDJPY RETRACEMENT Still on bearish,
If price action will not displace a body of a candle on our breakout the price will go up on our RETRACEMENT area 145.570

Short! I opened two short positions yesterday. I have a few short positions that I opened last week, but I feel comfortable adding more now.
Entry - blue horizonal line in the chart.
Stop loss - red horizontal line in the chart.
Target 1, 2, 3 - black horizontal lines in the chart.
If it hit target one, I will move a stop loss to the entry position.Target 1 is the previous month low so I anticipate some correction. Once it resumes the downward movement, I plan to add position.
4H RSI provides reliable indication for pull back or trend reversal. So I will keep an eye on it.
If you are interested in knowing my reasoning for my bearish bias, please check out the linked articles I published last week.

USD/JPY Bearish Reversal Setup – Short from Resistance ZoneCurrent Price: ~146.252
EMA 30 (Red): ~146.573
EMA 200 (Blue): ~146.662
The price is below both EMAs, suggesting short-term bearish momentum.
📉 Trade Setup:
Entry Point: 146.551 (marked on the chart)
Stop Loss (SL): 148.514 (above resistance zone)
Take Profit (TP): 142.374 (marked as “EA TARGET POINT”)
Risk/Reward Ratio (RR): Approx. 1:2.5+
📌 Zone Analysis:
Resistance Zone: 147.6 – 148.5 (highlighted in purple)
Previous highs rejected from this level multiple times.
Sellers appear to be defending this zone strongly.
Support Zone: 142.3 – 143.0
Previous accumulation zone marked for the TP.
🧠 Bias & Interpretation:
Bearish Bias: Confirmed by:
Price rejection from resistance.
Below both EMA 30 & EMA 200.
Bearish engulfing patterns near the resistance zone.
Potential Strategy: Short from 146.551 targeting 142.374 with tight SL at 148.514.
⚠️ Watch for:
Any bullish crossover between EMA 30 and EMA 200 could shift momentum.
False breakouts above the resistance zone before actual reversal.
Key U.S. or Japan news that may cause volatility.

USDJPY SHORT LIVE TRADE AND EDUCATIONAL BREAKDOWNUSD/JPY tumbles below 147.00, awaits US CPI for fresh impetus
USD/JPY has come under intense selling presure and drops below 147.00 in the Asian session on Thursday. The US-China trade war escalation and the divergent BoJ-Fed policy expectations underpin the Japanese Yen and weigh heavily on the pair amid a renewed US Dollar downtick. US CPI awaited.

USDJPY Bearish Flag Breakdown – Eyes on 140.11 Support ZoneUSDJPY is showing signs of a bearish continuation, following a breakdown from a rising wedge pattern. The recent strong drop confirms a shift in momentum from bullish to bearish, with price now forming a bear flag just below a key structure.
Key Technical Zones:
Current Price: 147.78
Resistance Area (Invalidation Zone): 148.11 – 151.44
Support Targets:
TP1: 142.87
TP2: 140.11
Technical Confluence & Patterns:
✅ Series of Rising Wedges followed by sharp breakdowns
✅ Bear Flag Pattern forming after recent drop
✅ Lower highs & lower lows confirming downtrend
✅ Volume spike during breakdown, low volume on pullback
Trade Outlook:
📉 Bias: Bearish below 148.11
📌 Entry Zone: On confirmation of flag breakdown
🎯 Target 1: 142.87 – Previous horizontal support
🎯 Target 2: 140.11 – Major swing support / demand zone
🛑 Invalidation: Break above 151.44 (major resistance zone)
Conclusion:
USDJPY is set up for a potential bearish continuation as it respects a textbook flag breakdown setup. A close below 147.50 would reinforce bearish pressure with further downside toward 142.87 and 140.11. Traders should monitor momentum and structure confirmation before entering positions.
Let me know if you want a short caption or video script version! 📉
