Short Opened a short position based on 1H and 15 minutes.
1H MACD crossed to the downside.15 min MACD endered the bear zone.The 15 min candle closed below VWAP, EMA 21, Pivot R1, and previous day's high. S/L 159.95 and P/T 153.95 Risk: Reward 1:1.84
When the price reaches 154.5 (the previous day mid price), I will move my stop loss to the previous day high.
Usdjpyshort

USDJPY SELL: My First 2025 trade. Good morning traders and Happy New Year.
This is my first 2025 trade: USDJPY Sell. Analysis or commentary will come later.
Cheers and Happy trading.

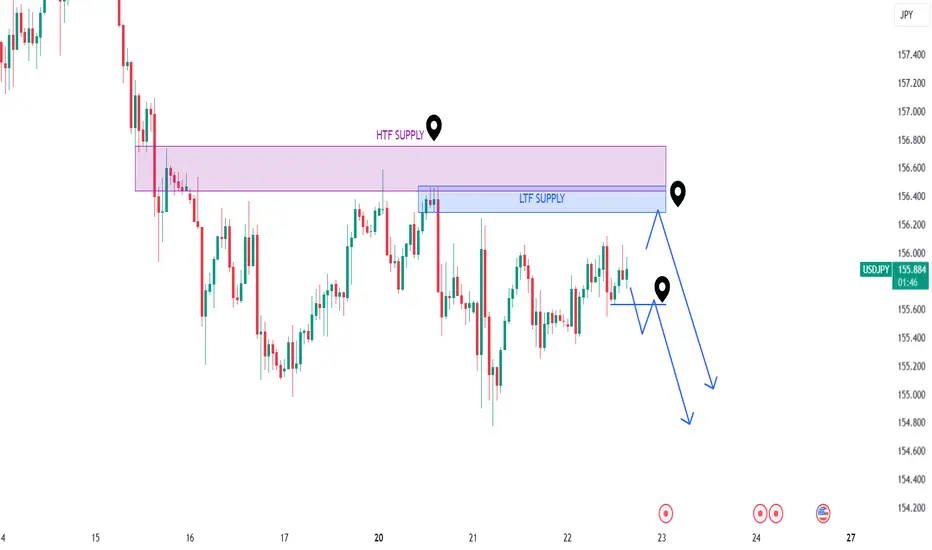
UsdJpy short biasI'm watching out for 155.468 which is my point of interest to short down to my next Draw on Liquidity as shown in the chart.
Ride with me

WEEKLY RECAP - Week 1, 2025The most important thing to reflect on each week is NOT your profit and loss balance.
Instead, reflect on these three questions:
- Did I follow my core habits for success?
- Am I ready to let my attachments from last week go?
- Am I focusing on this current moment, or a destination I'm trying to reach?
I won't put a whole lot of words here. It's all in the video, but here are the three setups from last week, and here is my notion journal so you can follow along.
USDJPY
EURUSD
EURUSD
Notion Journal
Enjoy the ride,
-Gio

USDJPY Shorts Based on Current Re-DistributionBy combining Wyckoff and SMC principles we have a clear guide on what to expect, and what to do when it happens.
Patience is the name of the game, so set your alerts and hang tight until then.
- Option 2 could turn into a short term swing trade (until we reach daily demand levels)
USDJPY trying to fetch more sellersUSDJPY seems trying to fetch more sellers before the big plummet while also trying to setup buyers into the wrong side of the Market.

USDJPY SHORT: FOMC ON TAP! We expect the FED to lower rates as expected. We could see the dollar become weaker against the Yen if we do not get any unexpected surprises today from the FED.

Setup #001 - USDJPY - ShortLooking for a short entry to trigger between 10am and 12pm ET today.
Probably not going to get it, price looks like it wants to melt for the CB Consumer Confidence release at 10am.
We'll see.

UsdjpyWaiting for a nice market rejection ,4hr bout to close so i will be looking for downside ideass

USD/JPY Ready For Sell To Give Us 250 Pips In The Next Days !This Is An Educational + Analytic Content That Will Teach Why And How To Enter A Trade
Make Sure You Watch The Price Action Closely In Each Analysis As This Is A Very Important Part Of Our Method
Disclaimer : This Analysis Can Change At Anytime Without Notice And It Is Only For The Purpose Of Assisting Traders To Make Independent Investments Decisions.

SELL USDJPY H4 | FOREX BEEHey Traders,
This USD/JPY H4 chart appears to show a descending triangle formation, typically signaling a bearish continuation pattern. The key levels and considerations are:
1. Trend Analysis:
- The market seems to have broken the ascending trendline (blue) decisively, suggesting strong bearish momentum.
- The price is currently trading below key resistance zones (highlighted in red).
2. Fibonacci Level:
- The 0.618 Fibonacci retracement (155.01) was tested but failed to hold, further indicating bearish strength.
3. Target Zones:
- A bearish move toward the next demand zone near the 0.236 Fibonacci level (~151.18) appears likely, as marked on the chart.
4. Retest and Continuation:
- The blue arrow suggests a possible retest of the broken support-turned-resistance zone before continuing downward.
### My Thoughts:
The chart indicates bearish bias, with the next likely target near 151.18. However, monitoring the retest area closely for rejection signals to confirm the continuation is essential. Fundamental factors like USD or JPY economic data can further drive this movement.

Scenario on usdjpy 23.1.2025 The market has formed sfp above the high which gives me an idea of where the market could go the likely scenario is a return back to the price around 158 from where a rebound and return back to lower levels could follow

USDJPY Short? Patience is key hereYes, price reached the white Center-Line, which means: Price is at balance.
And yes, price is at the red U-MLH, which means: price is stretched.
Two good indications that a potential breather is lurking in the throat. But I'd better wait for more evidence. More momentum to the south.
Not stalking yet, but observing on the lower time frame too.

USDJPY - Idea for a long !!Hello traders!
‼️ This is my perspective on USDJPY.
Technical analysis: Here we are in a bullish market structure from daily timeframe perspective, so I look for a long. My point of interest is rejection from bullish OB + institutional big figure 154.000 + trendline.
Like, comment and subscribe to be in touch with my content!

USD/JPY Short Scalp-USD/JPY has been pulling back for the past 12H, it is currently trading below a Trading Range and could evolve into a bear flag. Bulls do not show significant buying. FX:USDJPY
There is an extending triangle and an inside triangle forming, and could be sign of bears stepping in.
Target is 155.00, might not get it today but trade may evolve over next week depending on volatility.
Careful short, evolving

USD/JPY, Where to Next?As explained before before, USD/JPY drowned almost two percent this week, three scenarios can play out next:
- Bearish scenario: Current 4H chart is evolving into a bear flag from previous TR, bears could get a second or third (depending on ur analysis) leg down towards 154.00 target:
-Bullish scenario: Bulls could fight of the downtrend and reclaim 156.000 to evolve into a trading range. This will be hard as they have to reclaim 20 EMA where bears might be present. Bulls would need to show consecutive buying to show they are back in control.
-Sideways trading: Trading could be sideways to reach 20 EMA on the daily before next move is decided.
So far, odds favour the Bear scenario, the longer we stay below the trading range, the more likely bears are will get their bear leg.
- Scalp idea for the day traders:
Currently, theres an extending triangle evolving with an inside wedge top, this could be a sign bears are stepping in again. Bulls did not show strength at start of day, they got two small legs, but were not satisfied, likely to start selling again. Day could evolve into trading range day depending on reaction at day open.
If extending triangle plays out and there's consecutive selling, 155 is the target with 20 EMA acting as resistance.
Peace,
B Setup

Bottom Wedge USD/JPY - Which side will we see a breakout from ?
-> Following FX:USDJPY downfall, price almost fell two percent this week.
-> Bottom wedge was identified, which side it will break down to is still to be determined. Either way, an upside breakout can justify a scalp on 5-15 min timeframe a after consecutive bull bars are seem. Looking at the other side of the coin, a downside breakout would lead to a third leg down a indicate that the bear trend is soon halting or reversing.
-> Most importantly, be cautious and patient with such trades, wait for breakout and follow through buying- or selling- to place trade. Remember that USD/JPY is reversing with a strong Yen and odds favour bears, as seen with bear flag on this 4h chart:
Will the bear flag will get a secong leg and gain downside momentum?, or will we have a failed trading range breakout with a short term reversal around the 156.000 area is still to be determined.
B setup
Peace

USDJPY Selling Opportunity 13/01/2025
HTF Bullish
MTF Already Changed Structure From Bullish To Bearish
Waiting For Price To Mitigate OB on M15
Also Look At My GBPUSD bulls might me coming in indication USD getting Weak
that's why USDJPY might start selling

USDJPY Selling Opportunity 13/01/2025
HTF Bullish
MTF Already Changed Structure From Bullish To Bearish
Waiting For Price To Mitigate OB on M15
Also Look At My GBPUSD bulls might me coming in indication USD getting Weak
that's why USDJPY might start selling

USD/JPY showing weaknessThe USD/JPY pair has been fluctuating within a range. Recent data shows the price closing around 157.30, indicating some stability in the short term. Key support levels are around 156.24, while resistance levels are near 158.421. These levels can act as potential entry or exit points. so 156 will be a good level to short wit a red 4h candle closed near. Nver enter after a green candle only after a 4h bearish candle closed bellow 156.24. SCALP target @156.244 SWING Target @153.160

USD/JPY: where is my carry trade?Hi everyone,
Since my last idea, a lot has changed. My swing target of 150 was reached, and buyers took over in December. Recently, USD/JPY hit a 6-month high of ~158.5.
Since that low at 150 in December we saw different major signals from UJ:
"When the last buyer died..." buyers volume spike on 19 of December. Healthy accumulation on 4 of December supported the rally, showing more love for the dollar than yen.
"Heyyy, I know this thing—order block!" Post-Dec 19, price rose to 158.4 with waning buyer volume and mounting shorts. OB or just noise? Suspicious either way.
"Is this still an uptrend?" Price action shows small but consistent higher highs/lows. Volatility indicators hint at rising consolidation.
"Dollar supremacy forever?" Yes, dollar is stronger, but corrections happen. Whether at 70 or 175 USD/JPY, dollar will still be stronger.
"BoJ wouldn't intervene before 160. Are they bluffing?" May be possible, but I doubt it. The finance minister concern was very high yen depreciation and they mentioned that "we wouldn't let USD/JPY reach 160". But Japan’s MO is more stealth than spectacle I think.
Lastly, for my technical analysis lovers, pitchforks . Pitchforks are a more "hipster" way to draw trendlines. Maybe also more mathematical way. They are easy, but advanced pitchfork usage may be tricky.
As you see in the chart, we’re stuck between an upper bound and a demand zone. This supports my idea of consolidation, since the demand zone and the upper pitchfork are the current support and resistance.
Another one for tech analysis lovers. Elliott Waves . There is a possibility that we are in the so called "elliot correction waves", which is often seen after an uptrend. Leg A was the summer drop, leg B took us to 158.5, and leg C could dip us to 136–146. Probability? No idea, but the range fits the pitchfork, Elliott theory, and interest rate differential. Your guess is as good as mine.
Chapter 1: Rising Distribution – Not Your Average Wyckoff
The distribution I am talking about is not the Power of Three or AMD distribution concept. For old school lovers, the distribution I mean is based on Wyckoff method. Wyckoff was an analyst who described the difference between trends and ranging markets way before traders had 3 screens with gradient indicators and fancy ways to detect the regime.
In his method, there is a thing called "distribution". It is when the institutions are fed up with the uptrend and want to sell an asset. This is also when the "buys" are transferred from institutional hands to our, normal traders, hands. How does it work? FOMO, news and herd instinct. This is where "don't stand in front of an ultra-fast train" fails.
Classic Wyckoff distribution : the point where institutions get off the train, and retail traders hop on thinking it’s express to the moon. Rising distributions happen when the crowd still expects an uptrend, but the big players quietly exit. Seems like they have another train plan. At least, that's what the volume delta says. :)
Chapter 2: The Macro Mix
US is strong. Still solid. Even with inflation and bubbles, USD rides high thanks to its post-WWII economic dominance. This allows US to export their debt until today. Debt, tech booms, and AI surges aside, the system holds.
We’ve swapped dot-com booms (2000 DotCom Bubble) for AI hype and NVIDIA super-processors. Just like the early 2000s with software, we’re seeing another leap, but with AI, robotics, and LLMs instead of spreadsheets and PCs.
I wont mention any other issues with US economy, you could read that in my previous idea, and Trump tariffs wouldn't help it either, so everything stays the same.
Another thing, but not only concentrated on US: wealth gap. Wealth gaps grow, and some of the folks that were living right in the middle, having more than enough, but not too much, are struggling financially now, or became rich and big. But blindly piling into assets isn't the answer. Markets shift, and the rich adapt.
If you want more insights about the wealth gap and how it may worsen the recession, check out the amazing videos from "Garys Economics" . A former Citi bank top trader, Gary specializes in forex, especially Yen and Swiss franc.
Chapter 3: Yen vs. Dollar Carry Trade
The interest rate differential is narrowing. BoJ raised their rates for the first time since the '90s. Japan’s deflationary pressures pushed change . Sure thing Japan has to change something, and they did and will do.
Japan is still a tech and automotive powerhouse, but monetary policy is tricky. Wouldn’t a cheaper yen help exports? Its complicated. Dollar and euro is still doing fine, being ones of the leading currencies in the world and also leading in exports. I don't think that matters that much.
Now, zoom out of the chart. Historically, USD/JPY was 138–145 at similar USD rates. Add the new yen rate, and voilà: you get my 136–146 range.
-----------
Finalizing, USD/JPY is my muse. It is my main trading currency, maybe the only one. The a constant battle between east and west, logic and mystery is truly beautiful. Since Dec 19, it’s been weird for most of us.
Currently with AI surging in trading, we see companies fighting to find the alpha in the market. The strategy that will always work, the key to unlocking the market. This goes on for years and didn't start only now. Markets evolve, new players enter, and unexpected events (Black Swans) rewrite everything. Nevertheless, the "holy grail" strategy doesn’t exist (yet).
More and more AI models are flexible and need to be improved faster and faster. So should your strategy be, even if you are not an AI.
AI or not, adaptability is your true alpha. I’ve also updated my own metrics, ditched outdated ones, and embraced new indicators and models.
Learn some coding. Python, R, and Pinescript will be as essential as Excel soon.
You could also start with pinescript by editing your indicators/strategies in a way, that your ideas are implemented in it.
Never stop learning, even when it feels like the market is gaslighting you.
Navigate the markets like an explorer: decode shifting patterns and embrace the unknown future.
Disclaimer: This analysis is for informational purposes only and does not constitute financial advice. Always perform your own analysis before making trading decisions.

USDJPY ANALYSIS IS READY TO FLY MUST READ THE CAPTION The chart for USD/JPY shows the following:
1. Timeframe: 1-hour chart.
2. Key Levels:
Target Zone: Around 159.100, indicating a potential bullish target.
Current Price: Approximately 157.933 (Sell) and 157.946 (Buy).
Stop Loss: Positioned near 157.226 to manage downside risk.
3. Technical Analysis:
Pattern: A potential rounding top or consolidation phase before a breakout.
Scenarios: Two possible bullish outcomes are shown with arrows:
A breakout above the resistance zone, aiming for the target zone (159.100).
A retracement followed by a bullish move.
Key Support Levels: 157.692 and below, which could act as critical zones to watch.
4. Moving Average: A moving average (possibly the 200 EMA) provides additional support near the stop-loss level.
5. Trading Idea: Buy opportunities are highlighted with strict risk management via the stop-loss placement.
The chart suggests bullish momentum but emphasizes careful monitoring of price action near key levels.

#USDJPY 2HUSDJPY (2H Timeframe) Analysis
Market Structure:
The price is currently testing a key resistance level, which has previously acted as a barrier to upward movement. Signs of rejection at this level indicate potential selling pressure.
Forecast:
A sell opportunity is anticipated if the price continues to face rejection from the resistance zone, signaling a possible move downward.
Key Levels to Watch:
Entry Zone: Near the resistance level after confirmation of rejection.
Risk Management:
Stop Loss: Placed above the resistance zone or recent swing high to minimize risk.
Take Profit: Target the nearest support levels for potential downside movement.
Market Sentiment:
Selling pressure is expected to dominate as long as the price remains below the resistance level, maintaining a bearish outlook.
